


Abstract
A key research priority for developing a human immunodeficiency virus (HIV) cure strategy is to define the viral dynamics and biomarkers associated with sustained posttreatment control. The ability to predict the likelihood of sustained posttreatment control or noncontrol could minimize the time off antiretroviral therapy (ART) for those destined to be controllers and anticipate longer periods off ART for those destined to be controllers.
Mathematical modeling and machine learning were used to characterize virologic predictors of long-term virologic control, using viral kinetics data from several studies in which participants interrupted ART. Predictors of post-ART outcomes were characterized using data accumulated from the time of treatment interruption, replicating real-time data collection in a clinical study, and classifying outcomes as either posttreatment control (plasma viremia, ≤400 copies/mL at 2 of 3 time points for ≥24 weeks) or noncontrol.
Potential predictors of virologic control were the time to rebound, the rate of initial rebound, and the peak plasma viremia. We found that people destined to be noncontrollers could be identified within 3 weeks of rebound (prediction scores: accuracy, 80%; sensitivity, 82%; specificity, 71%).
Given the widespread use of analytic treatment interruption in cure-related trials, these predictors may be useful to increase the safety of analytic treatment interruption through early identification of people who are unlikely to become posttreatment controllers.
A priority for developing a human immunodeficiency virus (HIV) cure strategy is understanding the viral dynamics and biomarkers of HIV posttreatment control to achieve antiretroviral therapy (ART)–free remission in people with HIV (PWH) [1, 2]. Although ART is highly successful at preventing HIV replication, it is not curative [1]. HIV rebounds predictably in most PWH on interruption of ART, even if treatment was initiated early or administered for a prolonged period [3–5]. A rare subset of individuals who interrupt ART demonstrate posttreatment control, defined as ongoing virologic suppression after ART pause or maintenance of a low virologic set point [1, 6].
During analytic treatment interruption (ATI), ART is interrupted in a monitored setting to determine the effect of interventions on time to rebound or virologic set point [7]. ATIs are not risk-free [7]; participants can experience acute retroviral syndrome, progressive decline in CD4+ T-cell count, and downstream consequences of immune activation, alongside the psychosocial consequences of being off treatment [8]. Sexual partners also bear risk, as participants are not virologically suppressed and may transmit HIV [9]. Existing guidance addresses these challenges [10–13] but limits the feasibility of participation in these studies for some individuals. Furthermore, monitored ATIs are costly, logistically complex, and labor intensive [7, 14]. The ability to predict who is likely to achieve posttreatment control during the earliest phases of ATI could minimize the duration off ART and maximize the safety of study procedures while making treatment interruptions more acceptable to PWH, their partners, and clinical providers [11, 15].
We developed a predictive model of HIV posttreatment control after ATI using published viral kinetics data. Principles outlined in this model could be used to distinguish potential controllers from noncontrollers during the first few weeks of an ATI, thereby minimizing the time that PWH who are potential noncontrollers remain off ART in future ATI studies.
METHODS
Data Sets
Data on HIV kinetics were obtained from the Control of HIV after Antiretroviral Medication Pause (CHAMP) study [6], which included a portfolio of Advancing Clinical Therapeutics Globally for HIV and Other Infections studies (Table 1) [16–30]. CHAMP included PWH treated during early HIV infection and PWH treated during chronic infection. Data were also obtained from the GS-US-382-3961 study, including individuals who were partial virologic controllers before ART (pre-ART plasma HIV-1 RNA, 50–5000 copies/mL) and who interrupted therapy after randomly receiving vesatolimod (a Toll-like receptor 7 agonist; n = 17) or placebo (n = 8) [30]. Posttreatment control was defined as plasma viremia ≤400 copies/mL at 2 of 3 time points for ≥24 weeks. Data from 298 PWH were analyzed, with 73 identified as posttreatment controllers.
Clinical Studies Containing Human Immunodeficiency Virus Viral Kinetics Data Used to Generate Mathematical and Machine Learning Models
| Study [Reference]a | Participants, No. | ||
|---|---|---|---|
| Total | Underwent ATI | PTCs | |
| ACTG 371 [16] | 121 | 72 | 11 |
| ACTG A5024 [17] | 81 | 52 | 2 |
| ACTG A5068 [18] | 97 | 82 | 8 |
| ACTG A5102 [19] | 47 | 46 | 0 |
| ACTG A5130 [20] | 29 | 29 | 0 |
| ACTG A5170 [21] | 167 | 142 | 7 |
| ACTG A5187 [22] | 20 | 20 | 1 |
| ACTG A5197 [23] | 114 | 109 | 2 |
| Montreal PIC [24] | 83 | NA | 6 |
| Seattle Primary Infection Program [25] | 329 (Cohort) | 27 | 3 |
| UCSD PIC [26] | 616 (Retrospective analysis) | 16 | 0 |
| NIH therapeutic vaccine trial [27] | 31 (Enrolled) | 29 | 4 |
| UCSF OPTIONS [28] | 372 (Cohort) | Early treated, 86; long-term treated, 18 | Early treated, 8; long-term treated, 0 |
| Ragon HIV Controllers Group [29] | 1528 (Cohort) | NA | Early treated, 5; long-term treated, 10 |
| GS-US-382–3961 [30] | 25 (Vesatolimod, 17; placebo 8) | 26 Viremic controllers (pVL, 50–5000 copies/mL) | 6 |
Abbreviations: ACTG, AIDS Clinical Trials Group; ATI, analytic treatment interruption; HIV, human immunodeficiency virus; NIH, National Institutes of Health; NA, not available; PIC, Primary HIV Infection Cohort; PTCs, posttreatment controllers; pVL, plasma viral load.
aAll studies except the last one (GS-US-382–3961) were part of the CHAMP (Control of HIV after Antiretroviral Medication Pause) study.
Mathematical Model
Post-ATI plasma viral kinetics data and mathematical modeling were used to describe patterns of rebound after treatment (Figure 1A). Data sets with less frequent time points (eg, data set A5170) or significant missing data were excluded. Significant missing data or data sets with less frequent time points were excluded unless there were adequate data points to consistently characterize predictors with viral peaks inferred using modeling.
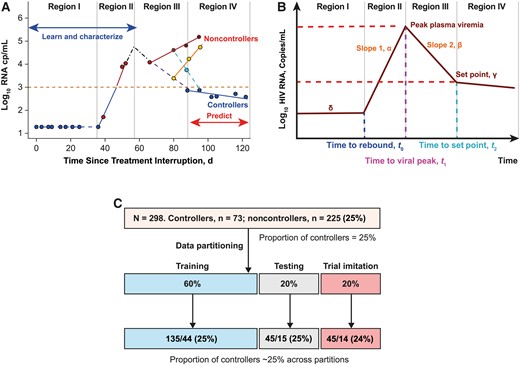
Model illustration. A, Typical viral kinetics of an analytic treatment interruption (ATI) clinical study participant through 4 different regions. Region I is the period when human immunodeficiency virus (HIV) RNA is at or below the limit of detection. Region II is the period when the virus rebounds, resumes replication, and accumulates to the peak; this region is followed by reduction of viral replication. Region III contains viral mixed kinetic patterns, and the boundary of this region corresponds with the viral nadir (or viral set point). Region IV is associated with steady increase in plasma viremia in noncontrollers and sustained reduced plasma viremia in controllers. Dots represent data points for plasma viremia. B, Viral kinetics shown in A are explained with a piecewise ordinary differential equation. The model describes the viral kinetics in each region with a parameter, and these parameters are used to learn and characterize early predictors (from regions I and II) that classify ATI long-term outcomes observed in region IV. C, Data partitioning into the training, testing, and clinical imitation subsets used to identify and validate the performance of the predictors. The distribution of controllers vs noncontrollers was ~25% and was balaned in each data partition.
A piecewise differential equation was used to model viral dynamics/kinetics:
Figure 1A and 1B describe the evolution of viral kinetics from time of treatment interruption to time of viral rebound at time, t = t0 (region I). This time was estimated as the time of viral rebound and the rate of viral change, dV/dt = 0, that is, V = δ, a constant that is equal to the limit of detection in virus RNA copies per milliliter. Within the time interval, t0 < t < t1 (region II), the model explains the viral growth rate at rate α per day, and the time t1 is the timing of viral peak. The HIV RNA level was obtained by solving dV/dt = α or dV/dt = αV , assuming either linear HIV RNA replication or exponential growth. Therefore, RNA quantities can be explained using the equations or , assuming linear or exponential viral growth. Within the interval t1 < t < t2 (region III), the HIV RNA level is given by , as explained in Figure 1A. Region II is defined by viral rebounding at the boundary (at t = t0) of region I and viral replication until viral peak at t = t1. In region III, the HIV RNA level is observed to decline until the viral set point is observed at t = t2. For the methods used to estimate viral dynamics, time to viral rebound, viral peak, and time to viral peak, see the Supplementary Methods.
Machine Learning: Classification and Regression Trees
A Classification and Regression Trees (CART) algorithm was applied to data generated from model fitting (Supplementary Methods). Model parameters were time to viral rebound (inferred value or observed time to first value above limit of detection), viral growth rate (magnitude of slope α), peak plasma viremia (computed or maximum plasma viremia observed within the first 6 weeks after viral rebound), and time to viral peak. Although predictive of the outcome in preliminary analyses, in the final CART algorithm, viral decline slope (β) and viral set point were not used because such parameters require prolonged observation off ART, and we elected to focus on variables that would enable making an early decision that could be applied to future trials in real time. Only parameters derived with data generated within the first 3–4 weeks after viral rebound (ie, regions I and II; Figure 1A) were used, ensuring that early viral kinetics patterns were used to classify long-term end points.
Data Partitioning
Combined CHAMP and GS-US-382-3961 (N = 298) data were randomly split into training (60%), testing (20%), and validation (20%) data sets (Figure 1C). The training and testing data sets were used to develop an outcome classification decision tree and to select the best classifiers. The testing data set was used to determine the sensitivity, specificity, and accuracy of the classifiers. The best classifiers were applied to the validation data set, imitating real-time clinical trial data collection. Parameters in regions I and II were computed with minimum data points as they accumulated; once data were sufficient to compute the parameters (within 3–4 weeks of viral rebound), the information was used to classify participants as controllers or noncontrollers.
Statistical Analysis
Computed variables between ATI posttreatment controllers and noncontrollers were compared using a Wilcoxon nonparametric test. Variables were considered significantly different at P < .05. CART analysis was performed using R software (rpart package).
RESULTS
Cohort Characteristics
CHAMP identified 67 posttreatment controllers from 14 studies, including >700 participants. Posttreatment control was defined as plasma viremia ≤400 copies/mL at 2 of 3 time points for ≥24 weeks. Characteristics of all CHAMP cohorts and the GS-US-382-3961 HIV controllers cohort have been described elsewhere [30].
Predictors of Post-ART Control and Noncontrol
We developed a segmented/piecewise model to explain participants’ viral kinetics after ATI (Figure 1, regions I–IV), estimating time to rebound, viral replication rate after viral rebound in region II, and viral peak. The median number of time points per person was 16 (95% confidence interval [CI], 9–38.9). Within the data set, 10% of data points were missing. The median time between visits was 4 weeks when including all time points and 1 week when considering data points observed within 10 weeks. Within the data set, the 3 required data points were present in 86% and missing in 14% of the study participants. Posttreatment controllers had significantly lower peak plasma viremia (median HIV RNA [95% CI], 2.55 [1.42–4.52] vs 4.58 [2.86–6.30] log10 copies/mL for posttreatment controllers and noncontrollers, respectively) (Figure 2A). The plasma viremia rate increase after rebound was lower for posttreatment controllers than for noncontrollers (Figure 2B). The median time to rebound for noncontrollers was ≤14 days versus >28 days for controllers (P < .001). No difference in time to peak between posttreatment controllers and noncontrollers (P = .18) was observed due to variable heterogeneity in the posttreatment controller group (Figure 2C). However, posttreatment controllers had a significantly shorter time from initial rebound to plasma viremia peak (P < .001); 75% achieved viral peak in approximately 21 days.
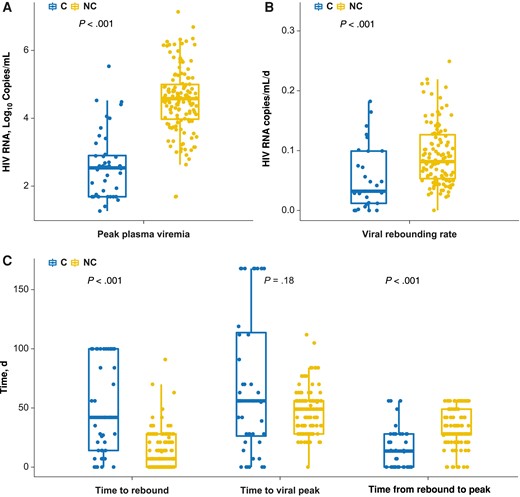
Statistical difference between analytic treatment interruption (ATI) controllers (C) and noncontrollers (NC). A, The peak plasma human immunodeficiency virus (HIV) viremia value observed within the first 4 weeks of viral rebound can distinctively separate ATI controllers from noncontrollers (P < .001). B, After rebounding, noncontrollers have a faster rebounding rate than controllers (P < .001). C, Difference between time to viral rebound, time to viral peak, and time from rebound to peak. The time to viral peak did not differ significantly between controllers and noncontrollers (P = .18).
The CART machine learning algorithm was applied to classify controller and noncontroller outcomes using descriptors of viral kinetics with data accumulated within regions I and II (Figure 1A). The classification of outcomes is provided in Supplementary Figure 1.
Figure 3A–3D depict the decision trees used to classify controllers and noncontrollers using the ATI outcomes of peak plasma viremia, viral replication rate after rebound, time to viral rebound, and time to viral peak. Table 2 provides the predictive sensitivity, specificity, and accuracy scores for these variables. Controllers and noncontrollers can be classified with a viral threshold (peak of rebound) of 3 log10 HIV RNA copies/mL, with sensitivity of 93% (95% CI, 82%–98%), specificity of 73% (48%–89%), and accuracy of 88% (78%–94%) (Figure 3A). Controllers and noncontrollers were given a predictive score based on the rate of viral replication after viral rebound (Figure 3B) (sensitivity, 98% [95% CI, 88%–99%]); specificity, 33% [15%–58%]; and accuracy, 82% [69%–90%]). A plasma viremia rate increase of <0.033 HIV RNA log10 copies/mL/d suggested that controllers had a slower viral replication rate when rebounding. However, there was considerable overlap in time to viral rebound between controllers and noncontrollers (75% of noncontrollers and 25% of controllers rebound within 21 days; Figure 2B).
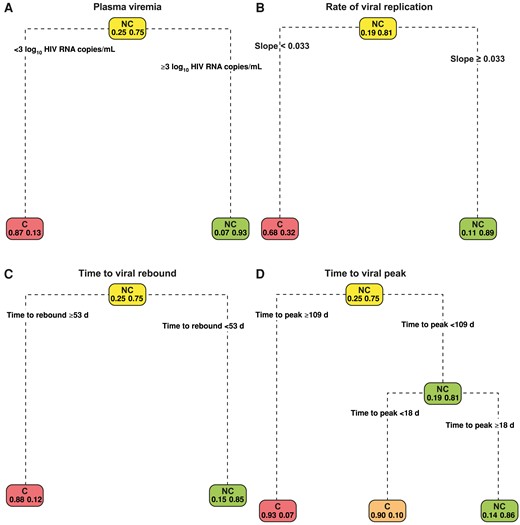
Decision trees showing classification of analytic treatment interruption (ATI) outcomes. The plasma viremia (observed viral peak) provides the best classification of controllers (C) and noncontrollers (NC). A, An ATI participant who attains a viral peak <3 log10 human immunodeficiency virus (HIV) RNA copies/mL is likely to be a posttreatment controller. B, Decision tree based on the viral slope (rate of viral replication). Noncontrollers are shown to be associated with a fast rate of viral rebounding speed. C, Time to viral rebound of ≥53 days likely predicts a controller. D, Short time to attain viral peak (<18 days) in a predicted noncontroller.
Prediction Scores in the Testing Data Set
| Score | Predictor (95% CI), %a | |||
|---|---|---|---|---|
| Viral Peak | Time to Rebound | Time to Peak | Rate of Viral Replication | |
| Sensitivity | 93 (82–98) | 96 (85–99) | 91 (79–96) | 98 (88–99) |
| Specificity | 73 (48–89) | 40 (20–64) | 40 (20–64) | 33 (15–58) |
| Accuracy | 88 (78–94) | 82 (70–89) | 78 (66–87) | 82 (70–89) |
| PPV | 91 (80–97) | 83 (70–91) | 82 (69–90) | 81 (69–90) |
| NPV | 79 (52–92) | 75 (41–93) | 60 (31–83) | 83 (44–97) |
| Prevalence | 75 (63–84) | 75 (63–84) | 75 (63–84) | 75 (63–84) |
Abbreviations: CI, confidence interval; NPV, negative predictive value; PPV, positive predictive value.
aThe viral peak (plasma viremia) provides the highest predictive scores. Time to viral rebound, time to peak, and speed of viral rebound produce higher sensitivities than plasma viremia in classifying noncontrollers. However, these poorly classify controllers (with specificities <41%).
Sensitivities of 96% and 91%, specificities of 40% and 40%, and accuracies of 82% and 78% for time to viral rebound and time to viral peak, respectively, are displayed in Figure 3C and 3D. The peak value for plasma viremia resulted in the best predictive scores. Although the plasma viremia rate increase after rebound had the highest sensitivity (98%), the specificity was 33%, suggesting misclassification of controllers as noncontrollers (when the positive test result is for noncontrollers). Time to rebound had a predictive threshold of <53 days, showing delayed time to rebound for controllers; however, its specificity was 40%, indicating misclassification of controllers (Figure 3C, Supplementary Figure 1A and 1D, and Table 2). The time to viral peak did not differ significantly between controllers and noncontrollers (P = .18), but the time fromviral rebound to peak did (P < .001); >75% of noncontrollers took >21 days to achieve viral peak, while 75% of controllers achieved viral peak within 21 days.
ART Restart Decision Rule
Figures 2 and 3 and Table 2 include evidence and a framework to construct an ART restart decision rule/criterion based on the clinical data. Figure 4 summarizes the derived decision rule that can be applied in real time to a clinical study to help predict, in a timely fashion (3–4 weeks after viral rebound), which participants will eventually become noncontrollers, so ART can be restarted without delay. The restart decision rule follows 3 steps, requiring weekly measurement of plasma HIV RNA. In step 1, after ATI, participants are followed up with weekly plasma HIV RNA measurements until a value above the limit of quantification is observed; the time is recorded as “time to viral rebound.” In step 2, plasma viremia is measured weekly for an additional 3 weeks to determine the viral replication rate and viral peak; this requires ≥3 quantifiable HIV RNA data points to compute the virus replication rate (ie, to accurately fit a linear regression line).
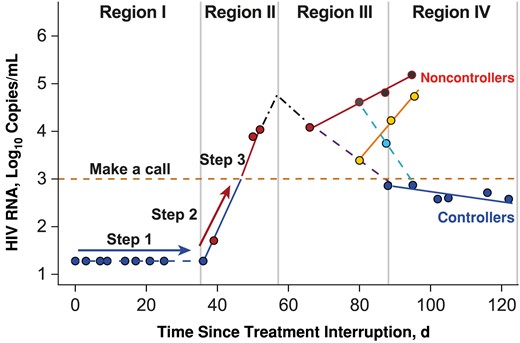
Decision rule on how to make a call. Step 1: Follow up the participant until an observation above the lower limit of detection is made; record this as the time to rebound. Step 2: Follow up the participant for 2 or at most 3 weeks. Record the human immunodeficiency virus (HIV) RNA level weekly, and record the slope of regression line (rate of viral replication) and HIV RNA level at week 3 (viral peak). Step 3: Make a call. If the plasma viremia at week 3 in step 2 exceeds 3 log10 copies/mL at any time within 2–3 weeks, the call is noncontroller; if the plasma viremia remains below 3 log10 copies/mL within 3 weeks, then the call is controller. Step 4: If results are on the borderline, check whether the time to rebound is <53 days. If <53 days, then the call is noncontroller; otherwise, the call is controller. On this step also, the regression line is used to consolidate the call; if the regression slope (rate of viral replication) is <0.033, then the call is confirmed as controller, otherwise an extra data point (week 4) is required. In region I, blue dots represent HIV RNA levels below the limit of detection. In region II, red dots represent HIV RNA levels above the limit of detection. Region III is a region of mixed patterns; red dots represent values that remain high, and yellow dots identify a pattern with an initial decrease in viral load but then with resumption of replication, ending with being a noncontroller. Cyan dots represent the opposite, that is, a pattern that reverses to viral control. In region IV, red and yellow dots above the yellow dashed line represent noncontrollers, and blue dots represent controllers.
If there are <3 consecutive quantifiable HIV RNA measurements during step 2, continue weekly monitoring until ≥3 consecutive quantifiable HIV RNA data points are available and a fitted regression line is recorded. The gradient (viral replication rate slope α) of the fitted regression line is recorded as the “viral replication rate.” Instead of waiting to observe the true viral peak, week 3 plasma viremia can be used as a surrogate and recorded as “week 3 viral peak.” In step 3, a decision to restart ART can be made, using ≤3 of the recorded variables (viral peak, time to rebound, viral replication rate) as >75% of noncontrollers peak after 21 days and >90% of noncontrollers have a viral peak value >3 log10 HIV RNA copies/mL (Figure 3A and 3C). Using 3 log10 HIV RNA copies/mL as a threshold (Figure 3A), if the viral peak (week 3 plasma viremia) is <3 log10 HIV RNA copies/mL, the participant is classified as a controller. If the plasma viremia is equal or approximately equal to the threshold at the boundary of region II and III (approximately 3 weeks from the time of viral rebound), the week 3 viral peak can be combined with the time to viral rebound or with the viral replication rate. If this does not clarify the decision, data collection can continue to week 4, at which point a decision to restart should be made if there is no improvement in decision clarity, as shown in Supplementary Table 1.
Clinical Trial Imitation: Clinical Utility
The restart ART approach (Figure 4) was applied to the clinical imitation data set (Figure 1C) to simulate how clinical decisions are made in clinical trial settings using data accumulated within the first 3–4 weeks after viral rebound. Table 3 shows the predictive scores with this approach using the plasma viremia threshold of 3 log10 HIV RNA copies/mL at 3 weeks and the plasma viremia threshold (3 log10 HIV RNA copies/mL) combined with time to viral rebound. Supplementary Figure 2 shows the comparison between viral peak and plasma viremia at 3 weeks and the comparison at both points between between controllers and noncontrollers. The week 3 viral peak alone achieved a sensitivity of 82% (95% CI, 69%–91%), a specificity of 71% (45%–88%), and an accuracy of 80% (68%–88%). The sensitivity dropped to 76% (95% CI, 61%–86%), while the specificity increased from 71% (45%–88%) to 79% (52%–92%) when the viral threshold was used in combination with time to viral rebound. However, there was no change in the predictive accuracy. An increase in the specificity suggests that combining these 2 predictors reduces misclassification of noncontrollers as controllers.
Clinical Imitation Data Set
| Scorea | Viral Peak (95% CI), % | Viral Peak + Time To Rebound (95% CI), % |
|---|---|---|
| Sensitivity | 82 (69–91) | 76 (61–86) |
| Specificity | 71 (45–88) | 79 (52–92) |
| Accuracy | 80 (68–88) | 76 (64–85) |
| PPV | 90 (77–96) | 92 (79–97) |
| NPV | 56 (34–75) | 50 (31–69) |
| Prevalence | 76 (64–85) | 76 (64–85) |
Abbreviations: CI, confidence interval; NPV, negative predictive value; PPV, positive predictive value.
aPredictive scores with this approach when a plasma viremia threshold of 3 log10 human immunodeficiency virus RNA copies/mL is used and when that threshold combined with time to viral rebound is used.
Supplementary Table 2 summarizes the clinical interpretation of these tests. If the test is used to identify noncontrollers in a study with 100 participants, including 76 noncontrollers and 24 controllers, it will correctly classify 82% of noncontrollers as noncontrollers and 71% of controllers as true controllers. However, it will misclassify 18% of the noncontrollers and 29% of the controllers.
DISCUSSION
A major priority in HIV research is to identify a curative intervention, recognizing that not everyone can access or adhere indefinitely to ART [31]. Currently, most cure studies require highly monitored ATIs, which are resource intensive and burdensome to participants [32, 33]. More importantly, they are associated with significant risks to participants and their sexual partners, especially regarding prolonged time off ART and prolonged periods of viremia while determining whether an individual will exhibit posttreatment control [9]. We used data from HIV treatment interruption trials to create a decision model to advise when ART should be resumed, based on the likelihood that a participant will achieve long-term control. Our model leverages clinical data collected within the first 3 weeks of virus rebound to classify participants as potential posttreatment controllers versus noncontrollers. If further validated in prospective studies, this approach could minimize time off ART, thereby maximizing safety for potential noncontrollers; reassure participants who wish to remain off ART that their continued participation in the treatment interruption is warranted; and help prioritize the timing of more intensive biologic investigations (eg, tissue biopsies) that are often informative in ATI studies. Overall, this data-driven approach could make ATI studies more accessible and acceptable to PWH who wish to minimize unnecessary time off ART.
Our approach is informed by 3 parameters obtained from plasma HIV RNA levels collected serially for 3–4 weeks after viral rebound: (1) viral threshold of 3 log10 HIV RNA copies/mL within 3 weeks; (2) time to viral rebound; and (3) rate of viral replication after viral rebound. For easy application of this approach, we recommend weekly collection of plasma viremia readouts using real-time plasma HIV measures instead of waiting for the true viral peak. These recommendations ensure that if the viral peak (which is sometimes not observable) takes >3 weeks to be observed, the real-time viral threshold of 3 log10 HIV RNA copies/mL within 3 weeks has a sensitivity of 82% versus 93% of the viral peak, while the specificity scores are 71% versus 73%, and accuracy scores are 80% versus 88%. This is supported by the finding that 75% of posttreatment controllers reach peak plasma viremia within 3–4 weeks, while >75% of posttreatment noncontrollers attain their viral peak after 4 weeks. Therefore, real-time plasma viremia within 3 weeks is used as a surrogate for viral peak. Moreover, 3 weeks ensures that 3 plasma viremia data points are collected, enabling a robust computation of viral replication rate through fitting a linear regression line. Classification can be obtained with plasma viremia as a predictor or biomarker, or this can be combined with time to rebound. However, if a decision cannot be made, the replication rate can aid in decision making.
Although many studies allow for participants to experience high-level viremia for prolonged periods to fully characterize the long-term set point, this typically requires waiting ≥8 weeks from the time of viral rebound. While this might be preferred in certain scenarios, the result is a prolonged—and perhaps unnecessary—amount of time off ART for noncontrollers. Similarly, time to rebound alone has a sensitivity of 96% in classifying noncontrollers, but it often misclassifies controllers as noncontrollers (40% specificity), which is likely to result in premature ART resumption in people who are likely to yield additional important data. This argument is also true for the rate of plasma viremia increase after rebound as a biomarker (sensitivity, 98%); however, this has a low specificity (33%) and an accuracy of 82%.
Our model's limitations can be minimized by increasing the frequency of plasma sampling, thereby improving the estimation of time to viral rebound and true viral peak. Although the frequency of plasma viremia sampling may be challenging to estimate, and the actual time of viral rebound may be difficult to measure, weekly readouts can improve model estimates. While these results are based on clinical data sets, they should be further validated in larger, independent, and more diverse data sets or cohorts. The participants we included comprised a mix of early-treated PWH, long-term treated PWH, and viremic controllers, complicating generalizability to a broad population. Moreover, the ATI studies used here were designed differently, with most not including an intervention, and it is unclear whether the model is applicable to interventional studies with strict virologic criteria for restarting ART [11]; obtaining clinical data with similar designs will improve the training and predictive accuracy of this method.
Finally, although we believe our model will promote safety by minimizing the duration of ART interruption for those who are likely noncontrollers, we note that a proportion of potential controllers (25%–30%) may still be misclassified as noncontrollers using this model. Given the potential insight to be gained from studying posttreatment controllers and the relative rarity of this phenotype, further optimization of models to accurately predict likely posttreatment controllers is needed. The approach described here might be considered too conservative, particularly in scenarios in which individuals have completed an intense intervention period. Contributors to misclassification may include features intrinsic to the model or to the nature of the data, such as the overall quality or heterogeneity of the data due to clinical factors (eg, treatment history, coinfections, quality/frequency of sampling, or others). Collecting frequent viral readouts (at least weekly) could potentially reduce misclassification, especially after viral rebound is observed. Our novel approach combines mathematical modeling and machine learning methods and could be useful in helping researchers and study participants based on the specific circumstances of the study and the participant.
In summary, we used machine learning and mathematical modeling to create a decision rule leveraging clinical data collected up to 3 weeks after initial virus rebound in ATI studies. Within 3 weeks of rebound, key virologic variables can serve as predictive biomarkers for ATI posttreatment control for trials that do not use strict virologic rebound criteria for restarting ART. Further development and refinement of this and similar models could potentially make ATI studies easier to perform, safer, and more acceptable to participants engaged in HIV cure research.
Supplementary Data
Supplementary materials are available at The Journal of Infectious Diseases online (http://jid.oxfordjournals.org/). Supplementary materials consist of data provided by the author that are published to benefit the reader. The posted materials are not copyedited. The contents of all supplementary data are the sole responsibility of the authors. Questions or messages regarding errors should be addressed to the author.
Notes
Acknowledgments. Editorial support was provided by Zela Keuylian, PhD, of Parexel and funded by Gilead Sciences. We thank the participants, site staff, and investigators of the clinical trials.
Author contributions. Study design: All authors. Data analysis and modeling: G. M. Data interpretation: All authors. Drafting and editing the manuscript: All authors.
Data availability. Data are available from the AIDS Clinical Trials Group on request. Data sets generated during the current study are available from the corresponding authors on reasonable request.
Financial support. This work was supported by the National Institute of Allergy and Infectious Diseases, National Institutes of Health (NIH) (grants AI068634, AI068636, and AI106701 [AIDS Clinical Trials Group]; AI150396 and AI060354 [to J. Z. L.]; AI164560 [to S. G. D.]; and AI157875 [to M. J. P.]); the Division of Intramural Research, National Institute of Allergy and Infectious Diseases, NIH; and the National Cancer Institute, NIH (contract 75N91019D00024).
References
Author notes
Potential conflicts of interest. G. M., E. V., D. S., and R. G. have stock or stock options in and are employees of Gilead Sciences. S. G. D. reports consulting fees from AbbVie, Eli Lilly, Enanta, GSK, Hookipa, and Immunocore; participated on an advisory board for American Gene Technologies; and owns Tendel stock. M. J. P. reports consulting for Gilead Sciences and AstraZeneca and receiving medical-legal consultation fees. All other authors report no potential conflicts.
All authors have submitted the ICMJE Form for Disclosure of Potential Conflicts of Interest. Conflicts that the editors consider relevant to the content of the manuscript have been disclosed.

