


Abstract
Atypical mononuclear cells (AM) appear in significant numbers in peripheral blood of patients with Epstein-Barr virus (EBV)-associated infectious mononucleosis (IM). We investigated the number and lineage-specific clusters of differentiation (CD) expression of atypical mononuclear cells in 110 children with IM using the anti-CD antibody microarray for panning leukocytes by their surface markers prior to morphology examination. The AM population consisted primarily of CD8+ T cells with a small fraction (0%–2% of all lymphocytes) of CD19+ B lymphocytes. AM amount in children with mononucleosis caused by primary EBV infection was significantly higher than for IM caused by EBV reactivation or other viruses and constituted 1%–53% of all peripheral blood mononuclear cells compared to 0%–11% and 0%–8%, respectively. Children failing to recover from classic IM associated with primary EBV infection within 6 months had significantly lower percentage of CD8+ AM compared to patients with normal recovery rate.
Infectious mononucleosis (IM) is a clinical entity characterized by fever, sore throat, and cervical lymph node enlargement, and less often by skin rash, splenomegaly, and hepatomegaly [1–3]. Most IM cases are caused by primary infection with Epstein-Barr virus (EBV), although IM has been reported to result from cytomegalovirus (CMV), human herpesvirus-6 (HHV-6), herpes simplex 1, human immunodeficiency virus-1 (HIV-1), rubella, and hepatitis as well as Toxoplasma gondii and Streptococcus sp. infections [4–6]. One of the characteristic features of EBV-associated IM is the appearance of atypical mononuclear cells (AM), that is cells 11–13 µm in diameter with abundant, sometimes basophilic, cytoplasm and perinuclear clearing (Figure 1A) in patients’ peripheral blood, as first described by Downey and McKinlay [7]. The cellular origin of AM is not clearly established but they are thought to result from the immune response to EBV and to be a part of a dramatic expansion of multifunctional cytotoxic CD8+ T cells specific for lytic, early, and intermediate-early EBV antigens seen in the first weeks after clinical onset of IM [8]. This supposition is supported by their sheer numbers (up to 50% of total lymphocyte content), as only the CD8+ lymphocyte population [3, 9] and to a lesser extent NK-cell subpopulation [10, 11] increase at the time of AM appearance, while CD4+ T-cell and B-cell numbers do not change that dramatically during the first weeks of IM [8]. The AM population in IM patients are found to be cytotoxic for EBV-transformed B-cell lines and to have no phagocytic activity [12], strongly supporting their CD8+ T-cell or natural killer (NK)-cell origin. Interestingly, at least 2 early reports found a small population of AM invoking a cytotoxic reaction similar to EBV-positive cell lines from normal lymphocytes and staining positive for κ and λ immunoglobulin light chains in some of the IM patients [12, 13]. However, these studies were never pursued further as there was no method for direct correlation of lymphocyte atypical morphology to the lineage-specific surface marker expression.
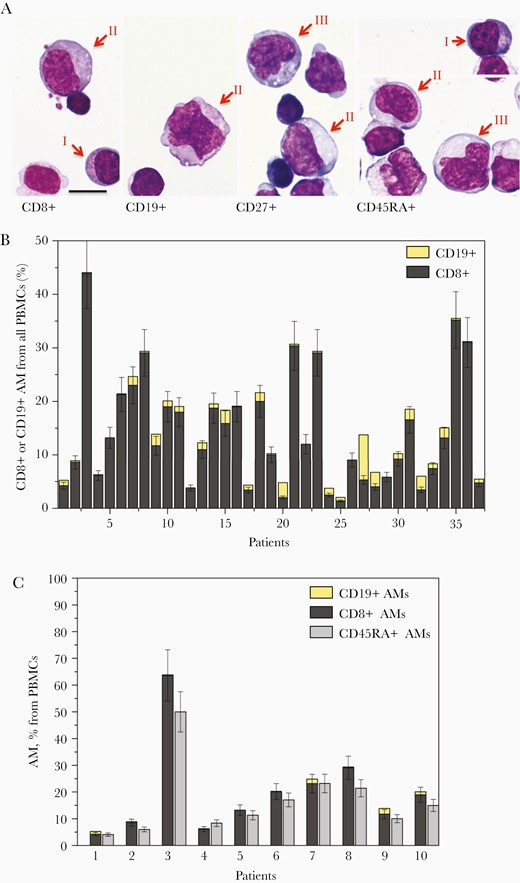
Morphology and percentage of CD8+ and CD19+ AM in peripheral blood of patients with primary EBV-infection on the anti-CD microarray. A, AM from patients with primary EBV-infection–associated infectious mononucleosis captured on the microarray by anti-CD8, anti-CD19, anti-CD27, and anti-CD45RA stained after May-Grünwald-Giemsa. AM are indicated by arrows, Roman numbers indicate the Downey cell types I, II, and III. The bar corresponds to 10 μm. B, The percentages of AM CD19+ and CD8+ among PBMCs of 37 patients with primary EBV infection determined as the density of AM captured by anti-CD8 or anti-CD19 normalized to the density of anti-CD45RA–bound PBMCs. C, The percentages of CD8+ and CD19+ AM among PBMCs and their sum compared to total percentage of AM from all PBMCs for the first 10 patients in (B) with primary EBV-infection. Abbreviations: AM, atypical mononuclear cell; EBV, Epstein-Barr virus; PBMC, peripheral blood mononuclear cell.
Most studies of IM are done in adolescents and adults. These studies permitted the formulation of the cost-effective diagnostic strategy for differential diagnosis of EBV-caused IM from mononucleosis-like illnesses caused by other viral, protozoal, or bacterial agents [5]. This strategy includes determination of AM in patients’ peripheral blood, the criteria of pharyngitis, adenopathy, lymphocytosis ≥ 50%, and AM ≥ 10% from all lymphocytes, and has up to 75% sensitivity and up to 99% specificity depending on the study [14, 15]. However, these criteria are not applicable to children as AM ≥ 10% is found in only about 50% of children with IM of EBV origin confirmed by EBV DNA positivity or anti-VCA IgM presence in peripheral blood [16–18]. The quantities and diagnostic value of AM in peripheral blood of children with EBV-associated IM have not been systematically studied.
Most symptoms of EBV IM disappear within a month, but 10%–13% of young adults do not recover for up to 6 months after first IM symptoms [19], still showing pharyngitis, fever of ≥ 37.5○C, or anti-VCA IgM presence in peripheral blood [20]. The risk or predicting factors for such protracted recovery are still unknown [21]. The failure to recover is not correlated with initial EBV load but could be connected to the efficiency of immune response to EBV infection [20]. The predicting factors for failure to recover from acute IM in children and the frequency of these cases remain to be determined as all published studies of IM in children focus on clinical presentation and laboratory findings but lack follow-up [16–18].
Here we report the results of a study of AM in peripheral blood of children and adolescents with IM, focusing on AM quantity and expression of lineage-specific surface antigens using an earlier developed anti-cluster of differentiation (anti-CD) antibody microarray. The microarray permits panning of the peripheral blood mononuclear cells (PBMCs) by their surface CD for subsequent morphology examination [22] and to determine the immunophenotype of the cells with AM morphology. The anti-CD antibody microarray was also used to determine the percentage of PBMCs positive for the main lineage-specific markers (CD3, CD4, CD8, and CD19) as well as activation markers (CD38 and HLA-DR) in children with EBV-associated IM and IM of other or unspecified etiology, using the earlier developed protocol [22, 23]. Finally, we estimated the number of IM patients failing to recover and suggested a prediction marker for protracted recovery from EBV-associated IM based on the percentage of CD8+ AM.
METHODS
Patients
The study included 110 pediatric patients (60 boys and 50 girls aged from 3 months to 16 years, median age 3 years, interquartile range [IQR] 2–7 years; mean age 5 years, standard deviation 4 years) admitted to Moscow Children’s Hospital named after Z. A. Bashlyaeva with clinical diagnosis of IM. Informed consent was obtained from the parents of all subjects. Serological screening for anti-Epstein-Barr virus capsid antigen VCA IgM, anti-VCA IgG, anti–Epstein-Barr nuclear antigen 1 (EBNA1) IgG, anti-CMV immunoglobulin M (IgM), and anti-CMV immunoglobulin G (IgG), and polymerase chain reaction (PCR) for EBV, CMV, and HHV6 viral DNA were performed to confirm the diagnosis. The patients were divided into 3 groups: (1) primary EBV infection (54 patients); (2) EBV reactivation (28 patients); and (3) not EBV-associated IM (28 patients). The primary EBV infection group included the patients positive for EBV DNA and/or anti-VCA IgM but negative for anti-EBNA1 IgG. The EBV reactivation group included those positive for anti-EBNA1 IgG and positive for EBV DNA and/or anti-VCA IgM. Patients negative for both EBV DNA and anti-VCA IgM were included into the not EBV-associated IM group. The presence or absence of active CMV and HHV6 infections were also determined by PCR tests for CMV and HHV6 DNA and an enzyme-linked immunosorbent assay (ELISA) test for anti-CMV IgM.
All patients were contacted 3 and 6 months after discharge from the hospital with questions concerning the presence of fever, pharyngitis, lymphadenitis, or any other clinical features similar to IM. If any of these symptoms were present, the patients were subject to a check-up including physical examination and a test for EBV DNA and anti-VCA IgM. The patients positive either for EBV DNA or for anti-VCA IgM that also reported having recurring fever, pharyngitis, or lymphadenitis 6 months after their discharge from the hospital were considered to have protracted recovery.
The Amplisense EBV/CMV/HHV6-screen-FL (InterLabService) reagent set was used for PCR analysis and serological tests for IgG and IgM were performed using ELISA test sets from Vector Best Europe, according to manufacturers’ instruction.
Anti-CD Antibody Microarray Fabrication
Anti-CD microarrays were made according to the previously published protocol [22]. Anti-CD microarrays contained mouse monoclonal antibodies to CD2, CD3, CD5, CD19, CD20, IgM antigens (Sorbent), and anti-CD4, CD8, CD14, CD16, CD25, CD27, CD28, CD38, CD45RA, CD64, HLA-DR, and mouse IgG1 K isotype control (eBioscience).
Cell Analysis by the Anti-CD Microarray
Blood samples were collected by venipuncture into EDTA-containing tubes. Plasma was isolated by centrifugation at 100g for 8 minutes and stored at −80°C until use. PBMCs were isolated by standard density gradient method with Histopaque 1077 (Sigma) followed by washing and incubation with the microarray at 4°C as previously described by Khvastunova et al [22] with minor modifications: isolated mononuclear cells were incubated with the microarray in 100% fetal calf serum (Sigma). The microarray-bound cells were stained after May-Grünwald-Giemsa and examined using a Nikon Eclipse Ni microscope at ×1000 and ×200 magnifications. Digital pictures were taken with a Nikon DS-Ri1 camera and analyzed in ImageJ software. The percentage of cells positive for different CD antigens was estimated as the density of cells captured by the corresponding antibody normalized by the number of cells captured by the anti-CD45 (positive control) spot on the same microarray, as earlier described [22]. The percentage of CD8+ AM was estimated as the density of cells with atypical mononuclear cell morphology binding to the anti-CD8 antibody on the microarray normalized by the density of all PBMCs binding to the positive control antibody.
Statistics
Mann-Whitney U test and receiver operating characteristic (ROC) analysis were applied to the data using Microsoft Excel and OriginPro 8 (OriginLab). The optimal cutoffs in ROC analysis were determined using the Youden index maximizing the sum of sensitivity and specificity [24].
RESULTS
Atypical Mononuclear Cells in IM Are Mostly CD8+ and Partially CD19+ But Not CD4+ Lymphocytes
To determine the lineage of AM, the PBMCs captured by antibodies against lineage-specific markers CD4, CD8, CD19, CD14, CD16, and CD64 were analyzed for the presence of cells with AM morphology in 37 patients with IM caused by primary EBV infection. Anti-CD14, anti-CD16, anti-CD64, and anti-CD4 antibodies on the microarray did not capture any AM in any of the 37 patients. In all 37 cases, most AM were CD8+ and in 32 of 37 patients a small amount of AM was also found among anti-CD19–captured cells (Figure 1A and 1B). For 10 of the 37 patients the sum of percentages of CD8+ AM and CD19+ AM from all PBMCs was found to coincide with the total percentage of CD45RA+ AM within the margin of error (Spearman rank correlation coefficient 0.96; 95% confidence interval, .86–.99; Figure 1C). These data show that AM in IM are mostly cytotoxic T cells with a fraction of B cells that rarely exceed 2% from all PBMCs but nevertheless are present in 86% of all patients. AM were also captured by anti-CD27, anti-CD38, and anti-HLA-DR antibodies on the microarray, showing that most AM are activated cytotoxic T cells.
Patients With IM Caused by Primary EBV Infections Have Higher Cytotoxic T-Cell and Lower B-Cell Percentage Than Patients With IM Caused by EBV Reactivation and Other Agents
Figure 2A shows the percentages of PBMCs positive for markers of different lymphocyte subsets for the patients with IM of different origins. Patients with IM caused by primary EBV infection had a higher percentage of CD8+ and lower percentage of CD19+ cells than the patients with IM caused both by EBV reactivation and other agents. The percentage of CD27+ cells had a higher, and of CD28+ cells a lower, median value in primary EBV infection compared to EBV reactivation and to IM caused by other viruses, although the difference did not quite reach significance (see Supplementary Tables 1 and 2). The amount of HLA-DR+ cells was higher in primary EBV than in both EBV reactivation and IM caused by other agents. Interestingly, the amount of CD38+ cells did not differ in all 3 groups and in all cases was higher than in normal controls (data not shown). No significant difference in PBMC immunophenotype was found between the EBV reactivation and not EBV-associated IM cases. The patients with primary EBV with and without active CMV or HHV6 infection did not significantly differ in their immunophenotypic characteristics (Supplementary Figure 1).
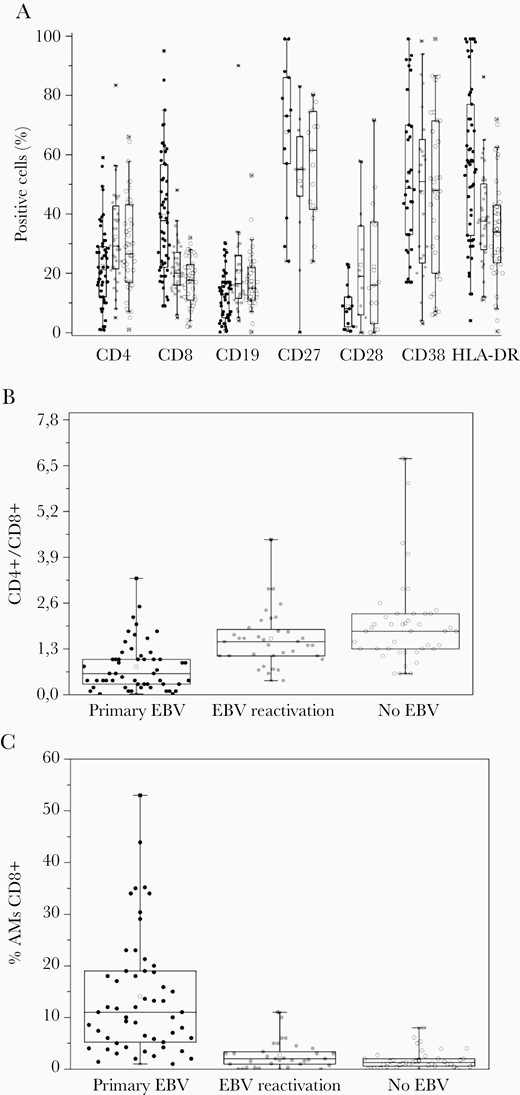
Immunological findings in patients with IM caused by primary EBV infection, EBV reactivation, and by other agents. A, The percentage of PBMCs positive for CD4+, CD8+, CD19+, CD27+, CD28+, CD38+, and HLA-DR+ in patients with IM caused by primary EBV infection, EBV reactivation, and other agents (no EBV group). B, The CD4+/CD8+ ratio in patients with IM caused by primary EBV infection, EBV reactivation, and other agents. C, The percentage of CD8+ AMs among all PBMCs in patients with IM caused by primary EBV infection, EBV reactivation, and other agents. Each circle represents a value for an individual patient. Primary EBV infection, black circles; EBV reactivation, grey circles; and other agents, open circles. Boxes represent 25–75 percentiles; bars, 1–99 percentiles; line, median value; square, mean value. Abbreviations: EBV, Epstein-Barr virus; IM, infectious mononucleosis; PBMC, peripheral blood mononuclear cell.
The CD4+/CD8+ ratio in IM caused by primary EBV infection in adults was shown to decrease starting from the onset of the IM symptoms and reaching a median of 0.3 [5]. The CD4+/CD8+ ratio in our cohort with IM caused by primary EBV infection had a median value of 0.56 with IQR 0.3–1.04 and was significantly lower than in the IM caused by EBV reactivation or by other agents (Figure 2B and Table 1). The ROC analysis showed that the CD4+/CD8+ ratio can be used for differentiation of IM caused by primary EBV infection from all the other IM cases (area under the ROC, 0.81) with the optimal cutoff of 1.1 (Table 1). The cutoff of 1.1 for the CD4+/CD8+ ratio determines the patients with IM associated with primary EBV infection with 78% sensitivity and 78% specificity.
Results of Statistical Analysis of CD4+/CD8+ Ratio for Groups of Patients With Significant Difference by Mann-Whitney Criterion
| CD4+/CD8+ | P, Mann-Whitney Criterion | AUC ROC Analysis | Optimal Cutoff, ROC Analysis |
|---|---|---|---|
| Primary EBV vs EBV reactivation | <.0001 | 0.81 | 1.1 |
| Primary EBV vs EBV reactivation and no EBV | <.0001 | 0.72 | 1.1 |
| EBV reactivation with protracted recovery vs EBV reactivation | .02 | 0.81 | 1.2 |
Abbreviations: AUC, area under the curve; EBV, Epstein-Barr virus; ROC, receiver operating characteristic.
High Atypical Mononuclear Cells Is Characteristic of IM Caused by Primary EBV Infection But Not by EBV Reactivation or Other Agents
Figure 2C shows the percentage of CD8+ AM cells from all PBMCs in patients with IM caused by primary EBV infection, EBV reactivation, and other agents. This percentage was significantly higher for IM caused by primary EBV infection (median value, 11%; IQR, 5.3%–18.8%) compared to IM associated with EBV reactivation or caused by other agents (see Table 2 for P value). The area under the ROC for differentiation of primary EBV infection-caused IM cases from other IM cases by the percentage of CD8+ AM cells from all PBMCs is 0.84. The optimal cutoff for the percentage of CD8+ AM from all PBMCs is 4.6% (Table 2). Patients with a percentage of CD8+ AM above this value can be considered to have IM caused by primary EBV with 78% sensitivity and 86% specificity. The criterion of >10% of CD8+ AM has 100% specificity but only 50% sensitivity, in good agreement with published data on IM in children [12–14]. The CD8+ AM numbers in patients with primary EBV having active HHV6 or reactivated CMV did not significantly differ from the primary EBV patients without concurrent infections (Supplementary Figure 1). No significant difference in AM numbers was found between the IM caused by EBV reactivation and by other agents.
Results of Statistical Analysis of Percentage AMs CD8+ for Groups of Patients with Significant Difference in Mann-Whitney Criterion
| % AMs CD8+ From CD45RA+ | P, Mann-Whitney Criterion | AUC ROC Analysis | Optimal Cutoff, ROC Analysis, % |
|---|---|---|---|
| Primary EBV vs EBV reactivation | <.0001 | 0.81 | 4.6 |
| Primary EBV vs EBV reactivation and no EBV | <.0001 | 0.84 | 4.6 |
| Primary EBV with protracted recovery vs primary EBV | .02 | 0.74 | 7.4 |
Abbreviations: AM, atypical mononuclear cell; AUC, area under the curve; EBV, Epstein-Barr virus; ROC, receiver operating characteristic.
For 10 patients with IM associated with primary EBV, 10 patients with IM caused by EBV reactivation, and 10 IM patients with infections other than EBV we determined the fraction of type I, II, and III Downey cells [7] among the AM in peripheral blood (Supplementary Figure 2). About 80% of AM in all cases were type II Downey cells (median values 83%, 80%, and 79%; IQRs 71%–86%, 72%–93%, and 67%–85%, respectively, for primary EBV, EBV reactivation, and not EBV groups). The median fraction of type III Downey cells in primary EBV-associated IM was 12% from all AM (IQR, 6.5%–14.5%), corresponding to 1% of total PBMCs, and significantly higher than in EBV reactivation cases (median, 1.5%; IQR, 0–4.5%, P value by Mann-Whitney criteria .009) or in IM cases caused by other agents (median, 4%; IQR, 0–14%; P value by Mann-Whitney criteria .016). The differences in fractions of types I and II Downey cells in all 3 groups did not reach significance and no differences were found in AM morphological content between the IM associated with EBV reactivation or other agents.
Patients With Protracted Recovery From IM Caused by Primary EBV Infection Have Lower Amount of CD8+ AM and Higher CD4/CD8+ Ratio Than Patients With Normal Recovery Time
Six of 54 patients with IM caused by primary EBV infection and 6 of 36 patients with IM caused by EBV reactivation were found to have a delayed recovery, that is still showing fever, pharyngitis, and lymphadenitis 6 months after symptoms onset. We compared the distribution of peripheral lymphocyte subsets, the CD4+/CD8+ ratio, and the percentage of CD8+ AM in patients with protracted recovery to patients with IM caused by the same agent that recovered within 3 months. In the patients with IM caused by EBV reactivation no significant differences were found between the patients with normal and protracted recovery. However, among the patients with IM caused by primary EBV infection the patients with protracted recovery had a significantly higher CD4+/CD8+ ratio with median value 1 compared to 0.6 for the patients with normal recovery time (Supplementary Table 3). The area under the ROC for CD4+/CD8+ used to distinguish IM associated with primary EBV infection with protracted and normal recovery was 0.81 and the optimal cutoff was found to be 1.2 (Table 1). The patients with IM caused by primary EBV infection had CD4+/CD8+ > 1.2 with 92% probability of protracted recovery; this criterion had 77% specificity but only 17% sensitivity. Among the patients with IM associated with primary EBV infection the patients with protracted recovery were also found to have a lower percentage of CD8+ AM (median, 5%; IQR, 2.5%–6%) compared to the patients that recovered within 3 months (median, 11%; IQR, 5.3%–18.8%; Supplementary Table 4). The area under the corresponding ROC was 0.74, the optimal cutoff for the CD8+ AM percentage was 7.4%, and patients with primary EBV infection caused by IM and CD8+ AM <7.4% had protracted recovery with 67% sensitivity and 67% specificity (Table 2).
Discussion
A high number of AM is highly characteristic of classic IM, associated with primary EBV infection. Although most of these cells are thought to be cytotoxic T cells, the data supporting this are mostly circumstantial. Using an anti-CD antibody microarray for panning PBMCs by their surface clusters of differentiation prior to morphology examination, we directly show that the cells with AM morphology are mostly CD8+, a small fraction of them are CD19+, while no AM are CD4+, CD14+, or CD64+. Interestingly, although the CD19+ fraction of AM in classic IM, associated with primary EBV infection, did not exceed 2% of total PBMC content, it was still present in most of the patients. The presence of CD19+ AM in IM caused by EBV reactivation or by other viruses was not tested due to the smaller total amount of AM. The question remains whether the CD8+ AM represent EBV-specific cytotoxic T cells. It seems likely as both cell populations are substantial and appear simultaneously in the course of the disease [8]. The reported CD8+CD27+HLA-DR+ immunophenotype of EBV-specific cytotoxic T cells in classic IM [25] is highly consistent with the AM immunophenotype we describe. CD19+ AM were thought in early research to represent the EBV-infected B cells [12]. In view of our results, they could represent the population of CD19+CD27+CD20− EBV-infected plasmablasts reported by Al Tabaa et al [26].
The distribution of peripheral lymphocyte subsets in adult IM patients has been extensively studied by flow cytometry [27–29]. All IM patients were found to show an increase in CD8+CD38+HLA-DR+ cells and decrease in CD19+ cells compared to normal controls. Similar changes were reported in pediatric patients [11, 30]. However, the immunophenotype of PBMCs of patients with IM caused by primary EBV infection was never compared to IM caused by EBV reactivation or other agents. We found the children with classic IM caused by primary EBV infection to have higher percentages of CD8+ and HLA-DR+ corresponding to the expansion of EBV-specific cytotoxic T cells and lower fraction of CD19+ cells compared to the patients with IM without primary EBV infection. Pálóczi et al [28] note that asymptomatic primary EBV infection causes a less significant rise in the amount of CD8+HLA-DR+ cells than the IM associated with primary EBV infection. Here we show that similar symptoms caused by EBV reactivation are not accompanied by the same rise in activated cytotoxic T cells. The optimal diagnostic cutoff for the CD4+/CD8+ ratio for classic IM in our cohort was 1.1.
The percentage of CD8+ AM cells was also higher in children with classic IM compared to the children with IM without primary EBV infection. The optimal cutoff for the percentage of CD8+ AM cells was lower than the 10% used for adults [10] and is suggested to be 4.6%. The patients with IM caused by EBV reactivation of other viruses did not differ by any of the studied parameters. Although type III Downey cells were found to be significantly more abundant in classic IM than in IM caused by EBV reactivation or by other agents, the value of this finding in differential diagnosis of IM etiology is doubtful as their median concentration was 1% of the total PBMC content while separate evaluation of Downey cell type I, II, and III numbers is time consuming.
Eleven percent of children with IM failed to recover in 6 months; this percentage is in good agreement with earlier reported data for adolescents and adults. Half of the children with delayed recovery had primary EBV infection and the other half EBV reactivation. All children with IM caused by other agents recovered normally. Among the patients with classic IM caused by primary EBV infection, the children with protracted recovery were found to have a lower percentage of CD8+ AM and higher CD4+/CD8+ ratio. This makes sense considering that the CD4+/CD8+ ratio decrease results from the appearance of EBV-specific cytotoxic T cells. If CD8+ AM are part of this population, then both features indicate a weaker immune response to primary EBV infection in patients with delayed recovery. The median percentage of CD8+ AM for the IM caused by EBV reactivation was lower for the patients with slow compare to normal recovery rate, although the difference did not reach significance.
In conclusion, all the previous studies failed to find clinical features or laboratory parameters predicting protracted recovery in IM. The percentage of CD8+ AM rather than total AM amount could be an interesting predictive factor as a measure of anti-EBV immune response in IM.
Supplementary Data
Supplementary materials are available at The Journal of Infectious Diseases online. Consisting of data provided by the authors to benefit the reader, the posted materials are not copyedited and are the sole responsibility of the authors, so questions or comments should be addressed to the corresponding author.
Notes
Financial support. O.S.F., A.E.F. and S.A.K. were supported by the Russian Ministry of Science and Higher Education (project number AAAA-A18-118012390247-0).
Potential conflicts of interest. All authors: No reported conflicts of interest. All authors have submitted the ICMJE Form for Disclosure of Potential Conflicts of Interest. Conflicts that the editors consider relevant to the content of the manuscript have been disclosed.

