


Abstract
Low mitochondrial DNA (mtDNA) copy number (CN) is a predictor of adverse aging outcomes, and its status may be altered in human immunodeficiency virus (HIV)–infected persons. This study evaluated the cross-sectional and longitudinal change of mtDNA CN by HIV markers.
mtDNA CN was measured in the ALIVE (AIDS Linked to the Intravenous Experience) cohort of persons with a history of injecting drugs. Multivariable linear regression models controlling for demographic characteristics, behavior, and hepatitis C virus (HCV) seropositivity assessed the relationship of mtDNA CN to HIV markers (CD4+ T-cell counts, viral load, antiretroviral therapy [ART] use). Linear mixed models tested the association between HIV markers and age-related mtDNA CN trajectories.
Among 741 individuals at baseline, 436 (59%) were infected with HIV. HIV-infected individuals who had lower CD4+ T-cell counts (P = .01), had higher viral loads (P < .01), and were not receiving ART (P < .01) had significantly lower mtDNA CNs than uninfected persons; there was no difference between participants who were uninfected and HIV-infected individuals who had well-controlled HIV levels. In longitudinal follow-up of 507 participants, from age 50 years onward, mtDNA CN declined significantly faster among HIV-infected individuals than among HIV-uninfected persons (−0.03 units of change/year vs 0.006 units of change/year; P = .04), even among infected individuals with well-controlled HIV.
Before 50 years of age, mtDNA CN is similar between HIV-infected individuals with well-controlled HIV and uninfected persons, but from age 50 onward, mtDNA CN declines significantly faster among all infected individuals than among HIV-uninfected persons.
Owing to the uptake of combination antiretroviral therapy (cART) for treatment of human immunodeficiency virus (HIV) infection, people living with HIV (PLWH) today have longer life expectancies than those from the early years of the HIV epidemic [1]. Yet mortality rates [2, 3] and the burden of chronic comorbidities [1, 4] among PLWH are still higher than those of demographically and behaviorally similar people without HIV (PWOH). Understanding the biological pathways precipitating such disparities remains critical to develop interventions to improve aging-related outcomes of HIV infection.
Mitochondria are susceptible to oxidative stress, and mitochondrial dysfunction is linked to multiple aging outcomes through cell apoptosis, dysregulated energy production, and inflammation pathways [5, 6]. Among PLWH, mitochondrial function might play a key role in the pathophysiology of aging and could be negatively impacted by multiple factors, including chronic inflammation [7], ART [8–11], and adverse risk behaviors [12]. Low mitochondrial DNA (mtDNA) copy number (CN) in blood is a marker of mitochondrial depletion [13], reduced energy reserves [14], and oxidative stress [15]. Previous studies have suggested that the mtDNA CN is likely altered through the aging process and is associated with aging-related comorbidity and mortality among aging adults [16–19]. Higher mtDNA CNs could increase tolerance to mtDNA depletion before mitochondrial dysfunction and clinical symptoms occur [20]. Given the technical challenges of measurement [21, 22], limited sample size, and limited application of epidemiologically comparable controls, previous studies of mtDNA CN in PLWH have shown inconsistent results [8, 23–27]. Several studies documented that mtDNA contents in blood decreased significantly among treated PLWH [8, 24], and some observed no changes [23, 26] or slight increases [27]. Moreover, there has been no prior longitudinal evaluation of the relationship of mtDNA CN in peripheral blood to HIV markers. We sought to examine the cross-sectional and longitudinal relationship of HIV infection and HIV disease severity to mtDNA CN in a population of PLWH in comparison to demographically and behaviorally similar PWOH.
METHODS
Study Design and Population
We used data and biological samples from the ALIVE (AIDS Linked to the Intravenous Experience) cohort, a long-standing community-based prospective cohort in Baltimore, Maryland, that, since 1988, has been recruiting adults who currently or previously injected drugs. The study has been approved by the Johns Hopkins University Institutional Review Board, and all participants provided written informed consent. Descriptions of study design, enrollment, and data collection have been previously reported [28]. In brief, participants were enrolled during 4 periods, in 1988–1989, 1994–1995, 1998, and 2005–2008, and attended routine semiannual visits for standardized interviews, laboratory testing and biorepository storage, and physical examinations. For the current study, we included participants who had ≥2 study visits between 15 August 2005 and 31 December 2013 and had at least 1 stored buffy coat specimen available for DNA isolation. Study baseline was identified as participants’ first visit within the time frame described above during which a buffy coat specimen was collected. The mtDNA CN was measured a second time among participants with buffy coat specimens available 5 years (±12 months) after baseline.
Determination of mtDNA CN
DNA was extracted from frozen buffy coat, using the QIAsymphony SP and the QIAsymphony DSP DNA Midi Kit (Qiagen, Valencia, CA). The process of mtDNA CN determination has been described in detail previously [17] and is demonstrated here through a flow chart (Figure 1). Briefly, mtDNA CN was measured by a multiplexed real-time quantitative polymerase chain reaction (qPCR), using ABI TaqMan chemistry (Applied Biosystems), with each assay run in triplicate. The cycle thresholds (Cts) for the mitochondrial target (ND1) and nuclear target (RPPH1) were determined, and the difference in Cts between the 2 genes (ΔCt) was calculated. Each participant’s baseline and 5-year follow-up DNA samples were tested in batches together on the same plate. Quality control was performed as follows: we removed outliers from the triplicate assays if the SD of the ΔCt was >0.5, and we removed a replicate with Ct for ND1 of >30, a Ct for RPPH1 of >5 SDs, and ΔCt of >3 SDs. To control for the plating and pipetting effect during qPCR, we used a mixed linear regression model to adjust for pipetting order and plate, whereby plate was treated as a random effect. We standardized the adjusted ΔCt within the population and used the SD (with a mean of 0) as the unit of measurement for mtDNA CN phenotype. phenotype. Because platelets do not contain nuclear DNA but do contain mtDNA and because white blood cell (WBC) counts were negatively correlated with mtDNA CNs (correlation coefficient, −0.33), we further standardized mtDNA CN phenotype by individuals’ WBC counts and platelet counts from the same visit, using linear regression. Predicted mtDNA CNs were determined after controlling for WBC and platelet counts and were used as mtDNA CNs in the primary analysis. Other covariates (demographic and risk behaviors [eg, smoking]) that could influence mtDNA CN were adjusted for in the analysis.
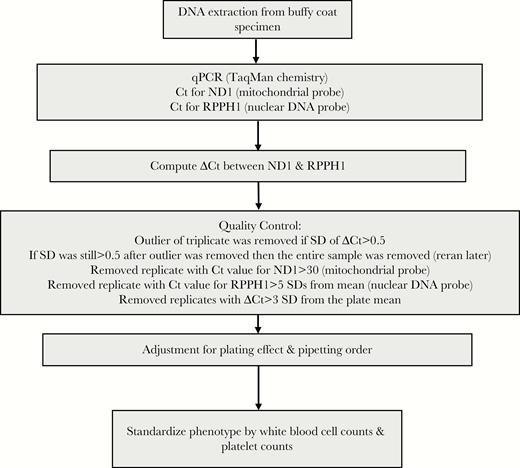
Procedures for determination of mitochondrial DNA copy number. Ct, cycle threshold; qPCR, quantitative polymerase chain reaction.
HIV Serostatus, HIV Disease Severity, and ART
HIV infection was defined by detection of HIV-1 antibodies by an enzyme-linked immunosorbent assay and confirmed by Western blot. CD4+ T-cell counts were measured using flow cytometry, and plasma HIV-1 RNA levels were determined using reverse-transcription PCR methods (Roche Amplicor HIV-1 Monitor Test; limit of detection, 50 copies/mL). Information on ART was collected through self-reported data. Participants brought all current medication to a study visit, and ALIVE clinicians confirmed the type of medications before documenting the information. Historic exposure to thymidine analogs was defined as any use of stavudine or zidovudine.
Other Covariates
Data on sociodemographic variables (age, sex, race, and education level), current cigarette smoker (time varying; yes vs no), current alcohol user (time varying; yes vs no), and current injection drug user (time varying; yes vs no) in the past 6 months were collected through interviews at each visit. Hepatitis C virus (HCV) antibodies were assessed at the first available visit.
Statistical Analysis
Statistical analyses were conducted in Stata software, version 14 (Statacorp, College Station, TX), and R, version 3.3 (R Foundation for Statistical Computing, Vienna, Austria). Baseline characteristics of participants were stratified by HIV status, and differences were evaluated through the Fisher exact test and the Wilcoxon rank sum test. Baseline differences in mtDNA CN with respect to demographic and behavioral characteristics were assessed through Wilcoxon rank sum tests.
We compared mtDNA CN with respect to HIV status and related biomarkers in the following manners: (1) HIV negative versus HIV positive, (2) HIV negative versus HIV positive and receiving cART versus HIV positive not receiving cART, (3) HIV negative versus HIV positive with a CD4+ T-cell count of >500 cell/mm3 versus HIV positive with a CD4+ T-cell count of 200–500 cell/mm3 versus HIV positive with a CD4+ T-cell counts of <200 cell/mm3, and (4) HIV-negative versus HIV positive with an HIV-1 RNA load of <50 copies/mL versus HIV-positive with an HIV-1 RNA load of ≥50 copies/mL. The association of mtDNA CN with HIV serostatus and biomarkers was assessed through unadjusted and adjusted linear regression models, controlling for age, sex, race (black vs nonblack), education level (high school or greater vs less than high school), HCV seropositivity, current cigarette smoker (yes vs no), current alcohol drinker (yes vs no), current injection drug user (yes vs no), and recruitment cohort. The covariates in the adjusted models were selected on the basis of prior hypotheses, statistical significance, and the change in the magnitude of the association between mtDNA CN and HIV infection. Box plots were used to demonstrate the original and adjusted predicted mtDNA CNs with respect to HIV serostatus and related markers.
Age-related changes in mtDNA CN were evaluated using longitudinal data, according to HIV serostatus and markers. We evaluated the rate of mtDNA CN decline (unit of SD change per year of age), using linear mixed models with random intercepts after controlling for the same set of covariates. Interactions between time and HIV serostatus and markers were assessed through the models. Because we observed differences in the rate of mtDNA CN changes over time before and after the age of 50 years during exploratory data analysis, we constructed models stratified by study visits before or after age 50 years.
RESULTS
Baseline Characteristics
We included 741 participants at baseline, of whom 507 had a second mtDNA CN measurement. Table 1 displays participant characteristics at baseline visit, by HIV status. Overall, the median age was 48 years (IQR, 43–53 years), the majority were black (86%), male (62%), current smokers (83%), and anti-HCV seropositive (88%). HIV-infected individuals were more likely to be black (P < .01), to have less than high school education (P < .01), to have not recently injected drugs (P < .01), and to be HCV seropositive (P < .01). Female participants had higher mtDNA CNs than male participants, although the difference did not reach statistical significance (P = .09). Individuals who were current alcohol drinkers (P = .01), were current injection drug users (P = .04), and were HCV seropositive (P = .02) had lower baseline mtDNA CN. Although PLWH ever exposed to thymidine analogs had lower mtDNA CNs than PWOH and PLWH who were never exposed to thymidine analogs at baseline, the difference was not statistically significant (P = .21). No other statistically significant difference in baseline mtDNA CN with respect to participants’ demographic information was observed (Table 2).
Baseline Characteristics of ALIVE Study Participants, Overall and Stratified by Human Immunodeficiency Virus (HIV) Status
| Variable | Overall (n = 741) | HIV Status | Pa | |
|---|---|---|---|---|
| Positive (n = 436) | Negative (n = 305) | |||
| Age, y, median (IQR) | 48 (43–53) | 49 (44–53) | 47 (41–53) | .15 |
| Age group, y | .94 | |||
| <50 | 439 (59.2) | 259 (59.4) | 180 (59.0) | |
| ≥50 | 302 (40.8) | 177 (40.6) | 125 (41.0) | |
| Sex | .11 | |||
| Male | 458 (61.8) | 280 (64.2) | 178 (58.4) | |
| Female | 283 (38.2) | 156 (35.8) | 127 (41.6) | |
| Race | <.01 | |||
| Nonblack | 104 (14.0) | 35 (8.0) | 69 (22.6) | |
| Black | 637 (86.0) | 401 (92.0) | 236 (77.4) | |
| Education level | .03 | |||
| High school or greater | 317 (43.0) | 166 (38.4) | 151 (49.5) | |
| Less than high school | 420 (57.0) | 266 (61.6) | 154 (50.5) | |
| Current smokerb | .20 | |||
| No | 125 (16.9) | 80 (18.4) | 45 (14.8) | |
| Yes | 615 (83.1) | 354 (81.6) | 260 (85.3) | |
| Current alcohol userb | .37 | |||
| No | 375 (50.6) | 227 (52.1) | 148 (48.5) | |
| Yes | 366 (49.4) | 209 (47.9) | 157 (51.5) | |
| Current injection drug userb | <.01 | |||
| No | 436 (58.8) | 287 (65.8) | 149 (48.9) | |
| Yes | 305 (41.2) | 149 (34.2) | 156 (51.2) | |
| Anti-HCV status | <.01 | |||
| Negative | 88 (11.9) | 28 (6.4) | 60 (19.7) | |
| Positive | 741 (88.1) | 408 (93.6) | 245 (80.3) | |
aBy the Fisher exact test (for categorical variables) and the Wilcoxon rank test (for continuous variables).
bData are self-reported behavior in last 6 months.
Abbreviations: HCV, hepatitis C virus; IQR, interquartile range.
Baseline Mitochondrial DNA (mtDNA) Copy Number (CN) Among ALIVE Participants, by Participant Characteristics
| Characteristic | Overall, No. (%) (n = 741) | mtDNA CN, Mean ± SD | Pa |
|---|---|---|---|
| Age group, y | .82 | ||
| <50 | 439 (59.2) | −0.125 ± 1.02 | |
| ≥50 | 302 (40.8) | −0.107 ± 0.95 | |
| Sex | .09 | ||
| Male | 458 (61.8) | −0.154 ± 1.00 | |
| Female | 283 (38.2) | −0.061 ± 0.98 | |
| Race | .16 | ||
| Nonblack | 105 (14.0) | −0.233 ± 0.93 | |
| Black | 637 (86.0) | −0.099 ± 1.00 | |
| Education level | .94 | ||
| Less than high school | 317 (43.0) | −0.114 ± 0.92 | |
| High school or greater | 420 (57.0) | −0.121 ± 1.05 | |
| Current smoker | .32 | ||
| No | 125 (16.9) | −0.027 ± 0.89 | |
| Yes | 614 (83.1) | −0.133 ± 1.01 | |
| Current alcohol user | .01 | ||
| No | 375 (50.6) | −0.037 ± 0.96 | |
| Yes | 366 (49.4) | −0.201 ± 1.02 | |
| Current injection drug user | .04 | ||
| No | 436 (58.8) | −0.074 ± 0.93 | |
| Yes | 305 (41.2) | −0.181 ± 1.08 | |
| Anti-HCV status | .02 | ||
| Negative | 88 (11.9) | 0.107 ± 0.88 | |
| Positive | 653 (88.1) | −0.148 ± 0.99 | |
| Exposure to thymidine analogs | .21b | ||
| HIV negative persons | 305 (41.2) | −0.008 ± 0.957 | |
| HIV-positive persons never exposed | 241 (32.5) | −0.176 ± 1.038 | |
| HIV-positive persons ever exposed | 195 (26.3) | −0.218 ± 0.9979 |
Abbreviations: HCV, hepatitis C virus; HIV, human immunodeficiency virus; IQR, interquartile range.
aBy the Wilcoxon rank sum test, unless otherwise indicated.
bBy the Kruskal-Wallis equality-of-populations rank test.
mtDNA CN and HIV Serostatus and Markers
Figure 2 and Supplementary Table 1 presents the association of mtDNA CN, by HIV status and HIV-related markers, compared with PWOH. PLWH had lower baseline mtDNA CN; this association was observed in crude and adjusted estimations. Moreover, we observed a threshold effect between markers of HIV disease severity and adjusted mtDNA CN (Figure 2 and Supplementary Table 1). PLWH with well-controlled HIV infection (ie, those who were currently receiving cART, had a CD4+ T-cell count of >500 cell/mm3, and had an HIV load of <50 copies/mL) had a similar mtDNA CN as PWOH. However, PLWH who were not receiving cART (P < .01), had CD4+ T-cell counts of ≤500 cell/mm3 (P = .01) or <200 cell/mm3 (P < .01), and had detectable viral loads (≥50 copies/mL; P < .01) had a significantly lower mtDNA CNs than PWOH. The differences between the crude (Supplementary Figure 1) and adjusted (Figure 2) estimations were driven by the demographic and behavioral differences of the groups.
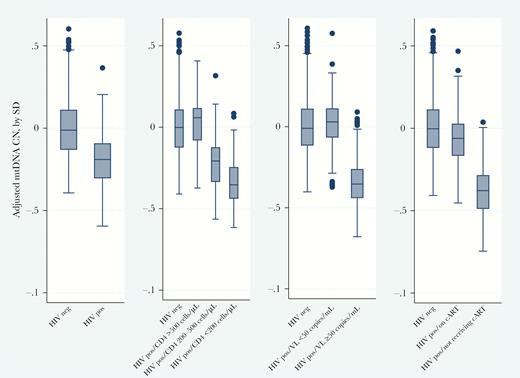
Mitochondrial DNA (mtDNA) copy number (CN), by markers of human immunodeficiency virus (HIV) disease and treatment. mtDNA CNs were adjusted for white blood cell count, platelet count, age, sex, race (black vs nonblack), education level (high school or greater, yes vs no), current cigarette smoking, current alcohol use, current injection drug use, hepatitis C virus seropositivity, and recruitment cohort. Statistics are presented in Supplementary Table 1. cART, combination antiretroviral therapy; CD4, CD4+ T-cell count; neg, negative; pos, positive.
Change in mtDNA CN Over Time and HIV Markers
When combining participants of all ages, we did not observe a significant age-related decline in mtDNA CN in the longitudinal analysis (Supplementary Table 3). However, in stratified analysis among individuals ≥50 years of age, we observed a significant age-related decline in mtDNA CN (P = .04) among PLWH, even among those with well-controlled HIV (Figure 3 and Supplementary Table 2). The interaction between HIV infection and time was also significant (Pinteraction = .04), suggesting that the rate of mtDNA CN decline over time was significantly different when comparing older PLWH to older PWOH. Furthermore, the rate of decline in mtDNA CN demonstrated a dose response to HIV disease severity, with a lower CD4+ T-cell count, a higher viral load, and a lack of cART associated with a greater magnitude of decline, compared with PLWH who had well-controlled HIV (Figure 3 and Supplementary Table 2). Among participants aged <50 years (Supplementary Table 2), no linear trend of decline in mtDNA CN was observed. However, the difference in mtDNA CN among PLWH who were not receiving cART or had higher viral loads increased over time when compared to that among PWOH (interactions between time and the HIV marker groups were statistical significant), which indicates a potential further decline in mtDNA CN with increasing age.
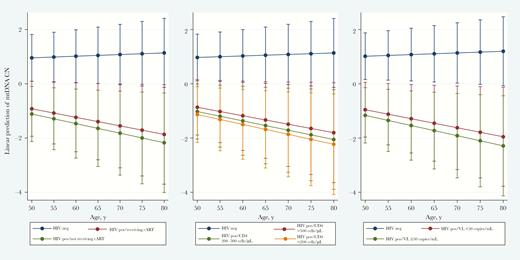
Longitudinal change in predicted mitochondrial DNA (mtDNA) copy number (CN) decline, by markers of human immunodeficiency virus (HIV) disease and treatment, among ALIVE participants ≥50 years old. mtDNA CNs were standardized by white blood cell counts and platelet counts. The model was adjusted for time-varying HIV status, sex, race (black vs nonblack), education level (high school or greater vs less than high school), current cigarette smoking (yes vs no), current injection drug use (yes vs no), current alcohol use (yes vs no), hepatitis C virus seropositivity, and recruitment cohort. Statistics are presented in Supplementary Table 2. cART, combination antiretroviral therapy; CD4, CD4+ T-cell count; neg, negative; pos, positive.
DISCUSSION
In the current study, we found that PLWH who had well-controlled HIV and were receiving cART had similar mtDNA CNs in their blood at baseline, compared with PWOH, while those with poorly controlled HIV showed a significant decrease in mtDNA CNs from baseline. Although there was no baseline difference in mtDNA CN between PLWH who had well-controlled HIV and PWOH, we observed a significant age-related decline in mtDNA CN among all PLWH (including those with well-controlled HIV) after the age of 50 years, while we observed no decline among PWOH after the age of 50 years. Additionally, the rate of decline in mtDNA CN among PLWH demonstrates a dose response to major HIV biomarkers (CD4+ T-cell count and HIV load) in which the rate of mtDNA CN decline among people with poorly controlled HIV is steeper than that among those with well-controlled HIV. Our results agree with previous studies that have demonstrated lower levels of mtDNA content in PLWH [8, 23–25] as compared to PWOH. They are also consistent with Miura et al’s observation [27] that mtDNA CNs correlate with CD4+ T-cell counts and inversely correlate with viral load. Of even greater significance, our study demonstrates the different trajectories of mtDNA CN among PLWH with different disease severities.
mtDNA CN reflects a loss of mitochondrial DNA integrity and has been used as a biomarker of mitochondrial dysfunction [29]. Lower mtDNA CNs in peripheral blood are associated with a higher risk of multiple age-related comorbidities, including chronic kidney disease [30], cardiovascular disease [31, 32], and Parkinson disease [33], as well as mortality [17], in the general population. As a reflection of our appreciation that the number of PLWH aged >50 years worldwide is expected to triple by 2040, owing to expanded cART coverage [1], the current study addresses the importance of studying mitochondrial content and mitochondrial function to decrease the burden of aging-related diseases in this population.
Mitochondrial damage from ART has long been a concern for otherwise healthy aging PLWH [34], but previous studies have not consistently demonstrated whether such damage might be reflected in the mtDNA CN in blood [8, 26, 27, 35]. Cote et al [8] observed an immediate decline in mtDNA CN associated with ART initiation. In Morse et al’s study [26], the authors observed no difference in mtDNA CN in peripheral blood mononuclear cells among all groups (ie, HIV-negative persons, HIV-positive persons, HIV-positive persons receiving ART, and HIV-positive persons not receiving ART). Both studies had a relatively small sample size (n < 70), and neither controlled for confounding factors such as age or sex or for the underlying cell composition in their comparison groups. In contrast to their findings, we observed that individuals who were not receiving cART had lower mtDNA CNs than those who were receiving cART. Furthermore, over time, mtDNA CNs declined faster among older individuals who were not receiving cART than among those who were receiving cART (slope, −0.035 SD/year vs −0.031 SD/year). We argue that accounting for the cell composition, especially platelet counts and WBC counts, is important when studying the mtDNA CN in blood in people infected with HIV. HIV infection could significantly reduce WBC counts and platelet counts (Supplementary Table 5). Thus, the mtDNA CN could be overestimated, owing to a reduced WBC count (because the WBC count is inversely correlated with the mtDNA CN), or underestimated, owing to decreased platelet counts (because platelets contain mtDNA but no nuclear DNA). The association between HIV and mtDNA CN, with and without control for WBC and/or platelet counts, are further demonstrated in Supplementary Table 4. The changes of the effect size and direction suggest that WBC and platelet counts are 2 important confounding factors in the associations. Without controlling for these 2 components, it is hard to conclude that previous observations [8, 23] of a lower mtDNA CN among treated PLWH than among untreated PLWH represented an actual result of damage from ART toxicity or a change of cell composition due to immune recovery. Although several studies using peripheral blood mononuclear cell samples [26, 36] account for platelet contamination (so the results were not likely to be impacted by platelet counts), their results might still be impacted by WBC counts. This impact might be even more significant when using the ratio of mtDNA to nuclear DNA as a measurement of mtDNA content.
Early nucleoside reverse transcriptase inhibitors (NRTIs), such as thymidine analogs, had known mitochondrial toxicity [37]. However, whether or not the residual effect from exposure to early generation of NRTIs affect mtDNA CN later in life remains unclear. In the current study, we did not observe a significant decrease in mtDNA CN among individuals ever exposed to thymidine analogs among both all participants and a subgroup of people with well-controlled HIV (data not shown). Our observations might suggest that, among PLWH receiving cART, the difference in the mtDNA CN caused by the residual effects of thymidine analogs might be attenuated, while chronic infection and HIV disease severity are the primary contributors that lead to the continued decline of mtDNA CN in PLWH.
Other than the effect of ART, HIV infection itself may impair mitochondrial function and lead to alterations in the mtDNA CN through chronic inflammation. A recent publication by Wu et al showed that a low mtDNA CN was associated with elevated high-sensitivity C-reactive protein, interleukin 6, and fibrinogen levels and WBC counts in the general population [38]. On the other hand, recent studies have also observed that HIV infection and inflammation markers (eg, interleukin 6) were associated with cell-free mtDNA [7, 39]. Cell-free mtDNA released from damaged or dead cells could then bind to Toll-like receptor 9, triggering a proinflammatory response [40]. The interaction between inflammation markers, mtDNA CN, and cell-free mtDNA should be further explored in a longitudinal study with a large sample size to reveal the causal pathways. In addition, multiple chronic conditions (eg, chronic kidney disease [30] and cardiovascular disease [31]) are known to be associated with a low mtDNA CN in blood, while PLWH have elevated risk of chronic kidney disease [41] and cardiovascular disease [42] events. These HIV-related comorbidities could also be a major driver of the changes in mtDNA CN during older age. Further exploration of these relationships could provide insights useful to the development of targeted therapies to promote healthy aging among PLWH.
The current study is limited by the following factors. First, the majority of our participants were of African American descent and all had a history of injected drug use. Therefore, despite efforts to control for multiple factors, unmeasured confounders could still exist and could bias our results. Second, all ART information was obtained by self-report, and missing values could have limited our ability to precisely estimate the impact of exposure to thymidine analogs and cART. Third, we did not assess mtDNA CN in tissue specimens other than blood. Thus, our observations might not apply to alterations in the mtDNA CN in other tissues (eg, adipose tissue and muscle). Fourth, we were only able to obtain longitudinal samples from 507 of 741 participants, owing to losses to follow-up and sample availability. Those who did not contribute follow-up data might have been sicker and thus unable to meet the physical demands of a study visit. Last, our longitudinal data were also limited by the requirement of 2 visits per participant within a 5-year period. Thus, we might underestimate the magnitude of the effect of HIV infection on outcomes when participants were much older. Follow-up studies with longer intervals and more follow-up visits should be considered.
Our study also has certain strengths. This is the first study using epidemiologically comparable HIV-infected and uninfected participants with long-term repeated measurements of data to evaluate the association between HIV infection and long-term trajectories of mtDNA CN in blood. Benefiting from the ALIVE infrastructure, we were able to control for cell composition, demographic characteristics, and risk behavior in our comparison. In addition, most studies evaluating the effect of ART on mtDNA CN have focused on early ART regimens, and our study provides an update by examining the effect of the current treatment regimen on mtDNA CN in an aging cohort. Finally, few studies on HIV infection and mitochondrial function have been conducted in populations of people who injected drugs, predominately of African American descent and low socioeconomic status. Our study fills this gap in the literature and provides a comprehensive profile of this vulnerable group.
In summary, mtDNA CN in peripheral blood is a sensitive and readily available biomarker reflecting mitochondrial function in humans. It was observed to be strongly associated with HIV disease markers in our study. In addition, the age-related decline of mtDNA CNs among PLWH might be intensified over time, and it could occur among individuals with well-controlled infection due to current receipt of cART. Since mtDNA CN is closely linked to multiple aging-related comorbidities, further investigation into the relationship between chronic HIV infection and mtDNA CN might be increasingly important in the study of aging among PLWH.
Supplementary Data
Supplementary materials are available at The Journal of Infectious Diseases online. Consisting of data provided by the authors to benefit the reader, the posted materials are not copyedited and are the sole responsibility of the authors, so questions or comments should be addressed to the corresponding author.
Presented in part: Conference on Retroviruses and Opportunistic Infections, Boston, Massachusetts, 4–7 March 2018. Abstract 890.
Notes
Acknowledgments. We thank the ALIVE study participants and ALIVE study staff, for their significant contributions to this work; the National Center for Research Resources and the National Center for Advancing Translational Sciences of the National Institutes of Health, for support for statistical consulting; and the technicians from the Johns Hopkins Biological Repository and Arking Laboratory, for laboratory support.
Financial support. This work was supported by the National Institutes of Health (NIH; grants U01-DA-036297, R01-DA-12568, K24-AI120834, K24-AI118591, R01-HL131573, and 1P30AI094189) and by the National Center for Research Resources and the National Center for Advancing Translational Sciences, NIH (grant 1UL1TR001079).
Potential conflicts of interest. All authors: No reported conflicts of interest. All authors have submitted the ICMJE Form for Disclosure of Potential Conflicts of Interest. Conflicts that the editors consider relevant to the content of the manuscript have been disclosed.

