


Abstract
Pulmonary function impairments are more common among people living with HIV (PLWH), as are contributing risk behaviors. To understand the effects of human immunodeficiency virus (HIV) infection independent of risk behaviors, pulmonary function was evaluated in lifestyle-comparable HIV-infected and -uninfected AGEhIV cohort participants.
Prevalence of obstructive lung disease in 544 HIV-infected and 529 HIV-uninfected participants was determined using spirometry. Logistic regression was used to assess HIV as a determinant of obstructive lung disease. Additional explanatory models were constructed to explain observed differences.
The unadjusted obstructive lung disease prevalence was similar in HIV-infected (23.0%) and -uninfected (23.4%) participants. Multivariable logistic regression analysis showed an effect modification whereby obstructive lung disease prevalence among persons with limited smoking experience was notably lower among HIV-infected compared with HIV-uninfected participants. This resulted from a lower forced vital capacity (FVC) in HIV-infected participants but similar 1-second forced expiratory volume (FEV1), especially in those with limited smoking experience.
The lower FVC in HIV-infected participants could indicate HIV-related restrictive or fibrotic pulmonary changes. Factors that decrease the FVC could obscure emphysematous changes in the lungs of PLWH when using the FEV1/FVC ratio as single diagnostic measure.
NCT01466582.
As a result of effective combination antiretroviral therapy (cART), people living with human immunodeficiency virus (PLWH) are notably aging and consequently prone to develop age-related comorbidities. Chronic obstructive pulmonary disease (COPD), similar to other age-related comorbidities, is reported to occur earlier and more frequently in PLWH compared to the general population [1–4]. In the developed world, including the Netherlands, human immunodeficiency virus (HIV) infection occurs predominantly among identifiable key populations, such as men who have sex with men (MSM) [5]. These key populations often exhibit a lifestyle that is associated with greater exposure to environmental and behavioral risk factors such as active and passive smoking and illicit drug use [6–8]. Thus, lifestyle-comparable control groups are essential when evaluating incidence, prevalence, and HIV-related causes of morbidity in PLWH. This is especially relevant for conditions highly correlated with risk behaviors, as is the case with COPD development and smoking exposure.
The aim of this study was to evaluate the prevalence of obstructive lung disease in a group of middle-aged, mostly virologically suppressed, PLWH compared to an appropriately selected HIV-uninfected control group with similar lifestyles.
METHODS
Study Participants and Procedure
The AGEhIV Cohort Study is an ongoing prospective cohort study evaluating the occurrence of age-related comorbidities in 598 HIV type 1–infected participants compared with 550 HIV-uninfected participants. HIV-infected participants were recruited from the HIV outpatient clinic of the Amsterdam University Medical Centers (location AMC), Amsterdam. HIV-uninfected participants were recruited from the sexual health clinic at the Amsterdam Public Health Service and from the Amsterdam Cohort Studies on HIV/AIDS [9]. The recruitment method of the control group allowed for inclusion of a majority of MSM, comparable to the index group in geographic and sociodemographic background, and at risk for HIV infection. The inclusion criteria were being at least 45 years of age, and controls had a documented negative HIV antibody test at inclusion. Study enrollment was conducted between 2010 and 2012. Biennially, participants undergo a standardized screening program to diagnose age-related comorbidities, which includes an extensive questionnaire, multiple biometric measurements, and laboratory testing. More details about the study protocol have previously been published [10]. Detailed information on recent and historical HIV characteristics prior to study entry was obtained from the Dutch HIV Monitoring Foundation registry. Written informed consent was obtained from all participants, and the study was approved by the ethical review board of the Amsterdam University Medical Centers and registered at ClinicalTrials.gov (identifier NCT01466582).
Information on demographics and risk behavior was obtained via questionnaires, including a detailed history of current and past smoking behavior. At each study visit, a spirometry measurement without bronchodilation was performed by trained nurses according to European Respiratory Society/American Thoracic Society (ATS) criteria [11] using a SpiroUSB (Carefusion) spirometer. Forced expiratory volume in 1 second (FEV1) and forced vital capacity (FVC) were determined in a minimum of 3 up to a maximum of 6 efforts. Afterward, an (unforced) expiratory vital capacity (EVC) was measured in 3–6 separate efforts.
Data Quality
Highest FEV1 and FVC values were selected only from ATS qualifying efforts, of which there needed to be at least 1. If the spirometry measurement did not meet quality control criteria, indices from a follow-up visit were used when available (n = 56, Supplementary Figure 1). Missing covariate data were supplemented with data from follow-up visits (maximum of 42 cases per variable) or imputed using a mean or median value of the overall cohort (maximum of 35 cases per variable). Participants without any data on smoking behavior were excluded from the analysis (n = 48).
Definitions
The threshold for obstructive lung disease was set at an FEV1/FVC ratio <70%, following the Global Initiative for Chronic Obstructive Lung Disease (GOLD) criteria [12] to allow for comparability with previous studies. An alternative threshold for obstructive lung disease was set at a z score of the FEV1/FVC ratio <–1.64 (ie, lower limit of normal) using the Global Lung Initiative’s (GLI) spirometry reference calculations and criteria [13]. These reference calculations were also used to calculate the percentage of the per-individual predicted FEV1 and FVC values, based on participants’ sex, age, height, and ethnicity. Severity of airway obstruction (FEV1/FVC <70%) was classified using the GOLD guidelines into GOLD 1 through 4, FEV1 % predicted being ≥80%, <80%, <50%, and <30%, respectively. Cumulative smoking pack-years was defined as the product of the duration of smoking career in years and the average number of cigarettes smoked daily (20 cigarettes = 1 pack).
Laboratory Measurements
Levels of a panel of inflammatory markers were determined centrally at the Amsterdam UMC (location AMC) research laboratories; high-sensitivity C-reactive protein and D-dimer were determined in fresh plasma samples using immunoturbidimetry. Interleukin 6 (IL-6), soluble CD14, and soluble CD163 were determined by enzyme-linked immunosorbent assay using stored plasma samples from the baseline visit [14]. Regular HIV treatment–related laboratory markers (eg, lymphocyte phenotyping) were determined directly in samples collected during the study visits or, only with HIV-infected participants, <3 months prior to the study visits during routine clinic visits.
Statistical Analysis
Statistical analyses were performed using Stata software version 12 (StataCorp, College Station, Texas). All tests were 2-sided and P < .05 was considered statistically significant. Baseline characteristics were compared using Student t tests, χ2 tests, Mann-Whitney U tests, or nonparametric tests for trend, where appropriate. Multivariable logistic regression was used to evaluate the association between obstructive lung disease and HIV, while adjusting for confounding factors. Possible confounding variables were selected via univariable logistic regression analyses. Variables associated with obstructive lung disease at P < .2 in univariable analyses and considered a biologically plausible confounder were included in the multivariable models. In case continuous covariates were associated with obstructive lung disease, this association was evaluated for linearity by categorizing the variable into quintiles and evaluating the association with obstructive lung disease per quintile. When the association was determined to be nonlinear, these variables were appropriately transformed, categorized, or dichotomized. A manual stepwise backwards variable selection process was used to generate the most parsimonious multivariable models. All biologically plausible interaction effects were evaluated. To clarify the results of the primary analysis, exploratory analyses were performed using the FEV1, FVC, and EVC spirometry indices as separate continuous outcome variables in multiple linear regression models, to evaluate their associations with HIV infection, and also their relation to smoking history. Where possible, these indices were transformed to z scores using the GLI reference calculations to reduce the number of confounding variables in the models and to allow for a comparison with the general population. Associations between the spirometry indices and historical HIV characteristics and chronic inflammation markers were also explored.
Sensitivity Analyses
To verify the robustness of our results, several sensitivity analyses were performed. These included an analysis of spirometry measurements restricted to those with at least 3 ATS qualifying efforts (72% of spirometry measurements), and also analyses using the lower limit of normal (z score <–1.64) of the FEV1/FVC ratio and the GOLD class 2 (FEV1/FVC <70% and FEV1 <80% predicted) as alternative outcome measures.
RESULTS
Characteristics of Study Participants
Spirometry measurements from 544 HIV-infected and 529 HIV-uninfected controls were available for analysis, representing 91% and 95% of the AGEhIV participants in the 2 study arms, respectively (Supplementary Figure 1). HIV-infected participants were more often male (89% vs 85%), MSM (77% vs 70%), of nonwhite ethnicity (12% vs 6%), and unfit for work (23% vs 7%), and had a significantly lower average body mass index (BMI; 24.6 vs 25.2 kg/m2) (Table 1). HIV-uninfected participants more often had a higher educational level (56% vs 42%) and were more frequently employed or self-employed (71% vs 53%). Smoking behavior also significantly differed between groups, with HIV-infected participants more often being current smokers (34% vs 25%), having on average more pack-years (18 vs 15), and had more recently quit smoking when cessation was achieved (10 vs 14 years since cessation). HIV-infected participants, however, had lower levels of alcohol use, being less often a daily drinker (32% vs 37%), a heavy daily drinker (4% vs 7%), or a binge drinker (21% vs 31%). Other recreational drug use only differed regarding former injection drug use (4% HIV infected vs 1% HIV uninfected) and less daily to monthly MDMA (3,4-methylenedioxymethamphetamine) use (4% HIV infected vs 9% HIV uninfected). HIV-infected participants also had less sexual risk behavior with a lower median number of partners in their lifetime (53 vs 100) and in the 6 months before study enrollment (1 vs 3).
Characteristics of AGEhIV Study Participants by HIV Status
| Characteristic | HIV Infected (n = 544) | HIV Uninfected (n = 529) | P Value | ||
|---|---|---|---|---|---|
| Age, y, median (IQR) | 53 | (48–59) | 52 | (48–58) | .2a |
| Male sex at birth | 486 | (89) | 447 | (85) | .019b |
| MSM | 411 | (77) | 366 | (70) | .008b |
| Nonwhite ethnicity | 64 | (12) | 30 | (6) | < .001b |
| Height, cm, mean (SD) | 178 | (9.4) | 178 | (9.2) | .3c |
| BMI, kg/m2, mean, (SD) | 24.6 | (3.5) | 25.2 | (3.6) | .006c |
| High educational leveld | 214 | (42) | 286 | (56) | < .001b |
| Employed or self-employed | 273 | (53) | 370 | (71) | < .001b |
| Wholly or partly unfit for work | 120 | (23) | 36 | (7) | < .001b |
| Smoking status | |||||
| Never | 172 | (32) | 192 | (37) | .008e |
| Former | 186 | (34) | 202 | (38) | |
| Current | 186 | (34) | 135 | (25) | |
| No. of pack-yearsf, median (IQR) | 18 | (8–35) | 15 | (5–28) | < .001a |
| Years since cessationg, median (IQR) | 10 | (4–20) | 14 | (6–27) | .004a |
| Former injection drug use | 24 | (4) | 6 | (1) | .001b |
| Alcohol consumption in last 6 mo | |||||
| Daily or nearly daily ≥1 IU | 172 | (32) | 198 | (37) | .05b |
| Heavy daily drinkingh | 23 | (4) | 36 | (7) | .06b |
| Binge drinkingi | 107 | (21) | 159 | (31) | < .001b |
| Use of recreational drugs during last 6 mo | 152 | (29) | 140 | (27) | .5b |
| Daily, weekly, or monthly use of: | |||||
| Marijuana | 52 | (10) | 39 | (7) | .2b |
| MDMA | 22 | (4) | 45 | (9) | .003b |
| Cocaine | 19 | (4) | 13 | (2) | .3b |
| Poppers | 48 | (9) | 34 | (7) | .1b |
| Daily marijuana use | 16 | (3) | 12 | (2) | .5b |
| No. of sexual partners in 6 mo preceding study visit, median (IQR) | 1 | (0–4) | 3 | (1–10) | < .001a |
| Estimated No. of lifetime sexual partners, median (IQR) | 53 | (15–250) | 100 | (25–500) | < .001a |
| Use of inhaler 24 h prior to spirometry | 12 | (2) | 14 | (3) | .6b |
| Self-reported history of obstructive pulmonary disease | 86 | (16) | 61 | (12) | .03b |
| Years since diagnosis of HIV-1 infection, median (IQR) | 12.1 | (6.3–7.1) | … | … | … |
| Mean CD4+ cell count over the 12 mo prior to enrollment, cells/µL, median (IQR) | 565 | (434–742) | … | … | … |
| CD4+ nadir cell count, cells/µL, median (IQR) | 180 | (73–260) | … | … | … |
| Receiving cART at time of enrollment | 521 | (95.8) | … | … | … |
| Viral load <200 copies/mL in the year prior to enrollment | 498 | (92.1) | … | … | … |
| Duration of suppressed viremia (<200 copies/mL), y, median (IQR) | 9.2 | (4.0–12.8) | … | … | … |
| Prior CDC class C AIDS-defining illness | 166 | (30.5) | … | … | … |
| Prior pulmonary CDC class C AIDS-defining illnessj | 70 | (12.8) | … | … | … |
| Prior nonpulmonary CDC class C AIDS-defining illness | 129 | (24) | … | … | … |
| Prior PCP | 51 | (9.4) | … | … | … |
| Prior bacterial pneumonia | 54 | (10) | … | … | … |
| Prior pulmonary tuberculosis | 9 | (1.7) | … | … | … |
All values are No. (%) unless otherwise stated. Participants with missing or invalid spirometry measurements (n = 27) or data on smoking behavior (n = 48) were excluded. Values in bold indicate a P value <0.05.
Abbreviations: BMI, body mass index; cART, combination antiretroviral therapy; CDC, Centers for Disease Control and Prevention; IDU, injection drug use; IQR, interquartile range; MDMA, 3,4-methylenedioxymethamphetamine; MSM, men having sex with men; PCP, Pneumocystis jirovecii pneumonia; SD, standard deviation.
aWilcoxon rank-sum test.
bχ2 test.
cTwo-sample t test.
dHaving completed an education at higher vocational level or university level.
eNonparametric test for trend.
fOne pack-year = 20 cigarettes/day during 1 year, former/current smokers only.
gNumber of years since having stopped smoking, former smokers only.
hNear daily: >4 IU (females) or >5 IU (males) of alcohol.
iMore than 6 IU/day at least once per month in last 6 months.
jAny pulmonary mycobacterial infections, PCP, recurrent bacterial pneumonia, or candidiasis in trachea, bronchi, or lungs.
The majority of HIV-infected participants (95.8%) were on cART at the time of the spirometry measurement, with 92.1% being virologically suppressed and having high CD4 counts (median 565 cells/µL). The HIV-infected participants were known to be HIV infected for a median of 12 years, with a median CD4 count nadir of 180 cells/µL, 31% having previously been diagnosed with a Centers for Disease Control and Prevention category C AIDS-defining illness and 9% with a history of Pneumocystis jirovecii pneumonia (PCP); prior pulmonary tuberculosis was rare (1.7%).
Prevalence of Obstructive Lung Disease
Using GOLD criteria, prevalence of obstructive lung disease was 23.0% in the HIV-infected group and 23.4% in the HIV-uninfected group (Figure 1). Using GLI criteria, prevalence was 14.0% and 15.6%, respectively. Neither difference was statistically significant (P = .9 and P = .5, respectively). Subdivision based on disease severity using the GOLD disease severity classifications [12] also failed to show a significant difference (P = .9 for nonparametric test for trend; Figure 1). There was, however, a trend toward more GOLD class 2 or greater spirometry patterns in the HIV-infected group (P = .09, χ2 test).
![Prevalence of obstructive lung disease by human immunodeficiency virus (HIV) status. Obstructive lung disease was defined as 1-second forced expiratory volume (FEV1)/ forced vital capacity (FVC) ratio <70% (Global Initiative for Chronic Obstructive Lung Disease [GOLD] criteria) and FEV1/FVC ratio z score <–1.64 (Global Lung Initiative [GLI] criteria). GOLD disease severity criteria: FEV1/FVC <70% and FEV1 ≥80% (GOLD 1), FEV1 <80% (GOLD 2), FEV1 <50% (GOLD 3), or FEV1 <30% (GOLD 4). aP value of nonparametric test for trend. bP value of χ2 test.](https://oup.silverchair-cdn.com/oup/backfile/Content_public/Journal/jid/219/8/10.1093_infdis_jiy653/2/m_jiy65301.jpeg?Expires=1750387179&Signature=omDnDBTJcrAyQ2Dz5rQmhaAGMJTayy~NGA7b8n-b3pbqUJtqKEVBadlx~PgAQeuhtmZ1roZYU7sec7vYPTrileWb6vnYcreO7uduutpQI0UGdsQWxf1tHOM59nDoKtedWIVF2eg08znWFoW-tGqyu6pL~RNgT3vBqX5NNSJSDk2zQRsw9c4SRZNeJlA6Beq2bPh23x4GgN4sikzu9Z9BQ2UqV8-PU8D7b6wZzxdNnAZgeOh1yETJDa~kBQKWLoHGqOPq5bFCvnGJu0NosmfNVtyZmqqn8ugoz7E8jbnnlrMSW5uswtGeZFQ86lPtXuGNzmQiG6lxXyMKDSqBAtDfow__&Key-Pair-Id=APKAIE5G5CRDK6RD3PGA)
Prevalence of obstructive lung disease by human immunodeficiency virus (HIV) status. Obstructive lung disease was defined as 1-second forced expiratory volume (FEV1)/ forced vital capacity (FVC) ratio <70% (Global Initiative for Chronic Obstructive Lung Disease [GOLD] criteria) and FEV1/FVC ratio z score <–1.64 (Global Lung Initiative [GLI] criteria). GOLD disease severity criteria: FEV1/FVC <70% and FEV1 ≥80% (GOLD 1), FEV1 <80% (GOLD 2), FEV1 <50% (GOLD 3), or FEV1 <30% (GOLD 4). aP value of nonparametric test for trend. bP value of χ2 test.
Adjustment for Potential Confounders
Table 2 shows multivariable models including adjustment for demographic and behavioral factors in the probability of having obstructive lung disease (FEV1/FVC <70%). HIV status and number of pack-years strongly interacted with each other (P < .001): for those reporting zero pack-years, HIV was significantly associated with a lower probability of obstructive lung disease (odds ratio, 0.35; 95% confidence interval [CI], .21–.58; P < .001). This negative association between HIV and obstructive lung disease diminished with an increasing number of pack-years, and was (nonsignificantly) reversed from around 25 pack-years (Figure 2; Pinteraction = .006). Age, height, and BMI were significantly associated with obstructive lung disease, but did not modify the effect of HIV (Table 2, model 2). The interaction term of smoking cessation years with pack-years was significant and showed an attenuation of the smoking effect when having quit smoking for longer periods. Sensitivity analyses using the obstructive lung disease definition by GLI or using a GOLD ≥2 definition as outcome measures yielded similar results (data not shown). Also in an analysis restricted to participants with at least 3 ATS qualifying efforts, the lower probability of obstructive lung disease in those HIV-infected participants with limited smoking experience remained significant.
Multivariable Logistic Regression Models Evaluating Factors Independently Associated With Obstructive Lung Disease, With (Model 2) and Without (Model 1) Adjustment for Smoking and Recreational Drug Use
| Factor | Model 1 | Model 2 | ||||
|---|---|---|---|---|---|---|
| OR | (95% CI) | P Value | OR | (95% CI) | P Value | |
| HIV infection | 0.88 | (.65–1.18) | .4 | 0.35 | (.21–.58) | < .001 |
| Interaction: HIV infection × a | ... | ... | ... | 1.23 | (1.09–1.38) | < .001 |
| Demographics | ||||||
| Age per 10-y increase | 1.92 | (1.58–2.34) | < .001 | 2.08 | (1.67–2.59) | < .001 |
| Height >170 cm (dichotomized)a | 2.32 | (1.49–3.62) | < .001 | 2.26 | (1.43–3.60) | .001 |
| BMI <23 kg/m2 (dichotomized)a | 1.86 | (1.36–2.52) | < .001 | 1.72 | (1.24–2.38) | .001 |
| Smoking and recreational drug use | ||||||
| Pack-years per increasea | ... | ... | ... | 1.13 | (1.04–1.23) | .006 |
| Smoking cessation years per 10 y | ... | ... | ... | 1.10 | (.88–1.37) | .4 |
| Interaction: smoking cessation years × a | ... | ... | ... | 0.91 | (.85–.98) | .009 |
| Daily marijuana use | ... | ... | ... | 2.06 | (.92–4.64) | .08 |
| Former IV drug use | ... | ... | ... | 1.87 | (.84–4.19) | .1 |
Model 1 includes the variables HIV status, age, height, and BMI. Model 2 includes all variables and interaction terms listed in the table. Values in bold indicate P value <0.05.
Abbreviations: BMI, body mass index; CI, confidence interval; HIV, human immunodeficiency virus; IV, intravenous.
aVariables were transformed or categorized appropriately to fit the linearity assumption of the logistic regression model. Variables that were excluded from the model in the backward selection process were ethnicity, sexual orientation, employment status, smoking status, and daily and heavy daily alcohol use. Diagnostics model 2: Likelihood ratio test: χ2 = 149 (P < .001). Hosmer–Lemeshow χ2 test: 5.02 (P = .76). Maximal leverage 0.15. Maximal Pregibon dbeta 0.19.
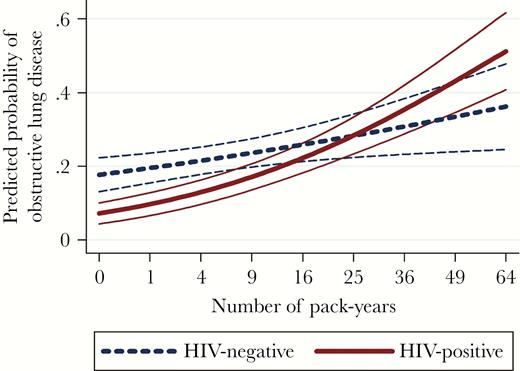
Predicted probability with 95% confidence interval of obstructive lung disease by number of pack-years smoking, stratified by human immunodeficiency virus (HIV) status. Predicted probability was calculated using model 2 in Table 2. Other covariates in the multivariable model were kept constant at their mean values in the overall study population. Number of pack-years was back-calculated from the transformed .
Lower Vital Capacity in HIV-Infected Participants
Table 3 shows a 2 times higher prevalence of obstructive lung disease (21% vs 9%; P = .001) in the never-smoking HIV-uninfected participants compared with HIV-infected never-smoking participants, and a 5 times higher prevalence of obstructive lung disease (15% vs 3%, P < .001) when using GLI criteria. Within this subgroup, FVC and EVC were significantly lower in the HIV-infected participants (P = .02 and P <.001, respectively), whereas FEV1 was not significantly different. The percentage of the predicted FVC was also not significantly lower in the HIV-infected never-smoking subgroup compared with the never-smoking HIV-uninfected subgroup. Figure 3 shows the predicted z scores of FEV1, FVC, the FEV1/FVC ratio, and the absolute EVC by HIV status and pack-years of smoking, using multivariable linear regression to adjust for confounding variables. FEV1z score levels and their declines with increasing pack-years were similar in HIV-infected and -uninfected participants. The interaction effect of pack-years smoking with HIV on the FEV1/FVC ratio z score appeared therefore primarily driven by differences in FVC. The HIV-infected participants had an on average lower FVC z score at 0 pack-years (–0.169; 95% CI, –.321 to –.018; P = .028), which remained relatively unaffected by an increasing numbers of pack-years smoking, in contrast to the decline in FVC observed with increasing numbers of pack-years in the HIV-uninfected participants. The interaction term “HIV × pack-years” was, however, nonsignificant (0.005; 95% CI, –.001 to .11; P .14). Similarly the EVC, which also measures the vital capacity, was lower among never-smoking HIV-infected participants compared with never-smoking HIV-uninfected participants (–228 mL; 95% CI, –330 mL to –127 mL; P < .001). This difference also appeared to be relatively unaffected by an increasing number of pack-years smoking in the HIV-infected participants (interaction term “HIV-status × pack-years”: 0.003; 95% CI, –.001 to .007; P = .22). Considering that the interaction terms of HIV with both FVC and with EVC were not statistically significant in these models, it appears the FVC was on average lower in the HIV-infected compared to the HIV-uninfected participants regardless of their smoking history.
Pulmonary Function and Characteristics of Never-Smoking Participants
| Characteristic | HIV Infected (n = 172) | HIV Uninfected (n = 192) | P Value |
|---|---|---|---|
| Obstructive lung disease, GOLD criteria | 15 (8.7) | 41 (21.4) | .001a |
| Obstructive lung disease, GLI criteria | 6 (3.5) | 28 (14.6) | < .001a |
| [Mean (SD)] | |||
| FEV1/FVC | 0.78 (0.1) | 0.75 (0.1) | .003b |
| FEV1/FVC % predictedc | 98.7 (8.7) | 96.0 (8.8) | .003b |
| FEV1 (liter) | 3.38 (0.8) | 3.51 (0.8) | .2b |
| FEV1 % predictedc | 94.8 (14.0) | 93.7 (14.5) | .5 |
| FVC (liter) | 4.39 (1.1) | 4.66 (1.1) | .02b |
| FVC % predictedc | 96.2 (15.9) | 97.3 (13.7) | .5 |
| EVC (liter) | 4.35 (1.2) | 4.79 (1.1) | .001b |
| Height, (cm) | 176 (10.4) | 179 (8.9) | .03b |
| BMI, (kg/m2) | 25 (3.3) | 25 (3.6) | .7b |
| Self-reported history of obstructive lung disease | 21 (12.4) | 18 (9.4) | .36a |
| Male sex at birth | 146 (84.9) | 166 (86.5) | .7a |
| MSM | 121 (70.3) | 140 (73.0) | .6a |
| Nonwhite ethnicity | 29 (16.9) | 14 (7.3) | .005a |
| Use of recreational drugs during last 6 mo | 27 (15.8) | 40 (20.8) | .2 |
| Binge drinkingd | 19 (11.7) | 46 (24.3) | .002 |
| Prior pulmonary CDC class C AIDS-defining illnesse | 49 (28.5) | … | … |
| Prior PCP infection | 18 (10.5) | … | … |
All values are No. (%) unless otherwise indicated. Values in bold indicate a P value <0.05.
Abbreviations: BMI, body mass index; CDC, Centers for Disease Control and Prevention; EVC, expiratory vital capacity; FEV1, 1-second forced expiratory volume; FVC, forced vital capacity; GOLD, Global Initiative for Chronic Obstructive Lung Disease; GLI, Global Lung Initiative; HIV, human immunodeficiency virus; MSM, men who have sex with men; PCP, Pneumocystis jirovecii pneumonia; SD, standard deviation.
aχ2 test.
bTwo-sample t test.
cUsing GLI reference calculations.
dMore than 6 IU/day at least once per month in last 6 months.
eAny pulmonary mycobacterial infections, PCP, recurrent bacterial pneumonia, or candidiasis in trachea, bronchi, or lungs.

Predicted mean 1-second forced expiratory volume (FEV1), forced vital capacity (FVC), FEV1/FVC z scores, and predicted mean absolute expiratory vital capacity (EVC) by pack-years of smoking, stratified by human immunodeficiency virus (HIV) status. For each covariate in Table 1, univariable analyses were performed to assess their association with all of the 4 outcome variables (Supplementary Table 2). Variables associated with a P value < .2 were subsequently included in multivariable models to generate the adjusted mean values shown in this figure. A stepwise backward variable selection process was used to generate the most parsimonious models. The mean outcome values were adjusted for the following covariates in the final models, which were fixed at their mean values in the overall study population: Mean z score FEV1: ethnicity, education level, current smoking status, alcohol use. Mean z score FVC: age, ethnicity, body mass index (BMI), education level, daily marijuana use. Mean z score FEV1/FVC: age, sex, ethnicity, smoking status. Mean EVC: age, sex, BMI, sexual orientation, ethnicity, height, education level. Abbreviations: EVC, expiratory vital capacity; FEV1, 1-second forced expiratory volume; FVC, forced vital capacity; HIV, human immunodeficiency virus.
HIV-Related Characteristics, Markers of Chronic Inflammation, and Lung Function
In further exploratory analyses, we evaluated associations of HIV-related characteristics and chronic inflammation with the z scores of FEV1/FVC, FEV1, and FVC (Table 4). A prior AIDS-defining diagnosis (pulmonary and/or nonpulmonary) was associated with having both a lower FEV1 and FVC and, specifically in the case of prior pulmonary AIDS, resulted in a lower FEV1/FVC ratio. Prior didanosine use was associated with a lower FEV1/FVC ratio, primarily mediated by being associated with a higher FVC. Of the immunological markers in the HIV-infected participants, the strongest association was observed between higher levels of IL-6 with a lower FVC z score.
Association of Human Immunodeficiency Virus (HIV)–Related Characteristics and Markers of Chronic Inflammation With the 1-Second Forced Expiratory Volume (FEV1)/Forced Vital Capacity (FVC), FEV1, and FVC z Scores Within HIV-Infected and -Uninfected Subgroups Using Multiple Linear Regression
| Characteristic | FEV1/FVC z Scorea | FEV1z Scoreb | FVC z Scorec | |||
|---|---|---|---|---|---|---|
| Coeff. | P Value | Coeff. | P Value | Coeff. | P Value | |
| HIV characteristics (HIV-infected subgroup only) | ||||||
| CD4 nadir (per 50 cells/µL increase) | 0.02 | .3 | 0.03 | .06 | 0.03 | .09 |
| Current CD4 (per 50 cells/µL increase) | –0.00 | .9 | –0.00 | .8 | –0.00 | 1.0 |
| Years since HIV diagnosis | –0.00 | .5 | –0.00 | .9 | +0.00 | .6 |
| Prior AIDS diagnosisd | ||||||
| No AIDS diagnosis | ref | ref | ref | ref | ref | ref |
| Prior pulmonary AIDSe | –0.36 | .046 | –0.34 | .048 | –0.13 | .5 |
| Prior nonpulmonary AIDS | –0.04 | .7 | –0.24 | .041 | –0.23 | .058 |
| Both prior pulmonarye and nonpulmonary AIDS | –0.14 | .4 | –0.60 | .001 | –0.55 | .004 |
| Prior PCP diagnosis | –0.29 | .06 | –0.40 | .009 | –0.38 | .017 |
| Prior pulmonary TB | –0.25 | .5 | –0.37 | .3 | –0.49 | .2 |
| Prior bacterial pneumonia | –0.25 | .1 | –0.24 | .1 | –0.13 | .4 |
| Prior d4T use | –0.10 | .3 | –0.07 | .5 | –0.06 | .5 |
| Prior DDI use | –0.25 | .012 | 0.12 | .2 | 0.29 | .004 |
| Markers of chronic inflammation (by HIV-infected and HIV-uninfected subgroups) | ||||||
| IL-6 (pg/mL) | ||||||
| HIV infected | ||||||
| 2–10 vs <2 | 0.22 | .03 | –0.00 | 1.0 | –0.22 | .04 |
| >10 vs <2 | 0.24 | .1 | –0.20 | .2 | –0.44 | .008 |
| HIV uninfected | ||||||
| 2–10 vs < 2 | 0.07 | .4 | –0.11 | .3 | –0.15 | .1 |
| >10 vs <2 | 0.09 | .6 | –0.02 | .9 | –0.07 | .6 |
| Soluble CD14 (per log increase) | ||||||
| HIV infected | –0.09 | .5 | –0.12 | .3 | 0.22 | .08 |
| HIV uninfected | –0.08 | .5 | –0.04 | .8 | 0.6 | .6 |
| Soluble CD163 (per log increase) | ||||||
| HIV infected | 0.02 | .8 | 0.17 | .049 | 0.16 | .07 |
| HIV uninfected | –0.07 | .5 | –0.03 | .8 | –0.00 | .7 |
| hsCRP (per quartile increase) | ||||||
| HIV infected | –0.02 | .7 | –0.04 | .3 | –0.04 | .3 |
| HIV uninfected | –0.00 | 1.0 | –0.12 | .004 | –0.13 | .001 |
| D-dimer (per quartile increase) | ||||||
| HIV infected | –0.09 | .03 | 0.04 | .3 | 0.07 | .07 |
| HIV uninfected | –0.03 | .6 | –0.03 | .5 | –0.00 | .9 |
| CD4/CD8 ratio (per log increase) | ||||||
| HIV infected | –0.02 | .9 | 0.08 | .4 | 0.11 | .2 |
| HIV uninfected | –0.02 | .8 | 0.06 | .5 | 0.07 | .4 |
Each variable was included in a separate multivariable model. Values in bold indicate P value < 0.05.
Abbreviations: Coeff., coefficient; d4T, stavudine; DDI, didanosine; HIV, human immunodeficiency virus; hsCRP, high-sensitivity C-reactive protein; IL-6, interleukin 6; PCP, Pneumocystis jirovecii pneumonia; TB, tuberculosis.
aAdjusted for sex, ethnicity, current smoking status, pack-years smoking, former intravenous drug use, daily marijuana use, body mass index (BMI).
bAdjusted for ethnicity, education level, current smoking status, daily alcohol use.
cAdjusted for age, ethnicity, education level, daily marijuana use, BMI.
dPrior Centers for Disease Control and Prevention category C AIDS-defining illness.
eAny pulmonary mycobacterial infections, PCP, recurrent bacterial pneumonia, or candidiasis in trachea, bronchi, or lungs.
DISCUSSION
We show a strong interaction between HIV status and pack-years smoking concerning the probability of having spirometry-defined obstructive lung disease, with a 2–5 times lower prevalence of spirometry-defined obstructive lung disease among HIV-infected participants compared to HIV-uninfected participants with limited smoking exposure. It is highly unlikely for this to be explained by an actual beneficial effect of HIV, since multiple studies have shown a remarkably high prevalence of chronic pulmonary disease in PLWH, also among never-smokers [15]. For example, in a subgroup analysis of never-smokers in a study using computed tomographic (CT) scan–based criteria to diagnose obstructive lung disease in PLWH, 15.5% had emphysematous changes [16]. PLWH also report higher levels of respiratory symptoms compared with HIV-uninfected people [17, 18]. Furthermore, several HIV characteristics such as a low current CD4 count [19–21], low CD4 nadir [22], high viral load [20, 23], prior pulmonary infections [24, 25], and parameters of chronic inflammation [22, 26] have each been associated with a higher occurrence of obstructive lung disease. Moreover, the higher FEV1/FVC ratio was not related to a higher FEV1—which would truly support an advantageous effect—but with a lower FVC in the HIV-infected participants.
Lower Vital Capacity in PLWH
The lower FVC and EVC with a rather preserved FEV1 in HIV-infected participants may suggest the presence of restrictive lung disease. Unfortunately, total lung capacity (TLC), the gold standard for restrictive lung disease, was not measured. Several studies have reported similar results. HIV-infected African (never-smoking) children had a lower FVC compared with HIV-uninfected children, unrelated to their higher frequency of pulmonary coinfections including tuberculosis [27]. Results from studies using CT scans as diagnostic tool report not only emphysematous but also fibrotic changes, where emphysema was correlated with smoking history, but fibrosis was associated with HIV indices such as viral load [28, 29]. Furthermore, long-term HIV infection has been strongly associated with a lower diffusion capacity (DCLO) [30–32]. One study found a low DCLO to be associated with a lower FVC in never-smokers, but with a lower FEV1 in smokers [32]. Within a multicohort study, spirometry-defined restrictive lung disease prevalence was reported to be as high as 10% among PLWH; however, these results were also not verified by TLC measurements [24].
In our study, prior pulmonary and nonpulmonary AIDS diagnoses were associated with both a lower FEV1 and FVC. Didanosine use was associated with a higher FVC; this unexpected finding could be the result of a survival bias or a chance finding in the context of multiple testing. In summary, these findings all suggest HIV-specific effects on pulmonary function measured by spirometry.
Morris et al [25] similarly showed long-lasting declines in pulmonary function following HIV-associated pulmonary infections. FEV1, FVC, and the FEV1/FVC ratio all declined and did not recover, most significantly after episodes of PCP. This study also included TLC measurements, the gold standard for diagnosing restrictive lung disease. TLC did not decline after PCP—disputing the theory of permanent fibrotic changes and leaving an enhanced residual volume as explanation for the decrease in vital capacity, probably as an expression of small airways disease. The main difference with our study is that the FEV1 remains constant, which is highly unlikely in small airway disease. This illustrates the need for caution when using spirometry to detect restrictive changes. FVC and EVC are biased in many ways including the effort and strength of the test subject, which results in a <60% positive predictive value for spirometry to diagnose restrictive lung disease [33]. HIV infection has been associated with the early development of sarcopenia [34, 35], which might also affect the strength and function of respiratory muscles, thus contributing to a lower average measured FVC and higher FEV1/FVC ratio. Since we did not inquire about respiratory symptoms or use other tools to measure pulmonary function, determining the clinical significance of these findings as well as their long-term consequences requires further studies.
Living With HIV and Being a Heavy Smoker
The effect of HIV on the FEV1/FVC ratio was attenuated with increasing pack-years of smoking; there was a lower FEV1/FVC ratio in the heavy-smoking HIV-infected participants compared with HIV-uninfected participants with similar smoking exposure. However, this difference did not result in a higher prevalence of obstructive lung disease and seemed to be resulting from a preserved FVC instead of a lower FEV1. Follow-up of these heavy-smoking participants over the coming years may further clarify these results.
Strengths and Limitations
Our results were strongly influenced by the very high prevalence of obstructive lung disease (21%) in the HIV-uninfected never-smoking control group, being >3 times higher compared to similarly aged never-smokers in a Dutch general population study [36] and also demonstrable by the negative mean FEV1 and FEV1/FVC z scores. Tobacco smoking (active or passive) is the primary risk factor for COPD in the Netherlands, with generally limited occupational hazards or exposure to other indoor toxic fumes. In the recruitment of our control group, we successfully included a majority of MSM comparable to our HIV-infected participants and reflective of the HIV epidemic in the Netherlands. These mostly urban citizens without children are not comparable to the general population, which was the reason for their selection. Their lifestyle may have involved more going out in clubs or bars, reflected in their common alcohol and recreational drug use and the high number of sexual partners. This would likely have resulted in a significant amount of passive smoking exposure, as smoking was ubiquitous in bars and clubs in the Netherlands until 2008, when new regulations were put in place. The strength of our cohort is its ability to account for bias from difficult-to-measure confounders such as secondhand smoking using lifestyle-comparable control subjects. However, as we did not measure these exposures, we cannot exclude the possibility of sampling bias and recruitment of HIV-uninfected MSM with heavy secondhand smoke exposure, especially since recent alcohol use and sexual risk behavior were higher in the HIV-uninfected study group. A further limitation of this study was the possibility of measurement bias due to the spirometry being performed at 2 study sites for the 2 respective study groups. However, equipment was identical and study nurse training was repeatedly synchronized to ensure comparable measurements across study sites. Furthermore, we were unable to distinguish between COPD and asthma as postbronchodilator spirometry was not performed. As these 2 conditions have a very different underlying pathogenesis, they could also be differently affected by HIV. Although very few participants reported ever having been diagnosed with a form of obstructive pulmonary disease, we cannot exclude the possibility of preexisting asthma or any form of HIV-associated asthma to be influencing our results.
CONCLUSIONS
Chronic pulmonary disease in PLWH in the context of adequate antiretroviral treatment is likely to be diverse and multifactorial in origin. PLWH, similar to their lifestyle-comparable peers, are at high risk of obstructive lung disease due to their behavioral and social background, extending beyond measurable traditional risk factors such as personal smoking histories. This study shows that HIV might influence pulmonary function differently compared to traditional risk factors such as smoking. It could shed light on a repeatedly reported discrepancy between higher levels of respiratory symptoms in studies comparing people with and without HIV infection, but normal spirometry findings [17, 18, 37]. HIV might inflict a more fibrotic or restrictive rather than obstructive pulmonary dysfunction pattern, which could be masked by the effects of heavy smoking. Longitudinal analyses will have to evaluate if these changes should be considered as stabilized scars from prior uncontrolled HIV or associated pulmonary infections, or as part of an ongoing process during suppressed HIV infection, in the context of chronic inflammation. Clinicians should therefore be cautious in using spirometry as a sole diagnostic tool, and consider measuring total lung and diffusion capacity and/or CT imaging to appropriately diagnose a potential mixed pattern of pulmonary conditions in PLWH.
Supplementary Data
Supplementary materials are available at The Journal of Infectious Diseases online. Consisting of data provided by the authors to benefit the reader, the posted materials are not copyedited and are the sole responsibility of the authors, so questions or comments should be addressed to the corresponding author.
Notes
Disclaimer. None of the funding bodies had a role in the design or conduct of the study, the analysis and interpretation of the results, the writing of the report, or the decision to submit the manuscript for publication.
Financial support. This work was supported by The Netherlands Organization for Health Research and Development (grant number 300020007) and AIDS Fonds (grant number 2009063). Additional unrestricted scientific grants were received from Gilead Sciences, ViiV Healthcare, Janssen Pharmaceuticals N.V., and Merck & Co.
Potential conflicts of interest. S. O. V., R. A. v. Z., and P. R. through their institution have received independent scientific grant support from Gilead Sciences, Janssen Pharmaceuticals, Merck & Co, and ViiV Healthcare. F. W. W. has served on scientific advisory boards for ViiV Healthcare and Gilead Sciences. R. P. v. S. has no potential conflicts of interest related to this manuscript. G. D. K. was supported by a Fulbright Global Scholar award (US Department of State) and by the National Institute of Allergy and Infectious Diseases (grant number K24-AI118591). M. B. D. has participated in advisory consulting for Boehringen-Ingelheim, GlaxoSmithKline, and AstraZeneca. R. A. v. Z. has received travel grants from Gilead Sciences and was a speaker at an event sponsored by Gilead Sciences for which her institution received remuneration. J. F. N. has participated in educational activities for ViiV Healthcare, Gilead Sciences, and BMS for which her institution has received remuneration. M. F. S. v. d. L. has received independent scientific grant support from Sanofi Pasteur, MSD Janssen Infectious Diseases and Vaccines, and Merck; has served on the advisory board of GSK; and has received nonfinancial support from Stichting Pathologie Onderzoek en Ontwikkeling. P. R. has served on scientific advisory boards for Gilead Sciences, ViiV Healthcare, Merck & Co, and Teva Pharmaceutical Industries; and has served on a data and safety monitoring committee for Janssen Pharmaceuticals, for which his institution has received remuneration. All authors have submitted the ICMJE Form for Disclosure of Potential Conflicts of Interest. Conflicts that the editors consider relevant to the content of the manuscript have been disclosed.
These data were previously presented at the 22nd International AIDS Conference, Amsterdam, The Netherlands, 2018. Abstract TUPEB147.
References
APPENDIX
AGEhIV Cohort Study Group:
Scientific oversight and coordination: P. Reiss (principal investigator), F. W. N. M. Wit, M. van der Valk, J. Schouten, K. W. Kooij, R. A. van Zoest, E. Verheij, S. O. Verboeket, B. C. Elsenga (Amsterdam University Medical Centers [UMC], University of Amsterdam, Department of Global Health and Amsterdam Institute for Global Health and Development [AIGHD]). M. Prins (co-principal investigator), M. F. Schim van der Loeff, L. del Grande, V. Olthof, M. Dijkstra (Public Health Service of Amsterdam, Department of Infectious Diseases).
Data management: S. Zaheri, M. M. J. Hillebregt, Y. M. C. Ruijs, D. P. Benschop, A. el Berkaoui (HIV Monitoring Foundation).
Central laboratory support: N. A. Kootstra, A. M. Harskamp-Holwerda, I. Maurer, M. M. Mangas Ruiz, A. F. Girigorie, B. Boeser-Nunnink (Amsterdam UMC, Laboratory for Viral Immune Pathogenesis and Department of Experimental Immunology).
Project management and administrative support: W. Zikkenheiner, F. R. Janssen (AIGHD).
Participating HIV physicians and nurses: S. E. Geerlings, A. Goorhuis, J. W. R. Hovius, F. J. B. Nellen, T. van der Poll, J. M. Prins, P. Reiss, M. van der Valk, W. J. Wiersinga, M. van Vugt, G. de Bree, F. W. N. M. Wit; J. van Eden, A. M. H. van Hes, F. J. J. Pijnappel, A. Weijsenfeld, S. Smalhout, M. van Duinen, A. Hazenberg (Amsterdam UMC, Division of Infectious Diseases).
Other collaborators: P. G. Postema (Amsterdam UMC, Department of Cardiology); P. H. L. T. Bisschop, M. J. M. Serlie (Amsterdam UMC, Division of Endocrinology and Metabolism); P. Lips (Amsterdam UMC); E. Dekker (Amsterdam UMC, Department of Gastroenterology); N. van der Velde (Amsterdam UMC, Division of Geriatric Medicine); J. M. R. Willemsen, L. Vogt (Amsterdam UMC, Division of Nephrology); J. Schouten, P. Portegies, B. A. Schmand, G. J. Geurtsen (Amsterdam UMC, Department of Neurology); F. D. Verbraak, N. Demirkaya (Amsterdam UMC, Department of Ophthalmology); I. Visser, A. Schadé (Amsterdam UMC, Department of Psychiatry); P. T. Nieuwkerk, N. Langebeek (Amsterdam UMC, Department of Medical Psychology); R. P. van Steenwijk, E. Dijkers (Amsterdam UMC, Department of Pulmonary Medicine); C. B. L. M. Majoie, M. W. A. Caan (Amsterdam UMC, Department of Radiology); H. W. van Lunsen, M. A. F. Nievaard (Amsterdam UMC, Department of Gynecology); B. J. H. van den Born, E. S. G. Stroes (Amsterdam UMC, Division of Vascular Medicine); W. M. C. Mulder, S. van Oorspronk (HIV Vereniging Nederland).
Author notes
Members of the AGEhIV Study Group are listed in the Appendix.

