


Abstract
Recent data suggest that human coronavirus (HCoV) pneumonia is associated with significant mortality in hematopoietic cell transplant (HCT) recipients. Investigation of risk factors for prolonged shedding and intrahost genome evolution may provide critical information for development of novel therapeutics.
We retrospectively reviewed HCT recipients with HCoV detected in nasal samples by polymerase chain reaction (PCR). HCoV strains were identified using strain-specific PCR. Shedding duration was defined as time between first positive and first negative sample. Logistic regression analyses were performed to evaluate factors for prolonged shedding (≥21 days). Metagenomic next-generation sequencing (mNGS) was conducted when ≥4 samples with cycle threshold values of <28 were available.
Seventeen of 44 patients had prolonged shedding. Among 31 available samples, 35% were OC43, 32% were NL63, 19% were HKU1, and 13% were 229E; median shedding duration was similar between strains (P = .79). Bivariable logistic regression analyses suggested that high viral load, receipt of high-dose steroids, and myeloablative conditioning were associated with prolonged shedding. mNGS among 5 subjects showed single-nucleotide polymorphisms from OC43 and NL63 starting 1 month following onset of shedding.
High viral load, high-dose steroids, and myeloablative conditioning were associated with prolonged shedding of HCoV in HCT recipients. Genome changes were consistent with the expected molecular clock of HCoV.
Respiratory viruses are associated with prolonged shedding, higher rates of lower respiratory tract disease, and mortality in hematopoietic cell transplant (HCT) recipients. Development of novel therapeutics and effective infection prevention has been critically important, especially for well-established respiratory viruses such as respiratory syncytial virus, influenza virus, and parainfluenza viruses [1–4]. With new molecular diagnostics widely available, similar concerns have been raised for other respiratory viruses including human coronavirus (HCoV) [5]. In addition to the demonstration of frequent prolonged shedding of HCoV after HCT [6], recent data suggest that common HCoVs (229E, OC43, NL63, and HKU1) are important respiratory pathogens related to significant mortality in HCT recipients [7]. Data on host and virologic factors associated with prolonged shedding, including genome evolution within a host, may provide a rationale for the development of antiviral therapy at various stages, but are currently lacking. Therefore, we examined HCT recipients to define viral and host factors associated with prolonged HCoV shedding in the upper respiratory tract and examine evolution of viral genomic sequences over time by metagenomic next-generation sequencing (mNGS).
METHODS
Study Design
We reviewed HCT recipients with HCoV detected in nasal samples by multiplex respiratory viral polymerase chain reaction (PCR) at the Fred Hutchinson Cancer Research Center. Subjects were required to have a negative viral PCR test within 2 weeks of the last positive virology testing performed. If the interval between consecutive positive tests was beyond 2 weeks, strain identification was performed using both samples to confirm the strains were the same. The subjects were identified from 2 cohorts (Supplementary Figure). The first cohort included patients whose nasal samples were collected and tested for clinical purposes when respiratory symptoms were present from March 2009 through June 2016. The second cohort came from a prospective surveillance study of HCT recipients undergoing transplant from December 2005 and February 2010 [8]. Standardized respiratory symptom surveys and multiplex respiratory PCR tests were performed weekly during the first 100 days posttransplant, then every 3 months through year 1 posttransplant and whenever respiratory symptoms occurred between days 100 and 365 posttransplant. Only subjects with respiratory symptoms were selected for the current study, and no duplicated subjects were analyzed. Separately, mNGS was conducted when ≥4 positive samples with cycle threshold (Ct) values of <28 were available irrespective of presence of respiratory symptoms from the above-mentioned prospective surveillance study of HCT recipients. Demographic and clinical data were collected from the database and medical chart review. The study was approved by the Institutional Board Review at Fred Hutchinson Cancer Research Center.
Laboratory Testing and Definitions
HCoV detection and viral load were determined from nasal specimens by quantitative reverse-transcription PCR as part of a multiplex PCR used to detect 12 respiratory viruses. Strain-specific PCR was performed using saved nasal samples according to a previously published protocol [9]. mNGS was performed on DNAse I-treated RNA extracts from 0.45-uM filtered nasal specimens using “tagmented” (transposon-mediated fragmentation) cDNA libraries with 15–20 cycles of PCR amplification when ≥4 samples with Ct values of <28 were available [10]. Sequence reads were trimmed using cutadapt and aligned to a concatenation of the 4 HCoV reference genomes (NC_002645, NC_005831, NC_006577, and KF530069) using Geneious version 9.1 [11]. The duration of shedding was defined as time between the first positive and first negative sample. Prolonged shedding was defined as the duration of shedding ≥21 days, which was described to be a median shedding duration of HCoV during the first 100 days after HCT [6]. Highest daily steroid dose and lowest cell count in the 2 weeks prior to first HCoV detection were recorded. Conditioning regimen was categorized into myeloablative and nonmyeloablative/reduced intensity based on the definition previously described [12].
Statistical Analysis
Univariable and bivariable logistic regression analyses were performed to evaluate associations between virologic and host factors and prolonged shedding. Only the first episode of HCoV infection per subject was used for the outcome analyses. Variables with P ≤ .2 in the univariable models were candidates for bivariable models. Kruskal-Wallis test was performed to compare continuous values among more than 2 groups. Two-sided P values <.05 were considered statistically significant. All statistical analyses were performed using SAS 9.4 for Windows (SAS Institute, Cary, North Carolina).
RESULTS
Host and Virological Characteristics
We identified 20 and 24 HCT recipients with respiratory HCoV infection from cohort 1 and cohort 2, respectively (42 adult and 2 pediatric patients) (Table 1 and Supplementary Figure). The median duration of shedding was 14 days (4–60 days), and 17 patients had prolonged shedding (≥21 days). Among 31 available nasal samples, 35% were OC43, 32% were NL63, 19% were HKU1, and 13% were 229E. The median shedding duration of HCoV in nasal samples did not differ between strains (Figure 1; P = .79).
Clinical Features of Patients With Human Coronavirus Upper Respiratory Tract Disease
| Characteristic | Total (N = 44) | Patients With Prolonged Shedding (n = 17) | Patients With Short-term Shedding (n = 27) |
|---|---|---|---|
| Female sex | 18 (41) | 7 (41) | 11 (41) |
| Age, y, median (range) | 54 (7–73) | 54 (7–67) | 55 (14–73) |
| Transplant number ≥2 | 12 (27) | 6 (35) | 6 (22) |
| Cell source | |||
| Cord | 3 (7) | 2 (12) | 1 (4) |
| Bone marrow | 4 (9) | 2 (12) | 2 (7) |
| PBSC | 37 (84) | 13 (76) | 24 (89) |
| Donor type | |||
| Autologous | 3 (7) | 1 (6) | 2 (7) |
| Related | 21 (48) | 6 (35) | 15 (56) |
| Unrelated | 20 (45) | 10 (59) | 10 (37) |
| Conditioning regimen | |||
| Myeloablative | 18 (41) | 10 (59) | 8 (30) |
| NMA or RIC | 26 (59) | 7 (41) | 19 (70) |
| Onset of shedding relative to transplant | |||
| Pretransplant | 4 (9) | 4 (23) | 0 |
| 0–100 days posttransplant | 22 (50) | 6 (35) | 16 (59) |
| >100 days posttransplant | 18 (41) | 7 (41) | 11 (41) |
| Human coronavirus strains | |||
| OC43 | 11 (25) | 3 (18) | 8 (30) |
| NL63 | 10 (23) | 5 (29) | 5 (19) |
| 229E | 4 (9) | 2 (12) | 2 (7) |
| HKU1 | 6 (14) | 2 (12) | 4 (15) |
| Unknown | 13 (30) | 5 (29) | 8 (30) |
| Ct value, median (range) | 28.3 (19.2–39.4) | 26.1 (19.2–39.4) | 28.8 (19.6–39.4) |
| Lowest WBC count <1000 × 106 cells/La | 14/36 (39) | 3/15 (20) | 11 /21 (52) |
| Lowest lymphocyte count <300 × 106 cells/La | 18/36 (50) | 6 /15 (40) | 12/21 (57) |
| Lowest neutrophil count <500 × 106 cells/La | 13/36 (36) | 3/15 (20) | 10 /21 (48) |
| Lowest monocyte count <100 × 106 cells/La | 16/36 (44) | 5/15 (33) | 11/21 (52) |
| Highest daily steroid dosea | |||
| None | 26 (59) | 8 (47) | 18 (67) |
| ≤1 mg/kg | 12 (27) | 5 (29) | 7 (26) |
| >1 mg/kg | 6 (14) | 4 (24) | 2 (7) |
Data are presented as No. (%) unless otherwise indicated.
Abbreviations: Ct, cycle threshold; NMA, nonmyeloablative; PBSC, peripheral blood stem cell; RIC, reduced intensity; WBC, white blood cell.
aIn the 2 weeks prior to first human coronavirus detection.
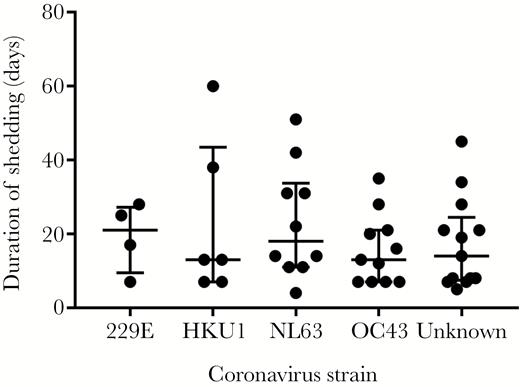
Duration of shedding according to human coronavirus strain. The bars indicate median values and first and third quartiles (P = .79 by Kruskal-Wallis test).
Outcome Analyses
Initial high viral load (Ct value below the median) was associated with prolonged shedding with the lowest P value (<.01) by univariable analysis. Univariable and bivariable logistic regression analyses indicated that initial high viral load was associated with prolonged shedding consistently in all models (Table 2). High-dose steroid use (≥1 mg/kg/day) prior to HCoV diagnosis and myeloablative conditioning regimen were associated with prolonged shedding in the bivariable analyses. Four patients started viral shedding prior to transplant; therefore, we separately analyzed 40 patients who started shedding after transplant, and the results remained similar (data not shown.)
Univariable and Bivariable Logistic Regression Analyses for Prolonged Shedding (n = 44)a
| Covariates | Categories | Univariable Model | Bivariable Model 1 | Bivariable Model 2 | Bivariable Model 3 | Bivariable Model 4 | |||||
|---|---|---|---|---|---|---|---|---|---|---|---|
| OR (95% CI) | P Value | Adjusted OR (95% CI) | P Value | Adjusted OR (95% CI) | P Value | Adjusted OR (95% CI) | P Value | Adjusted OR (95% CI) | P Value | ||
| Ct value | <28.3 vs ≥28.3 | 6.5 (1.6–26) | <.01 | 11.6 (2.1–64.7) | <.01 | 11.0 (2.1–58.8) | <.01 | 5.1 (1.0–25.2) | .05 | 5.5 (1.1–26.8) | .03 |
| Conditioning regimen | MA vs NMA/RIC | 3.4 (.95–12) | .06 | 6.9 (1.3–38) | .03 | ||||||
| Highest steroid doseb (mg/kg/ day) | ≥1 vs <1 | 3.85 (.6–24) | .15 | 10.1 (1.1–96) | .05 | ||||||
| Lowest WBC countb (×106 cells/L) | <1.0 vs ≥1.0 | 0.23 (.05–1.05) | .06 | 0.33 (.06–1.7) | .18 | ||||||
| Lowest neutrophil countb (×106 cells/L) | <0.5 vs ≥0.5 | 0.28 (.06–1.3) | .10 | 0.37 (.07–1.9) | .23 | ||||||
| Lowest lymphocyte countb (×106 cells/L) | <0.3 vs ≥0.3 | 0.5 (.13–1.9) | .31 | ||||||||
| Lowest monocyte countb (×106 cells/L) | <0.1 vs ≥0.1 | 0.45 (.12–1.8) | .26 | ||||||||
| Transplant number | ≥2 vs ≤1 | 1.91 (.5–7.3) | .35 | ||||||||
| Age at diagnosis | As continuous | 0.98 (.94–1.03) | .48 | ||||||||
Abbreviations: CI, confidence interval; Ct, cycle threshold; MA, myeloablative; NMA, nonmyeloablative; OR, odds ratio; RIC, reduced intensity; WBC, white blood cell.
aVariables with P ≤ .2 in the univariable models were candidates for bivariable models where data only support inclusion of 2 factors per model.
bIn the 2 weeks prior to first human coronavirus detection.
Whole-Genome Sequencing
Whole genomes of OC43, NL63, and HKU1 were consecutively sequenced in samples from 4 HCT adult subjects and 1 pediatric subject where samples were available for 19 to 132 days following the first positive sample (Table 3). Engraftment occurred in 4 patients prior to the start of shedding. No majority consensus variants were recovered for any patient <30 days after onset of shedding. Single-nucleotide variants accumulated at a rate of approximately 1 variant per 3–4 weeks, consistent with previous estimates of the HCoV molecular clock (Figure 2) [13, 14]. No single-nucleotide polymorphisms (SNPs) of OC43 and HKU1 were recovered in patients 4 and 5, respectively. One adult patient (patient 3) developed lower respiratory tract disease in the setting of high-dose steroid use for acute graft-vs-host disease during prolonged shedding. Bronchoalveolar lavage was performed at day 73 after starting the shedding, from which Aspergillus fumigatus was detected in addition to HCoV OC43. One 18-year-old pediatric patient (patient 4) had 3 different HCoV strains detected in succession over a period of 5 months.
Specimens Sequenced in this Study
| Patient | Strain | Species | Daya | Ct Values | HCoV Reads | Total Reads | Accession |
|---|---|---|---|---|---|---|---|
| 1 | N07-196B | NL63 | –10 | 26.1 | 291765 | 465084 | KY554969 |
| N07-262B | NL63 | 4 | 25.9 | 72640 | 249121 | KY829118 | |
| N07-468B | NL63 | 42 | 26.2 | 59658 | 191697 | KY554971 | |
| 2 | N06-1144B | NL63 | 48 | 25.7 | 341740 | 428487 | KY554967 |
| N07-6B | NL63 | 64 | 27.7 | 67223 | 342554 | KY674915 | |
| N07-64B | NL63 | 79 | 24.5 | 136330 | 239866 | KY674916 | |
| N07-185B | NL63 | 107 | 24.1 | 30368 | 79584 | KY554968 | |
| N07-324B | NL63 | 135 | 25 | 56685 | 542950 | KY554970 | |
| 3 | N09-33B | OC43 | 9 | 21.5 | 128622 | 213882 | KY554974 |
| N09-382B | OC43 | 77 | 27.1 | 8063 | 137198 | KY554975 | |
| N09-595B | OC43 | 118 | 27.6 | 6297 | 1044785 | KY674920 | |
| 4 | N07-1541B | OC43 | 116 | 23.8 | 160033 | 580450 | KY554972 |
| N07-1609B | OC43 | 130 | 24.7 | 43692 | 221874 | KY674917 | |
| N07-1647B | OC43 | 137 | 22.7 | 107905 | 147986 | KY674918 | |
| N08-87B | HKU1 | 174 | 27 | 23772 | 737630 | KY674921 | |
| N08-434B | 229E | 248 | 27.2 | 12019 | 2981384 | KY674919 | |
| 5 | N09-1605B | HKU1 | 29 | 20.8 | 1636757 | 2936518 | KY674943 |
| N09-1627B | HKU1 | 36 | 23.5 | 491949 | 877155 | KY674942 | |
| N09-1663B | HKU1 | 47 | 27.8 | 9164 | 266311 | KY674941 |
The number of HCoV reads, total reads, Ct values, and accession number are depicted for each of the specimens for which whole genomes were recovered.
Abbreviations: Ct, cycle threshold; HCoV, human coronavirus.
aDay is relative to engraftment.
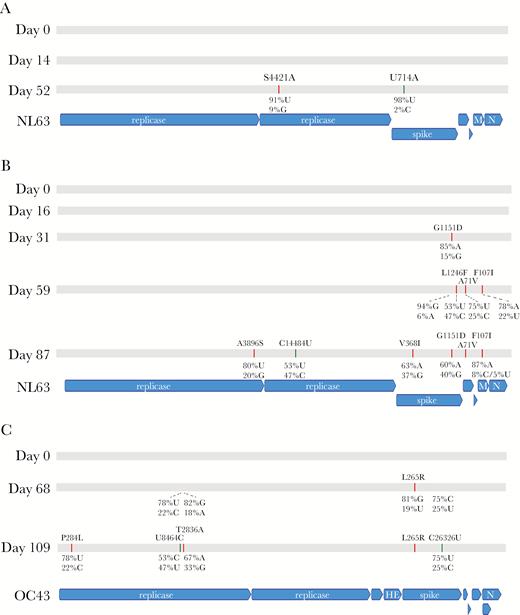
Genome evolution of human coronavirus over time. Single-nucleotide variants in the consensus genome for patient 1 (A), 2 (B), and 3 (C) are depicted. Patients 4 and 5 showed no variants over time for the same coronavirus species (Table 3). Both nonsynonymous and synonymous variants are depicted relative to the day 0 genome recovered. Majority consensus nonsynonymous changes at allele frequency >50% are indicted in red, while majority consensus synonymous changes at allele frequency >50% are shown in green. Allele frequencies for variant sites are depicted when the majority allele had <95% frequency. Nonsynonymous changes are shown for the amino acid of a given gene, while synonymous changes are shown for the nucleotide of that gene. Allele frequencies alone are shown when the majority consensus base is not a variant relative to the day 0 genome but the majority allele frequency at that base is <95% (in flux). Abbreviations: HE, hemagglutinin esterase; M, membrane protein; N, nucleocapsid protein.
DISCUSSION
In this study, we demonstrated a significant association between prolonged shedding of HCoV and initial high viral load in transplant recipients. In addition, prior high-dose steroid use and myeloablative conditioning regimen appear to be associated with prolonged shedding. The duration of shedding appeared to be similar across all 4 HCoV strains. No drastic intrahost evolution of viral genomes occurred in this immunocompromised population with prolonged shedding.
Severe acute respiratory syndrome and Middle East respiratory syndrome (MERS) coronaviruses are recognized as highly human-pathogenic coronaviruses causing fatal lower respiratory tract disease [15–17]; however, there are no established antiviral therapies [18, 19]. Recent data suggest that lower respiratory tract disease caused by 4 other HCoV strains (229E, OC43, NL63, and HKU1) was also associated with significant respiratory support and mortality in immunocompromised hosts [7]. The unmet need for the development of antiviral therapy against HCoV is expected to expand as immunocompromised populations grow. We found that initial high viral load, prior high-dose steroid use, and myeloablative conditioning were important factors associated with prolonged HCoV shedding in HCT recipients. Duration of viral shedding is often used as an endpoint at early stages of clinical trials for new antiviral drugs [20, 21]. Stratification based on risk factors is critical to avoid imbalances due to host and viral factors in randomized trials, which might otherwise mask true differences of experimental agents.
Genetic variability of HCoV OC43 at the community level and intrahost heterogeneity of MERS coronavirus have been reported [22–25]. Such variability might have important implications in viral disease pathogenesis, and the study of viral genome evolution within a host can provide vital information important in developing and assessing antiviral agents [26]. For example, development of antiviral drug resistance during individualized therapy that is associated with poor outcome has been described extensively with influenza virus [27–29]. Grad et al reported intrahost genome evolution of respiratory syncytial virus over time in an infant with severe combined immune deficiency who underwent a bone marrow transplant [30]. The viral population diversity dramatically increased after engraftment, which appeared to reflect dynamic response to immune pressure from host immunity. To our knowledge, no previous data exist describing how the HCoV genome evolves within a host over time. In the current study, engraftment occurred in 4 of 5 patients sequenced prior to the onset of shedding. Interestingly, no SNPs were recovered <30 days after the onset of shedding even after immune reconstitution. Variants accumulated starting at 1 month after the onset of shedding (1–6 changes over time), consistent with the previously estimated evolution rates of HCoV [13, 14]. Given the relatively slow evolution rate of coronaviruses, these observations could be promising from the standpoint of antiviral resistance and therapeutic development [13, 14]. Due to their exceptionally large RNA genomes, coronaviruses are known to encode highly processive polymerases as well as proofreading exoribonucleases that temper viral genome evolution relative to other RNA viruses [31–33]. Further epidemiological and biochemical work is required to characterize the functional impact of the variants recovered here.
The main limitation of this study was the relatively small sample size; thus, bivariable logistic regression analyses were performed instead of multivariable analyses to evaluate risk factors for prolonged shedding. Similarly, although no particular strain appeared to be associated with prolonged shedding, strain identification using saved samples was successful in only 70% of the patients, which limited our ability to detect small difference of shedding duration among each HCoV strain. Further studies with larger sample sizes will help to clarify the distinct association between particular HCoV strains and prolonged shedding. Finally, our cohort included 4 patients who had documented HCoV shedding prior to transplant. Considering the unmeasured influence of their different backgrounds on our analyses, we separately analyzed 40 patients who started shedding after transplant. Only univariable logistic regression analysis could be performed due to the small sample size, with similar results.
This is the first study to evaluate risk factors associated with prolonged shedding of HCoV by quantitative and strain-specific reverse transcription PCR as well as intrahost genomic evolutions by metagenomic RNA sequencing in transplant recipients. Our study provides critical information to develop antiviral therapies and design randomized trials with viral load endpoints. In addition, as the duration of shedding is an important determinant of viral infectivity and transmissibility, predictive factors for prolonged shedding may provide useful information for effective infection control, such as the expected duration of isolation. Further studies are needed to validate the risk factors including particular HCoV strain for prolonged shedding.
Supplementary Data
Supplementary materials are available at The Journal of Infectious Diseases online. Consisting of data provided by the authors to benefit the reader, the posted materials are not copyedited and are the sole responsibility of the authors, so questions or comments should be addressed to the corresponding author.
Notes
Acknowledgments. We thank Zachary Stednick for database services, Reigran Sampoleo and Isabel Palileo for laboratory assistance, and Laurel Joncas-Shronce for sample management assistance.
Financial support. This work was supported by the National Institutes of Health (K24HL093294 to M. B., K23 AI114844 to A. W., CA18029 to W. L., CA15704 to H. X., T32HD00723332 to C. O.); the Fred Hutchinson Cancer Research Center Vaccine and Infectious Disease Division (biorepository); and a Pediatric Infectious Diseases Society Fellowship Award funded by Horizon Pharma to C.O..
Potential conflicts of interest. M. B. and J. A. E. have received research support and served as a consultant for Gilead Sciences. All other authors report no potential conflicts. All authors have submitted the ICMJE Form for Disclosure of Potential Conflicts of Interest. Conflicts that the editors consider relevant to the content of the manuscript have been disclosed.
References
Author notes
Correspondence: M. Boeckh, MD, PhD, Vaccine and Infectious Disease Division, Fred Hutchinson Cancer Research Center, 1100 Fairview Ave N, Seattle, WA 98109 ([email protected]).

