


Knowledge about mortality rates (MRs) in patients with chronic hepatitis C (CHC) with cirrhosis is limited. This study aimed to estimate all-cause MRs among patients with CHC with or without cirrhosis in Denmark compared with the general population.
Patients registered in the Danish Database for Hepatitis B and C with CHC and a liver fibrosis assessment were eligible for inclusion. Liver fibrosis was assessed by means of liver biopsy, transient elastography, and clinical cirrhosis. Up to 20 sex- and age-matched individuals per patient were identified in the general population. Data were extracted from nationwide registries.
A total of 3410 patients with CHC (1014 with cirrhosis), and 67 315 matched individuals were included. Adjusted MR ratios (MRRs) between patients with or without cirrhosis and their comparison cohorts were 5.64 (95% confidence interval [CI], 4.76–6.67) and 1.94 (1.55–2.42), respectively. Cirrhosis among patients was associated with an MRR of 4.03 (95% CI, 3.43–4.72). A cure for CHC was associated with an MRR of 0.64 (95% CI, 0.40–1.01) among cirrhotic patients and 2.33 (1.47–3.67) compared with the general population.
MRs were high among patients with CHC with or without cirrhosis compared with the general population. Curing CHC was associated with a reduction in MR among cirrhotic patients, but the MR remained higher than the general population.
An estimated 5%–20% of patients with chronic hepatitis C (CHC) will develop liver cirrhosis [1]. The prevalence of CHC in Denmark is estimated to be 0.38%–0.49%, of whom only half of affected persons are aware of their hepatitis C virus (HCV) status and even fewer attend specialized care [2]. Liver cirrhosis induced by CHC is a serious health issue with potential complications, including decompensation or hepatocellular carcinoma (HCC) [3–6], and is associated with increased mortality rates (MRs) [7–9]. Achieving a sustained virologic response 24 weeks after the end of treatment (EOT) (SVR24) [10] in patients with severe fibrosis or cirrhosis is associated with reduced MRs [11]. Because risk factors associated with poor health outcomes are prevalent among patients who acquire CHC [12, 13] and cirrhosis per se is associated with poor outcomes regardless of its cause [7], it is not surprising to find an increased MR compared with the general population [5, 12]. Patients with CHC with or without cirrhosis share many of the same underlying behavioral risk factors, and patients with CHC who are free of cirrhosis can serve as a comparison group to estimate the MR associated with cirrhosis. Previous studies of MRs in patients with CHC-induced cirrhosis have been based on selected, relatively small cohorts in single or multicenter studies [4, 5, 9]. To the best of our knowledge, no previous studies have included patients from all CHC-managing outpatient clinics in a country to estimate MRs in a large cohort of patients with CHC and liver cirrhosis or estimate the MRs associated with SVR24 in cirrhotic patients. Denmark provides an ideal setting to carry out large cohort studies owing to a long tradition of registries with the possibility of interregistry linkage [14–16]. The aims of the current study were to estimate the all-cause MR in patients with CHC and cirrhosis and compare this with the all-cause MR in patients with CHC without cirrhosis and to the general population. We also aimed to estimate the MR associated with SVR24 in patients with cirrhosis and compare it with that in the general population.
METHODS
Study Design
This observational cohort study is based on prospectively collected data from nationwide registries. The Danish health care system is publicly funded and health care services are free of charge to the individual. This study was approved by the Danish Data Protection Agency (J.nr.2013-41-2323) in accordance with Danish law.
Data Sources
Patients were identified in the Danish Database for Hepatitis B and C (DANHEP), a nationwide database with ongoing enrollment since 1 January 2002 [17]. Briefly, it contains demographic, clinical, transient elastography (TE), liver biopsy, and laboratory data on patients seen at least once in a specialized outpatient clinic with CHC and/or chronic hepatitis B (CHB). All patients give oral and written consent to be registered in DANHEP. Cross-linkage between nationwide registries is possible owing to the unique 10-digit personal identification number (PIN) [16] given to all residents in Denmark and registered in the Danish Civil Registration System, along with dates of birth and death, emigration status, immigration status, address, and more. All hospital admission dates and diagnoses are registered in the Danish National Patient Registry (NPR) [18], histopathologic diagnoses in the National Danish Pathology Database (Patobank) [19, 20], and cancer diagnoses in the Danish Cancer Registry [14]. For further details on the registries see the Supplementary Material.
Cohort Selection
Patients registered in DANHEP were included if they fulfilled the following criteria: liver fibrosis assessment and enrollment in DANHEP before 31 December 2012, ≥1 positive HCV RNA result, age ≥18 years, a valid PIN, and a Danish address. All International Classification of Diseases (ICD) and Systematized Nomenclature of Medicine (SNOMED) [21] codes used in the definitions of inclusion and exclusion criteria and covariates are provided in the Supplementary Data. To avoid reverse causation, follow-up commenced 6 months after the first liver fibrosis assessment date or enrollment date in DANHEP, whichever occurred last, or 1 January 2002, from here on referred to as baseline. Liver fibrosis assessment was based on the following methods: liver biopsy specimen assessed according to METAVIR fibrosis score (F0–F4) [22]; TE (FibroScan; Echosens) median elasticity [23], with ≥10 valid measurements and an interquartile range ≤30% of the median elasticity [24]; and clinical cirrhosis (ascites, hepatic encephalopathy, esophageal varices or variceal hemorrhage, or spontaneous bacterial peritonitis).
Cirrhosis was defined as the presence of 1 of the following: fibrosis score of F4 at liver biopsy, median elasticity at TE of ≥17.0 kPa [25], or clinical cirrhosis. The cutoff of 17.0 kPa was based on a prospective study reporting similar rates of liver-related complications among patients with CHC with a median elasticity of ≥17.0 kPa and patients with biopsy-confirmed cirrhosis [25]. Patients who did not fulfill the cirrhosis criteria were classified as noncirrhotic. For patients enrolled without cirrhosis in whom cirrhosis subsequently developed, the cirrhosis baseline was defined as the first date of cirrhosis, and they contributed with risk time as both noncirrhotic and cirrhotic. Up to 20 comparison individuals per patient were identified in the Danish Civil Registration System from the general population. Comparison individuals had to be alive at the patient's baseline date and were matched on date of birth (±183 days), sex, and county of residence. Patients and comparison individuals were excluded if they had a diagnosis of CHB, liver cirrhosis (comparison cohort), CHC (comparison cohort), autoimmune hepatitis, human immunodeficiency virus (HIV) infection, hemochromatosis, or Wilson disease at baseline.
Outcome and Covariates
Patients and comparison individuals were followed up from baseline until the primary outcome: death from any cause, loss to follow-up, or 31 December 2013, whichever occurred first. All individuals were censored at the time of HIV infection, CHB, CHC (comparison cohort), liver cirrhosis (comparison cohort), autoimmune hepatitis, hemochromatosis, or Wilson disease. To assess the presence of comorbid conditions, a cumulative Charlson Comorbidity Index (CCI) [26] score was calculated based on ICD codes assigned to hospital admissions registered in NPR (ICD codes are provided in the Supplementary Material). Liver disease, HCC, and extrahepatic manifestations of CHC [27, 28], were considered part of the causal pathway from CHC to death and were excluded from the CCI score when patients were compared with comparison individuals. Only liver disease and HCC were excluded in analyses of patients alone.
The presence of HCC was defined as a diagnosis of HCC registered in Patobank, the Danish Cancer Registry, or NPR. Orthotopic liver transplantation (LTX) was defined as an LTX procedure registered in NPR. Injection drug use (IDU) ever was defined as an IDU-related diagnosis registered in NPR before the end of follow-up, self-reported IDU, or IDU as route of HCV transmission registered in DANHEP. Alcohol overuse ever was defined as having an alcohol abuse–related diagnosis registered in NPR, a histopathologic diagnosis of alcoholic hepatitis or cirrhosis, or self-reported daily alcohol consumption of >36 g for men and >24 g for women [29, 30] registered in DANHEP before the end of follow-up. Decompensated liver cirrhosis was defined as 1 of the following diagnoses registered in NPR or DANHEP: ascites, esophageal variceal hemorrhage, hepatic encephalopathy, or spontaneous bacterial peritonitis [6]. Psychiatric disease was defined as a diagnosis of psychiatric disease registered in NPR. SVR24 was registered in DANHEP and was defined as the absence of HCV RNA 24 weeks after EOT. Non-SVR24 was defined as a treatment with known treatment response that did not result in SVR24. The date 24 weeks (168 days) after EOT is referred to as the EOT24 date. Reinfection was defined as ≥1 positive HCV RNA result after a period with undetectable HCV RNA following the EOT24 date.
Statistical Analysis
For comparison of baseline characteristics, the Mann–Whitney U test or χ2 test was applied to determine statistical significance. The incidence rate of cirrhosis was calculated as the number of new cases divided by the sum of follow-up years at risk, and presented as cases per 100 person-years (PYs). All results are presented with corresponding 95% confidence intervals (CIs). For comparison of time to event between patients and their comparison cohorts, Kaplan–Meier life-table analyses were performed, and the log–rank test was applied for statistical significance. Poisson regression analyses were used to calculate MRs (deaths per100 PYs) and MR ratios (MRRs). The MRR of cirrhotic and noncirrhotic patients versus their comparison cohorts were adjusted for sex and the time-dependent covariates: cirrhosis, psychiatric disease, age (<40, 40–44,45–49, 50–54, 55–59, 60–64, 65–69, 70–74, 75–79, 80–84, 85–89, or ≥90 years), and CCI score (0, 1, 2, 3, 4, 5, or ≥6). The CCI score did not show log linearity and thus was kept as close as possible to the original score, while ensuring events in all strata, by creating a categorical covariate with levels from 0 to ≥6.
In the analyses including only patients, age, psychiatric disease, CCI score, cirrhosis, LTX, liver decompensation, antiviral treatment, and HCC were always introduced as time-dependent covariates with the aforementioned strata, whereas sex, alcohol overuse, and IDU were introduced as categorical covariates. Alcohol overuse and IDU were used as categorical baseline covariates owing to the causal links between IDU and CHC and between alcohol overuse and cirrhosis. The MRR associated with cirrhosis among patients with CHC was adjusted for alcohol overuse, IDU, sex, psychiatric disease, age, and CCI score. Using different models, we calculated MRR adjusted for relevant confounders associated with initiating antiviral treatment, LTX, HCC, IDU, alcohol overuse, and liver decompensation among patients with CHC and cirrhosis. The MR associated with SVR24 in cirrhotic patients who reached ≥1 EOT24 date before the end of follow-up was adjusted for sex, IDU, alcohol overuse, psychiatric disease, liver decompensation, HCC, LTX, age, and CCI score. In this analysis, time to event was defined as time from the first EOT24 date or the cirrhosis baseline, whichever occurred last, until the end of follow-up. We included SVR24 as a time-dependent covariate in the model, allowing patients who were treated multiple times to contribute with non-SVR24 and SVR24 risk time. Reinfection led to censoring at the time of the first positive HCV RNA result after SVR24.
Follow-up after SVR24 was started at the first EOT24 date with SVR24 or the cirrhosis baseline, whichever occurred last, until the end of follow-up or reinfection, whichever occurred first. Follow-up after non-SVR24 was started at the first EOT24 date with non-SVR24 or the cirrhosis baseline, whichever occurred last, until SVR24 or end or follow-up, whichever occurred first. Follow-up as untreated was defined as time from the cirrhosis baseline until the initiation of antiviral treatment or end of follow-up, whichever occurred first. A Kaplan–Meier survival function was computed among cirrhotic patients comparing time to event after SVR24, time to event after non-SVR24, and time untreated. To compare patients with SVR24 with their comparison cohort, follow-up was commenced at the first EOT24 date with SVR24 or baseline, whichever occurred last, and was adjusted for sex, age, psychiatric disease, and CCI score. Owing to overdispersion, a scale parameter (deviance) was introduced in the Poisson regression models. The risk time and number of events for each risk stratum in the time to event analyses were calculated using the Stratify macro [31]. All statistical tests for significance were 2 sided, with an α value of .05. Statistical analyses were performed using SAS 9.4 software (SAS Institute), except for Kaplan–Meier survival functions, for which R software (R-3.2.2 [32]) was used.
RESULTS
In March 2013, a total of 5856 HCV RNA–positive patients were registered in DANHEP. After the exclusion of patients with temporary PIN or no registered address, data were extracted from nationwide registries on 5779 patients. Of these, 4080 (70.6%) had a liver fibrosis assessment available. After exclusion of 670 patients (16.4%; reasons for exclusion listed in Supplementary Data), 3410 patients (83.6%) with CHC were included in the final analyses, 2564 (75%) without cirrhosis and 846 (25%) with cirrhosis at baseline. During follow-up, an additional 168 patients had cirrhosis diagnosed after a median of 3.6 years from baseline; thus, the final cirrhosis cohort comprised 1014 patients. The comparison cohorts for noncirrhotic and cirrhotic patients consisted of 50 663 and 19 861 individuals, respectively. Baseline characteristics of patients and comparison cohorts are listed in Table 1. Loss to follow-up was minimal, with 69 patients without cirrhosis (2.7%), 7 (0.7%) with cirrhosis, and 847 (1.2%) comparison individuals lost to follow-up. Reasons for loss to follow-up were emigration, no address, or no vital status registered in the Danish Civil Registration System.
Baseline Characteristics of Patients With or Without Cirrhosis and Individuals in Their Comparison Cohort
| Parameter | Patients Without Cirrhosis (n = 2564) | Comparison Cohort for Patients Without Cirrhosis (n = 50 663) | P Valuea | Patients With Cirrhosis (n = 1014) | Comparison Cohort for Patients With Cirrhosis (n = 19 861) | P Valueb |
|---|---|---|---|---|---|---|
| Age, median (range), y | 45.0 (18.5–95.5) | 44.9 (18.1–95.9) | .80 | 51.8 (26.0–86.3) | 51.8 (25.5–86.7) | .80 |
| Sex, No. (%) | ||||||
| Male | 1559 (60.8) | 30 737 (60.7) | .89 | 698 (68.8) | 13 650 (68.7) | .94 |
| Female | 1005 (39.2) | 19 926 (39.3) | 316 (31.2) | 6211 (31.3) | ||
| CCI score, median (range)c | 0 (0–7) | 0 (0–10) | .001 | 0 (0–10) | 0 (0–12) | .001 |
| CCI score, No. (%) | ||||||
| 0 | 1985 (77.4) | 43 907 (86.7) | 621 (61.2) | 16 006 (80.6) | ||
| 1–2 | 514 (20.0) | 5961 (11.8) | 310 (30.6) | 3285 (16.5) | ||
| 3–5 | 62 (2.4) | 732 (1.4) | 74 (7.3) | 506 (2.6) | ||
| ≥6 | 3 (0.1) | 63 (0.1) | 9 (0.9) | 64 (0.3) | ||
| Psychiatric disease, No. (%) | 381 (14.9) | 1798 (3.5) | .001 | 196 (19.3) | 808 (4.1) | .001 |
| Diabetes mellitus, No. (%) | 83 (3.2) | 1191 (2.4) | .004 | 124 (12.2) | 740 (3.7) | .001 |
| Region of birth, No. (%) | ||||||
| Western Europed | 2100 (81.9) | … | … | 819 (80.8) | … | … |
| Eastern Europe | 107 (4.2) | … | … | 22 (2.2) | … | … |
| The Americas | 20 (0.8) | … | … | 13 (1.3) | … | … |
| Africa | 76 (3.0) | … | … | 39 (3.9) | … | … |
| Asia | 202 (7.9) | … | … | 104 (10.3) | … | … |
| Othere | 8 (0.3) | … | … | 1 (0.1) | … | … |
| Unknown | 51 (2.0) | … | … | 16 (1.6) | … | … |
| Route of transmission, No. (%) | ||||||
| IDU | 1545 (60.3) | … | … | 550 (54.2) | … | … |
| Tattoo/piercing | 45 (1.8) | … | … | 30 (3.0) | … | … |
| Vertical | 15 (0.6) | … | … | 6 (0.6) | … | … |
| Sexual transmission | 61 (2.4) | … | … | 13 (1.3) | … | … |
| Blood/blood product exposure | 173 (6.8) | … | … | 72 (7.1) | … | … |
| Needle injury | 24 (0.9) | … | … | 12 (1.2) | … | … |
| Multiple | 18 (0.7) | … | … | 8 (0.8) | … | … |
| Other reason | 32 (1.3) | … | … | 10 (1.0) | … | … |
| Unknown | 651 (25.4) | … | … | 313 (30.9) | … | … |
| HCV genotypes, No. (%) | ||||||
| 1f,g | 1166 (45.5) | … | … | 433 (42.7) | … | … |
| 2 | 204 (8.0) | … | … | 61 (6.0) | … | … |
| 3h | 930 (36.3) | … | … | 374 (36.9) | … | … |
| 4–7 | 68 (2.7) | … | … | 27 (2.7) | … | … |
| Unknown | 196 (7.6) | … | … | 119 (11.7) | … | … |
| Liver stiffness, No. (%) | ||||||
| F0 | 567 (22.1) | … | … | … | … | … |
| F1 | 862 (33.6) | … | … | … | … | … |
| F2 | 321 (12.5) | … | … | … | … | … |
| F3 | 116 (4.5) | … | … | … | … | … |
| TE, median (range) | 6.1 (2.3–16.9) | … | … | … | … | … |
| No. (%), kPa | 698 (27.2) | … | … | … | … | … |
| Diagnostic basis for cirrhosis, No (%) | ||||||
| Liver biopsy | … | … | … | 492 (48.5) | … | … |
| Clinical cirrhosis | … | … | … | 372 (36.7) | … | … |
| TE | … | … | … | 150 (14.8) | … | … |
| Decompensated liver cirrhosis, No. (%) | … | … | … | 211 (20.8) | … | … |
| Ascites | … | … | … | 124 (12.2) | … | … |
| Esophageal variceal hemorrhage | … | … | … | 70 (6.9) | … | … |
| Hepatic encephalopathy | … | … | … | 41 (4.0) | … | … |
| Spontaneous bacterial peritonitis | … | … | … | 7 (0.7) | … | … |
| ALT, median, IQR, IU/L | 63 (39–110) (n = 2486) | … | … | 83 (48–136) (n = 979) | … | … |
| Bilirubin, μmol/mL, median, IQR | 8 (6–11) (n = 527) | … | … | 12 (8–19) (n = 271) | … | … |
| Platelets, median (IQR) 109 cells/mL | 223 (182–267) (n = 1368) | … | … | 132 (91–191.5) (n = 536) | … | … |
| Alcohol abuse ever, No. (%)i | 782 (30.5) | … | … | 580 (57.2) | … | … |
| IDU ever, No. (%)i | 1626 (63.4) | … | … | 583 (57.5) | … | … |
Data regarding cirrhosis was not applicable to either comparison cohorts or patients without cirrhosis.
Abbreviations: ALT, alanine transaminase; CCI, Charlson Comorbidity Index; HCV, hepatitis C virus; IDU, injection drug use; IQR, interquartile range; TE, transient elastography.
a Comparing patients without cirrhosis with their comparison cohort.
b Comparing patients with cirrhosis with their comparison cohort.
c Diagnoses of liver disease and hepatocellular carcinoma were excluded from the CCI presented in the table. All patients and individuals in the comparison cohort who did not have a known CCI score at baseline were set to have a CCI score of 0.
d Greenland is part of Denmark.
e Including island states in the Pacific Ocean.
f Eleven patients without cirrhosis were coinfected with genotypes 1 and 2; 22 with genotypes 1 and 3; and 3 with genotypes 1 and 4.
g Three patients with cirrhosis were coinfected with genotypes 1 and 2, and 9 with genotypes 1 and 3.
h Eight patients were coinfected with genotypes 2 and 3, and 1 with genotypes 3 and 4.
i Number of overall and percentage of patients with IDU or alcohol overuse before the end of follow-up; χ2 or Mann–Whitney U tests were applied to determine statistical significance whenever appropriate.
Crude MRs Stratified by Sex, and Unadjusted and Adjusted MRRsa
| Patient Group | MR, Deaths/100 PYs (95% CI) | |||||
|---|---|---|---|---|---|---|
| Patients | Comparison Cohort | MRR for Patients vs Comparison Cohort (95% CI) | ||||
| Patients without cirrhosis | ||||||
| Males | 1.21 (0.76–1.91) | 0.45 (0.37–.53) | Unadjusted: 2.70 (1.70–4.36); adjusted: 1.94 (1.55–2.42) | |||
| Females | 0.86 (0.53–1.39) | 0.32 (0.25–.40) | ||||
| All | 1.02 (0.65–1.60) | 0.38 (0.32–.45) | ||||
| Patients with cirrhosis | ||||||
| Males | 8.24 (6.03–11.26) | 0.90 (0.74–1.10) | Unadjusted: 9.14 (6.39–13.06); adjusted: 5.64 (4.76–6.67) | |||
| Females | 5.86 (4.11–8.35) | 0.64 (0.50–.83) | ||||
| All | 6.95 (5.09–9.48) | 0.76 (0.63–.92) | ||||
Abbreviations: CI, confidence interval; MR, mortality rate; MRR, MR ratio; PYs, person-years.
a Adjusted MRRs were adjusted for sex, age, Charlson Comorbidity Index score, and psychiatric disease. Poisson regression analyses were used to calculate MR and MRR.
Crude MRs Stratified by Age and Unadjusted and Adjusted MRRsa
| Patient Group | MR, Deaths/100 PYs (95% CI) | MRR | ||
|---|---|---|---|---|
| Patients | Comparison Cohort | Unadjusted | Adjustedb | |
| Patients by age group, y | ||||
| Without cirrhosis | ||||
| 18–39 | 0.69 (0.34–1.40) | 0.07 (0.04–.12) | 9.43 (3.99–22.27) | 5.77 (3.07–10.84) |
| 40–49 | 0.72 (0.36–1.44) | 0.18 (0.14–.25) | 3.91 (1.84–8.32) | 2.55 (1.61–4.03) |
| 50–59 | 1.18 (0.50–2.78) | 0.48 (0.36–.65) | 2.44 (0.98–6.05) | 1.83 (1.23–2.72) |
| 60–69 | 2.14 (0.75–6.12) | 1.10 (0.80–1.52) | 1.95 (0.65–5.84) | 1.26 (0.79–2.02) |
| ≥70 | 2.73 (0.42–17.72) | 2.10 (1.33–3.32) | 1.30 (0.19–8.91) | NAc |
| With cirrhosis | ||||
| 18–39 | 3.59 (0.96–13.44) | 0.10 (0.02–0.57) | 36.12 (4.05–322.39) | 15.08 (3.19–71.32) |
| 40–49 | 4.75 (2.66–8.50) | 0.22 (0.13–0.39) | 21.27 (9.47–47.76) | 11.31 (6.88–18.57) |
| 50–59 | 7.88 (4.86–12.79) | 0.59 (0.42–0.84) | 13.32 (7.31–24.26) | 6.65 (5.04–8.76) |
| 60–69 | 8.90 (4.70–16.88) | 1.37 (1.01–1.87) | 6.49 (3.19–13.21) | 3.83 (2.83–5.19) |
| ≥70 | 8.20 (2.33–28.91) | 2.66 (1.70–4.18) | 3.08 (0.81–11.74) | NA |
| Cirrhotic vs noncirrhotic | ||||
| 18–39 | … | … | 5.24 (3.02–9.09) | 4.39 (2.56–7.55) |
| 40–49 | … | … | 6.58 (4.85–8.91) | 4.05 (2.99–5.50) |
| 50–59 | … | … | 6.68 (5.10–8.75) | 4.64 (3.57–6.03) |
| 60–69 | … | … | 4.15 (2.83–6.10) | 3.51 (2.45–5.03) |
| ≥70 | … | … | 3.00 (1.14–7.88) | NAc |
Abbreviations: CI, confidence interval; MR, mortality rate; MRR, MR ratio; NA, not applicable; PYs, person-years.
a Age was used as a time-dependent covariate in the stratification.
b For the comparisons between patients with or without cirrhosis and their respective comparison cohorts, MRRs were adjusted for sex, age, Charlson Comorbidity Index score, and psychiatric disease. For the comparisons between cirrhotic and noncirrhotic patients, the MRRs were adjusted for cirrhosis, sex, injection drug use, alcohol overuse, Charlson Comorbidity Index score, and psychiatric disease.
c Not applicable owing to insufficient number of events. Poisson regression analyses were used to calculate MRs and MRRs.
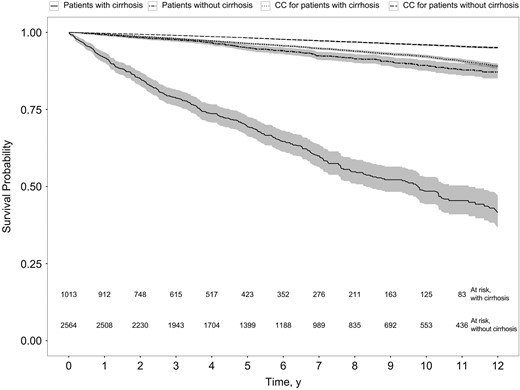
Kaplan–Meier plot of survival probability in patients with or without cirrhosis and their comparison cohorts (CCs) (P < .001; log–rank test).
Among patients with CHC, the adjusted MRR associated with cirrhosis was 4.03 (95% CI, 3.43–4.72). The adjusted MRR associated with cirrhosis compared with either F0–F1 or F2–F3 fibrosis remained at about 4, and genotype was not found to be associated with MRs (Supplementary Tables 2 and 3). The incidence of cirrhosis was 1.06/100 PYs (95% CI, .92–1.24). The crude MR for patients with compensated cirrhosis at baseline (n = 802) was 5.90/100 PYs (95% CI, 5.00–6.97) and 23.48/100 PYs (19.89–27.71) after decompensation (n = 351). The MRRs associated with decompensation, HCC, LTX, alcohol overuse, and IDU are shown in Table 4. Of 687 initiated courses of treatment in 538 cirrhotic patients, 497 (72.3%) consisted of pegylated interferon and ribavirin (Peg/RBV). The remaining regimens were as follows: 121 (17.6%) interferon based, 52 (7.6%) Peg/RBV with a direct-acting antiviral drug, 13 (1.9%) Peg or RBV alone, and 4 (0.6%) interferon free.
MRRs for Patients with Chronic Hepatitis C and Cirrhosisa
| Covariateb | MRR (95% CI) |
|---|---|
| Liver decompensation | 4.98 (3.90–6.37) |
| HCC | 5.71 (4.27–7.63) |
| Liver transplantation | 0.35 (.18–.65) |
| Alcohol overuse | 2.31 (1.71–3.12) |
| IDU | 1.04 (.81–1.34) |
| Covariateb | MRR (95% CI) |
|---|---|
| Liver decompensation | 4.98 (3.90–6.37) |
| HCC | 5.71 (4.27–7.63) |
| Liver transplantation | 0.35 (.18–.65) |
| Alcohol overuse | 2.31 (1.71–3.12) |
| IDU | 1.04 (.81–1.34) |
Abbreviations: CI, confidence interval; HCC, hepatocellular carcinoma; IDU, injection drug use; MRR, mortality rate ratio.
a Poisson regression analyses were used to calculate mortality rates and MRRs.
b Liver decompensation was adjusted for sex, alcohol overuse, IDU, age, psychiatric disease, HCC, and Charlson Comorbidity Index (CCI) score; HCC, for sex, alcohol overuse, IDU, age, psychiatric disease, and CCI score; liver transplantation, for sex, alcohol overuse, IDU, age, psychiatric disease, HCC, CCI score, and liver decompensation; alcohol overuse, for sex, IDU, age, psychiatric disease, and CCI score; and IDU, for sex, alcohol overuse, age, psychiatric disease, HCC, CCI score, and liver decompensation.
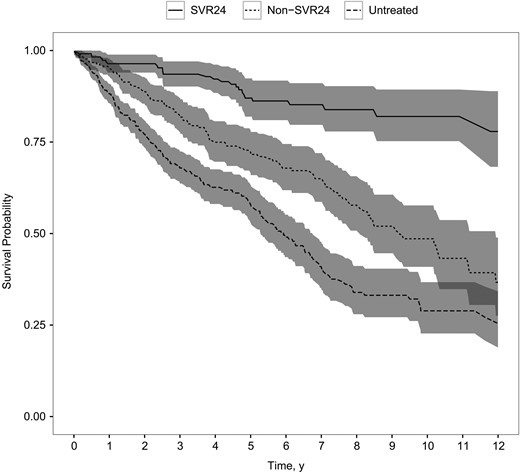
Kaplan–Meier plot of survival probability in patients with cirrhosis following sustained virologic response 24 weeks after the end of treatment (SVR24), in patients without such response (non-SVR24), and in untreated patients (P < .001; log–rank test).
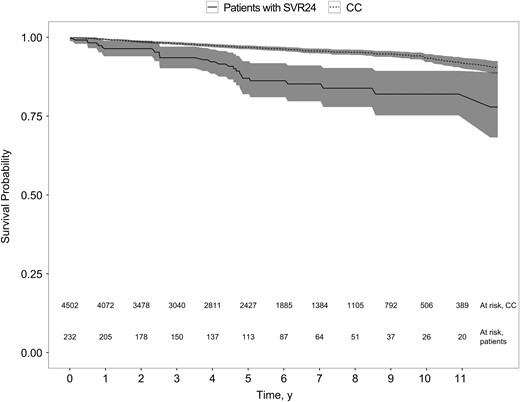
Kaplan–Meier plot of survival probability in patients with cirrhosis following sustained virologic response 24 weeks after the end of treatment (SVR24) and their matched comparison cohort (CC) (P < .001; log–rank test).
DISCUSSION
We found a markedly increased MR in patients with CHC and cirrhosis compared with both noncirrhotic patients with CHC and the general population, and we were able to demonstrate a reduction in MR associated with achieving SVR24 among patients with CHC and cirrhosis, although the MR remained high compared with the general population. To our knowledge, this is the first time a large cohort of patients with CHC and cirrhosis, enrolled from all specialized departments in a country, has been characterized and compared with a cohort of noncirrhotic patients with CHC and the general population, taking important confounders into account in a time-dependent manner.
In our cohort the adjusted MRRs observed between patients without cirrhosis and comparison individuals (Table 3) were generally lower than those reported by Omland et al [12] and generally higher for patients with cirrhosis. This is not surprising, because the cohort in the Danish study by Omland et al included almost all patients with CHC but did not include information about cirrhosis. It is important, however, to consider the fact that the MR in our cohort of patients without cirrhosis was artificially low because deaths occurring after a diagnosis of cirrhosis were censored from the cohort of patients without cirrhosis. The mean annual MR of about 4% and standardized MRRs between 3 and 4 described in studies [4, 5, 33, 34] including patients with CHC with almost exclusively compensated cirrhosis are lower than the MR in our study. This was despite slightly older cohorts [4, 5], a higher prevalence of diabetes mellitus [34], and the inclusion of patients with competing causes of liver diseases (7% of patients) [4]. However, these earlier studies are likely to have included highly selected cohorts of patients from a single or a few centers involving few patients with IDU and few with moderate to high alcohol intake (≥40 g/d) and including only patients willing to attend regular visits [4] or be enrolled in a clinical trial [34]. How much of the increased MR in patients with cirrhosis seen in our cohort compared with the general population is caused by CHC, cirrhosis, IDU, and alcohol overuse, or unaccounted for confounding, cannot be determined based on the data in the current study. However, the 4-fold increase in MR associated with cirrhosis among patients with CHC can be seen as an estimate for the excess MR in the presence of cirrhosis.
Van der Meer et al demonstrated reduced MRs associated with achieving SVR24 in patients with CHC and advanced hepatic fibrosis [11]. We confirmed a reduction in all-cause MR associated with SVR24 in a large cohort of patients with CHC and cirrhosis. The reduction in MR associated with initiation of antiviral treatment is probably the result of a selection effect more than a survival benefit per se, given the many contraindications to interferon-based regimes [10, 35]. With the introduction of direct-acting antivirals that have very few contraindications, even patients with advanced liver disease are eligible for treatment and can achieve high SVR rates [36, 37]. Henceforth the biologic effect of eradicating HCV is expected to become even more pronounced in future research. However, active alcohol abuse and IDU remain relative contraindications to treatment with direct-acting antivirals [38]. In our cohort, current or past alcohol overuse was prevalent, more frequent in cirrhotic patients, and associated with increased MR. This is not surprising because alcohol abuse increases the risk of developing cirrhosis in patients with CHC [39, 40]. In contrast, current or past IDU was not associated with increased MR. This probably reflects the fact that ongoing IDU was low in this population.
In contrast to previous studies [41, 42], we found that, despite SVR24, patients with CHC with cirrhosis showed a MR 2-fold that of the general population. In 1 study [41], follow-up commenced at the start of antiviral treatment, and it is unclear whether immortal time bias was present in the comparison with the general population. Another possible explanation for the higher MR found after SVR24 may be that patients included in our study had higher prevalences of alcohol overuse, comorbid conditions, and more advanced liver disease (Supplementary Table 1). Although the follow-up in our study was shorter, the comparison cohort from the general population was more precisely matched, and we could adjust for important confounders in a time-dependent manner. Although achieving SVR24 no doubt decreases the MR in patients with cirrhosis in many settings, MRs comparable to those of age- and sex-matched peers free of CHC and cirrhosis do not necessarily follow. This may reflect risk factors present in the CHC patient population, such as substance abuse and comorbid conditions.
Among the strengths of our study is the setting with prospectively collected data for all patients with CHC seen in outpatient clinics in Denmark. The unique PIN with the option to link between various national registries ensures negligible loss to follow-up. Changing the TE cutoff for cirrhosis to ≥13.01 kPa [43] identified an additional 70 patients with cirrhosis but did not change the results significantly (data not shown). This real-world study had minimal selection bias among patients attending specialized care but unfortunately did not cover the majority of patients with diagnosed or undiagnosed CHC in Denmark [2], which limits the generalizability of the results. The fact that 25% of patients had cirrhosis at baseline suggests that our population is a skewed population with regard to liver disease [1]. Other limitations include the fact that we had no information on smoking, HCV RNA concentrations, CHC duration, Child-Pugh classification, body mass index, quantity of alcohol use, and whether IDU or alcohol overuse were current or past. This limited our ability to properly adjust for risk factors associated with CHC compared with the general population. The incidence rate of cirrhosis in this study was based on a relatively short follow-up time and thus cannot be used to draw any conclusions on the long-term natural history of CHC infection.
In conclusion, the MR was substantially increased among patients with CHC and cirrhosis seen in Danish outpatient clinics compared with both patients with CHC without cirrhosis and the general population. Cirrhosis in patients with CHC was associated with a 4-fold increase in MR, and SVR24 was associated with a reduced MR in patients with cirrhosis. However, even after SVR24, the MR remained elevated compared with the general population, and a history of alcohol overuse or IDU, comorbid conditions, and psychiatric disease were prevalent and are important health issues that need to be addressed.
Supplementary Data
Supplementary materials are available at http://jid.oxfordjournals.org. Consisting of data provided by the author to benefit the reader, the posted materials are not copyedited and are the sole responsibility of the author, so questions or comments should be addressed to the author.
Notes
Acknowledgments. We would like to acknowledge all patients and the DANHEP group for data.
Financial support. This work was supported by Bonén Foundation and the Danish Council for Research and Innovation (grant12-127717 to N. W.).
Potential conflict of interest. P. B. C. reports grants from Gilead, AbbVie, and Merck Sharp & Dohme (MSD), outside the submitted work. M. R. C. has served on advisory boards for and received personal fees from Gilead, AbbVie, and MSD. A. L. L. reports fees from MSD, personal fees and other support from AbbVie, grants, personal fees and other from Bristol-Myers Squibb (BMS), and grants and other support from Gilead, during the conduct of the study. P. S. has received grants and served as a speaker and on advisory boards for BMS, Gilead, and AbbVie. L. G. M. has served on advisory boards for BMS and AbbVie, as a speaker for Medivir and BMS, and as a clinical investigator for Norgine. J. G. has received grants, participated on advisory boards, or served as speaker for AbbVie, ViiV, Gilead, BMS, MSD, and Medivir. N. W. has received honoraria from AbbVie, BMS, Gilead, Medivir, and MSD, has served on advisory boards for AbbVie, BMS, Gilead, Medivir, and MSD, and is a clinical investigator for AbbVie, BMS, and MSD. All other authors report no potential conflicts. All authors have submitted the ICMJE Form for Disclosure of Potential Conflicts of Interest. Conflicts that the editors consider relevant to the content of the manuscript have been disclosed.
References
Author notes
Presented in part: The International Liver Congress 2016, Barcelona, Spain, 15 April 2016. Abstract poster FRI-194.

