


Abstract
The function and regulation of the immune response triggered during malaria is complex and poorly understood, and there is a particular paucity of studies conducted in humans infected with Plasmodium vivax. While it has been proposed that T-cell-effector responses are crucial for protection against blood-stage malaria in mice, the mechanisms behind this in humans remain poorly understood. Experimental models of malaria have shown that the regulatory molecules, cytotoxic T-lymphocyte attenuator-4 (CTLA-4), lymphocyte activation gene-3 (LAG-3), and programmed death-1 (PD-1) are involved in the functional impairment of T cells during infection. Our goal was to define the role of these molecules during P. vivax malaria. We demonstrate that infection triggers the expression of regulatory molecules on T cells. The pattern of expression differs in CD4+ and CD8+ T cells. Higher frequencies of CD4+ express more than 1 regulatory molecule compared to CD8+ T cells. Moreover, lower proportions of CD4+ T cells coexpress regulatory molecules, but are still able to proliferate. Importantly, simultaneously blockade of the CLTA-4, PD-1, and T-cell immunoglobulin and mucin–3 signaling restores the cytokine production by antigen-specific cells. These data support the hypothesis that upregulation of inhibitory receptors on T cells during P. vivax malaria impairs parasite-specific T-cell effector function.
Malaria caused by Plasmodium vivax is widely distributed and causes serious morbidity and economical problems in developing countries [1]. Innate and acquired immune responses have been shown to be important for host control of parasite replication during malaria [2–4]. However, the immune system is unable to eliminate the parasite, and malaria patients may succumb to infection, or eventually, remain asymptomatic for long periods [5, 6]. Indeed, the generation of an adaptive immune response against Plasmodium is often delayed and not sterilizing, suggesting an inadequate host response or evasion of immunity by the parasites. Furthermore, both B- and T-cell responses are rapidly lost in individuals that leave endemic areas, indicating that the continuous exposure to Plasmodium antigens is needed for the maintenance of effector and memory lymphocytes [7]. Therefore, it remains unclear why complete protection against infection is not achieved [8, 9].
Parasite-infected red blood cells have been described to interfere in the generation of memory T cells and antibody production. Their ability to alter T-cell activation by dendritic cells is a controversial issue [10–12]. High antigen dose during malaria might trigger dendritic cell apoptosis, decreasing CD4+ T-cell activation and memory development. Moreover, reallocation of activated T cells and Fas-mediated apoptosis are some mechanisms that also have been attributed to the impaired T-cell functions and the lymphopenia observed during malaria [13, 14]. In fact, a significant proportion of antigen-specific CD4+ T cells die or lose function after Plasmodium infection [15].
A complex regulatory network that inhibits the generation of exacerbated immune responses has an important role to prevent immune-mediated pathology during infectious diseases, including malaria [16–19]. While interferon (IFN)–γ mediates immune protection against Plasmodium [20], experimental models of malaria have shown that both IFN-γ and tumor necrosis factor (TNF)–α are also key elements in disease pathogenesis [21–23]. Among other functions, cytokines have been shown to induce the expression of programmed death-1 (PD-1) and its ligand [24], limiting T-cell-effector function [25]. Indeed, in experimental models of malaria, the expression of regulatory molecules by antigen-specific T cells is essential to regulate the immune response triggered against Plasmodium [23, 26–28].
It has been described that high levels of PD-1 and lymphocyte-activation gene-3 (LAG-3) are expressed on T cells from P. falciparum–infected patients [26, 29]. A recent study [26] showed that P. falciparum–infected humans displayed higher expression of PD-1. In the same study, the authors showed in an experimental model that in vivo blockade of the PD-1 ligand 1 and the LAG-3 restores CD4+ T-cell function, leading to a rapid parasite clearance [26]. Furthermore, another group [29] showed higher expression of PD-1 and LAG-3 on CD4+ and CD8+ T cells in patients from a high P. falciparum–endemic village.
Given the importance of regulatory molecules in the development of the immune response and the consequent control of immunopathology, we have explored the hypothesis that the upregulation of regulatory molecules on T cells during P. vivax infection inhibits parasite-specific T-cell-effector functions. To address this question, we assessed the expression of several regulatory molecules and their impact on T-cell-effector functions in P. vivax–infected individuals before treatment (BT) and after successful antimalarial treatment (AT). Here, we demonstrated that the expression of cytotoxic T-lymphocyte attenuator-4 (CTLA-4), LAG-3, PD-1, and T-cell immunoglobulin and mucin–3 (TIM-3) is elevated on T cells during acute malaria and a proportion of these cells coexpress the activation marker inducible costimulator (ICOS) and the proliferation marker Ki-67. Importantly, we found that the simultaneous blockage of CTLA-4, PD-1, and TIM-3 signaling pathways in cells from P. vivax–infected patients leads to the production of higher levels of cytokines upon antigen-specific stimulation.
PATIENTS, MATERIALS, AND METHODS
Patients
P. vivax–infected patients with uncomplicated malaria were enrolled in this study at Centro de Pesquisa de Medicina Tropical de Rondônia (CEPEM) in Porto Velho, Rondônia, a malaria-endemic area in the Amazon, Brazil. A total of 100 mL of peripheral blood was collected from each patient after confirmation of P. vivax infection by thick blood smear film, and again 30–45 days AT and polymerase chain reaction (PCR) conducted [30] (n = 25, ranging from 20 to 62 years old [38 ± 10.97]) (Supplementary Data). Patients were treated according to the Brazilian Ministry of Health. Hematological and clinical data of each patient included in the study are shown in Supplementary Data. Identification of the 3 species of human malaria parasites was done by nested PCR that targets variant sequences in the small subunit ribosomal RNA gene. Immunoglobin (Ig)M and IgG anti-apical-membrane-antigen-1 were measured in the plasma of malaria patients and positive reaction was observed for all subjects BT and/or AT (Supplementary Data).
Ethics Statement
These studies were performed under protocols reviewed and approved by the Ethical Committees on Human Experimentation from Centro de Pesquisas René Rachou, Fundação Oswaldo Cruz (CEP-CPqRR 24/2011). Only adults, 18 years or older, were enrolled in the study, and all patients provided written informed consent.
T-cell Immunophenotyping and Intracellular Cytokine Measurement
Peripheral blood mononuclear cells (PBMCs) were prepared from heparinized peripheral blood by Ficoll-Hypaque density gradient centrifugation (GE Healthcare Life Sciences), and cells were frozen in fetal calf serum (FCS) 20% dimethyl sulfoxide (SIGMA). PBMCs were thawed in Roswell Park Memorial Institute (RPMI) 1640 (Sigma-Aldrich) with 10% FCS and benzonase nuclease (20 U/mL; Novagen). Cells were washed in phosphate-buffered saline, incubated with Live/Dead (Invitrogen) for dead cell exclusion, and with monoclonal antibodies, washed, fixed, and permeabilized (FoxP3 staining buffer set, eBioscience) according to manufacture's instructions. Antibodies used for analyzing leukocytes are listed in Supplementary Data. Cells were acquired on an LSR-FORTESSA. For analysis, a forward scatter area (FSC-A) versus forward scatter height (FSC-H) gate was used to remove doublets, and then cells were gated in function of time versus FSC-A and combinations of fluorochromes to exclude debris and possible interference of flux interruptions. Nonviable cells were excluded using a Live/Dead gate versus CD3. T-cell subpopulations were gated on CD4+ and CD8+ events. More detailed analysis of naive and memory subpopulations were done based on CD27/CD45RO expression: effector memory (EM-CD45RO+CD27−), central memory (CM-CD45RO+CD27+), effector (Ef-CD45RO−CD27−), and naive (Nv-CD45RO−CD27+) cells. In each T-cell subset, frequencies of regulatory molecules, ICOS, Ki-67–expressing cells, and the coexpression of these molecules were evaluated. The frequencies of the regulatory molecules were also assessed in each naive and memory subpopulations. GraphPad Prism V5.0 (GraphPad software) and FlowJo V9.4.11 (TreeStar) were used for data analysis and graphic presentation.
Culture of PBMCs and P. vivax–infected Reticulocytes
PBMCs from healthy donor (HD) and P. vivax–infected patients were plated in 96-well cell culture plates at a final proportion of 1 (2.5 × 10⁵ cells) PBMC to 3 (7.5 × 10⁵ cells) P. vivax–infected reticulocytes/well. Uninfected reticulocytes and CD3 (1 µg/mL, clone HIT3a)/ CD28 (0.5 µg/mL, clone CD28.2) (BD Pharmingen) were used as negative and positive controls in RPMI 1640 (10% FCS and 100 mg/mL streptomycin, 100 U/mL penicillin). For parasite maturation, cryopreserved blood was thawed and cultured in McCoy's 5A Medium (Gibco), human AB Serum (Cellgro), and glucose (Sigma) overnight. P. vivax–infected reticulocytes were enriched with a 45% Percoll (Sigma Aldrich) gradient [31–33]. Uninfected reticulocytes were enriched with a 65% Percoll gradient followed by a Ficoll-Hypaque density gradient to remove leukocytes. To evaluate the effect of the regulatory molecules, cells were incubated with a mix of blocking antibodies, listed in Supplementary Data. Supernatants were harvested after 96 hours of culture and kept at –80°C until cytokine measurement.
Statistical Analysis
Statistical analysis was performed using GraphPad Prism V5.0. Differences were considered statistically significant when P ≤ .05. Results were analyzed using 2-tailed paired t test. Wilcoxon test was used when data did not fit a Gaussian distribution to paired samples. Representative pie charts were done using Illustrator-CC2014.
RESULTS
P. vivax Triggers the Expression of Regulatory Molecules on T Cells
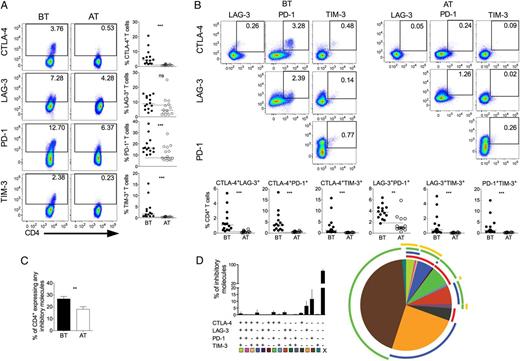
P. vivax infection triggers the expression of regulatory molecules on CD4+ T cells. PBMCs from P. vivax–infected patients were analyzed ex vivo (n = 14). A, Representative density plots showing proportion of CTLA-4, LAG-3, PD-1, and TIM-3 expressing CD4+ T lymphocytes (top to bottom) from a single P. vivax–infected patient BT (left plots) and 30–45 days AT (right plots) (left panel). Percentage of CTLA-4, LAG-3, PD-1, and TIM-3 within CD4+ T lymphocytes in P. vivax–infected patients measured BT (filled circles) and AT (open circles) (top to bottom). Dotted lines represent median values of the given measurements in HD. B, Representative density plots showing frequency of CD4+ T-cells expressing the combination of 2 of the regulatory molecules analyzed (CTLA-4, LAG-3, PD-1, and TIM-3) from a single P. vivax–infected patient BT (left plots) and AT (AT, right plots) (top panels). The proportion of CD4+ T lymphocytes from P. vivax–infected patients BT (filled circles) and AT (open circles) coexpressing any 2 of the regulatory molecules described above (bottom panels). Lines represent median values of the given measurement in each group. **.001 < P < .01 and ***P < .001. Dotted lines represent median values of the given measurements in HD. C, Coexpression of CTLA-4, LAG-3, PD-1, and TIM-3 assessed in T cells from P. vivax–infected patients. Bars indicate mean values and lines represent standard error (left panel). Pie charts represent different grouped populations according to the number of regulatory molecules coexpressed by CD4+ T cells from malaria patients. The combination of gates shows 15 distinct subpopulations. The expression of 4, 3, 2, or 1 regulatory molecule is depicted in different colors and distributed clockwise. Each pie slice represents one of these CD4+ T-cell subpopulations, and red, blue, green, and yellow arcs represent the total proportions of CD4+ T cells expressing CTLA-4, LAG-3, PD-1, and TIM-3, respectively (right panel). Abbreviations: AT, after successful antimalarial treatment; BT, before treatment; CTLA-4, cytotoxic T-lymphocyte attenuator-4; HD, healthy donor; LAG-3, lymphocyte activation gene-3; PBMCs, peripheral blood mononuclear cells; PD-1, programmed death-1; TIM-3, T-cell immunoglobulin and mucin–3.
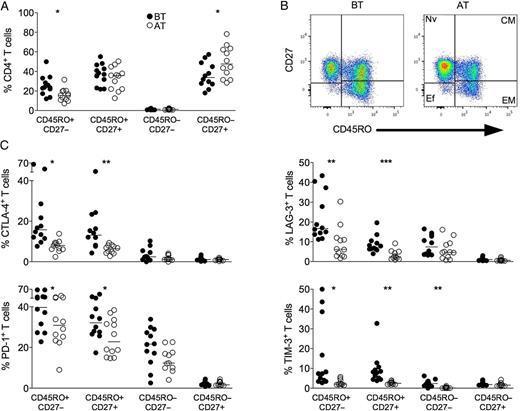
P. vivax infection triggers the expression of regulatory molecules predominately within the memory compartment of CD4+ T cells. PBMCs from P. vivax–infected patients were analyzed ex vivo (n = 12). A, The percentage of EM (CD45RO+CD27−), CM (CD45RO+CD27+), Ef (CD45RO−CD27−), and Nv (CD45RO−CD27+) cells within CD4+ T cells was measured BT (open circles) and AT (filled circles) (left panel). Representative density plots show the proportion of EM, CM, Ef, and Nv CD4+ T lymphocytes from a single P. vivax–infected patient BT (left plots) and AT (right plots) (right panel). B, Percentage of CTLA-4, LAG-3, PD-1, and TIM-3 within EM, CM, Ef, and Nv CD4+ T lymphocytes in P. vivax–infected patients measured BT (filled circles) and AT (open circles) (top to bottom). Lines represent median values of the given measurement in each group. *.01 < P < .05; **.001 < P < .01; and ***P < .001. Abbreviations: AT, after successful antimalarial treatment; BT, before treatment; CM, central memory; CTLA-4, cytotoxic T-lymphocyte attenuator-4; Ef, effector; EM, effector memory; LAG-3, lymphocyte activation gene-3; Nv, naive; PBMCs, peripheral blood mononuclear cells; PD-1, programmed death-1; TIM-3, T-cell immunoglobulin and mucin–3.
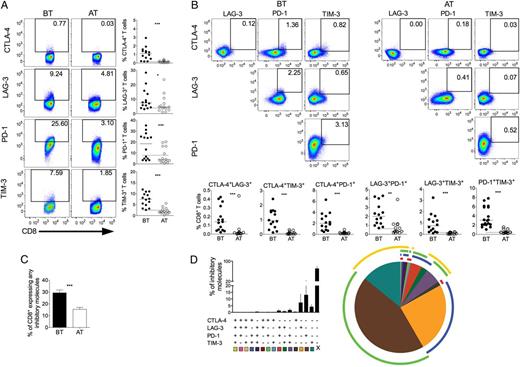
P. vivax infection triggers the expression of regulatory molecules on CD8+ T cells. PBMCs from P. vivax–infected patients were analyzed ex vivo (n = 14). A, Representative density plots showing proportion of CTLA-4, LAG-3, PD-1, and TIM-3 expressing CD8+ T lymphocytes (top to bottom) from a single P. vivax–infected patient BT (left plots) and AT (right plots) (left panel). Percentage of CTLA-4, LAG-3, PD-1, and TIM-3 within CD8+ T lymphocytes in P. vivax–infected patients measured BT (filled circles) and AT (open circles) (top to bottom). Dotted lines represent median values of the given measurements in HD. B, Representative density plots showing frequency of CD8+ T cells expressing the combination of 2 of the regulatory molecules analyzed (CTLA-4, LAG-3, PD-1, and TIM-3) from a single P. vivax–infected patient BT (left plots) and AT (right plots) (top panels). The proportion of CD8+ T lymphocytes from P. vivax–infected patients BT (filled circles) and AT (open circles) coexpressing any 2 of the regulatory molecules described above (bottom panels). Lines represent median values of the given measurement in each group. *.01 < P < .05; **.001 < P < .01; and ***P < .001. Dotted lines represent median values of the given measurements in HD. C, Coexpression of CTLA-4, LAG-3, PD-1, and TIM-3 assessed in T cells from P. vivax–infected patients. Bars indicate mean values and lines represent standard error (n = 14) (left panel). D, Pie chart represents different grouped populations according to the number of regulatory molecules coexpressed by CD8+ T- cells from malaria patients. The combination of gates shows 15 distinct subpopulations. The expression of 4, 3, 2, or 1 regulatory molecule is depicted in different colors and distributed clockwise. Each pie slice represents one of these CD8+ T-cell subpopulations, and red, blue, green, and yellow arcs represent the total proportions of CD8+ T cells expressing CTLA-4, LAG-3, PD-1, and TIM-3, respectively (right panel). Abbreviations: AT, after successful antimalarial treatment; BT, before treatment; CTLA-4, cytotoxic T-lymphocyte attenuator-4; HD, healthy donor; LAG-3, lymphocyte activation gene-3; PBMCs, peripheral blood mononuclear cells; PD-1, programmed death-1; TIM-3, T-cell immunoglobulin and mucin–3.
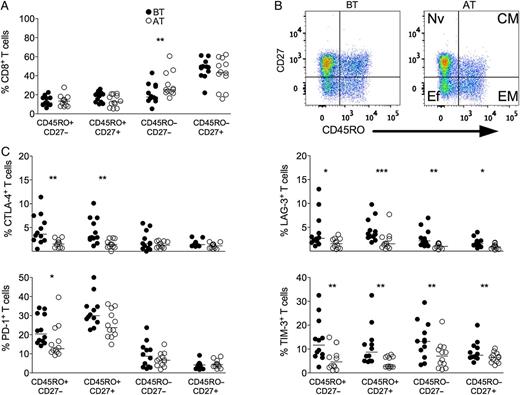
P. vivax infection triggers the expression of regulatory molecules predominately within the memory compartment of CD8+ T cells. PBMCs from P. vivax–infected patients were analyzed ex vivo (n = 12). A, The percentage of EM (CD45RO+CD27−), CM (CD45RO+CD27+), Ef (CD45RO−CD27−), and Nv (CD45RO−CD27+) cells within CD8+ T cells was measured BT (open circles) and AT (filled circles) (left panel). B, Representative density plots showing proportion of EM, CM, Ef, and Nv CD8+ T lymphocytes from a single P. vivax–infected patient BT (left plots) and AT (right plots) (right panel). C, Percentage of CTLA-4, LAG-3, PD-1, and TIM-3 within EM, CM, Ef, and Nv CD8+ T lymphocytes in P. vivax–infected patients measured BT (filled circles) and AT (open circles) (top to bottom). Lines represent median values of the given measurement in each group. *.01 < P < .05; **.001 < P < .01; and ***P < .001. Abbreviations: AT, after successful antimalarial treatment; BT, before treatment; CM, central memory; CTLA-4, cytotoxic T-lymphocyte attenuator-4; Ef, effector; EM, effector memory; LAG-3, lymphocyte activation gene-3; Nv, naive; PBMCs, peripheral blood mononuclear cells; PD-1, programmed death-1; TIM-3, T-cell immunoglobulin and mucin–3.
Pattern of Coexpression of Regulatory Molecules Is Altered During P. vivax Infection
The molecular pathways involved in T-cell regulation remain poorly understood, and reports show that this regulation can be a consequence of the coexpression of multiple regulatory molecules [35]. To further address this issue, we evaluated the expression of a unique molecule or the coexpression of several regulatory molecules on CD4+ and CD8+ T cells using a Boolean gating analysis. The percentage of T cells expressing any of the regulatory markers during malaria was 26.73% ± 2.07% (standard error of the mean) and 26.43% ± 2.40% of CD4+ and CD8+, respectively, and this proportion decreased to 10.02% ± 2.14% and 15.46% ± 1.65% AT. Frequencies of T-cell subsets expressing 4, 3, 2, or 1 of the regulatory molecules were analyzed in BT and AT patients (Figure 1C and 2C). Considering the cells that express the regulatory markers assessed in this study, 3.16%, 6.90%, and 16.11% of CD4+ T cells from patients BT coexpress respectively 4, 3, and 2 regulatory molecules. AT, the frequencies of CD4+ T cells expressing more than 1 regulatory molecule significantly decreased. In the absence of infection, 0.08%, 0.46%, and 7.56% of CD4+ T cells coexpress respectively 4, 3, and 2 molecules (Figure 1C). Despite that coexpression of regulatory molecules appeared to be less frequent in CD8+ T cells, a similar pattern was observed: 0.22%, 2.06%, and 13.54% of CD8+ T cells from BT patients coexpress respectively 4, 3, and 2 regulatory molecules. Similar to CD4+ T cells, AT, the frequencies of CD8+ T cells expressing more than 1 regulatory molecule significantly decreased: 0.01%, 0.21%, and 4.02% of CD8+ T cells coexpress respectively 4, 3, and 2 molecules (Figure 3C). Most of the CD4+ and CD8+ T cells from malaria patients express only 1 regulatory molecule BT and AT.
During P. vivax Infection a Proportion of Inhibitory Receptor Expressing T Cells Are Proliferating in Vivo and Express the Activating Receptor ICOS
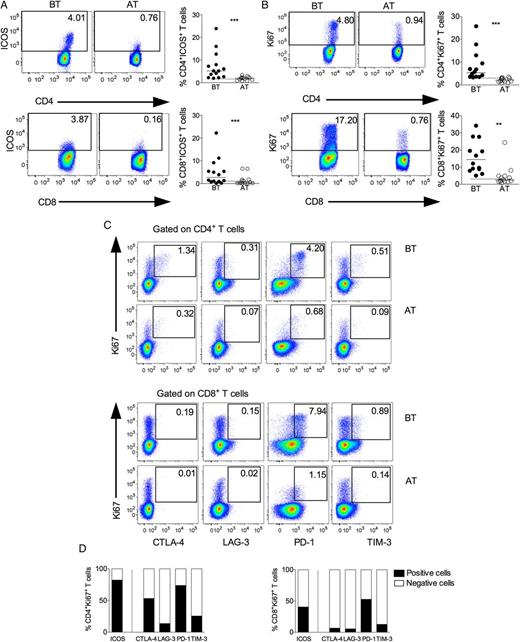
Concurrent expression of Ki-67 and regulatory receptors in T lymphocytes during vivax malaria. Representative density plots (left panel) and scattered plots (right panel) showing proportion of ICOS (A) and Ki-67 (B) expressing CD4+ (upper panel) and CD8+ (lower panel) T lymphocytes from P. vivax–infected patients BT (left panel) and AT (right panel). Flow cytometry plots represent a single patient, and circles indicate individual patients (n = 14). Lines represent median values of the given measurement in each group. **.001 < P < .01 and *** P < .001. Dotted lines represent median values of the given measurements in HD. C, Representative density plots showing proportion of Ki-67+CD4+ (upper panel) and Ki-67+CD8+ (lower panel) T cells expressing CTLA-4, LAG-3, PD-1, or TIM-3 from a single P. vivax–infected patient BT and AT. D, Proportion of cells expressing (filled bars) or not (open bars) ICOS and regulatory molecules within Ki-67+CD4+ (left) and Ki-67+CD8+ (right) T cells (n = 14). Abbreviations: AT, after successful antimalarial treatment; BT, before treatment; CTLA-4, cytotoxic T-lymphocyte attenuator-4; HD, healthy donor; ICOS, inducible costimulator; LAG-3, lymphocyte activation gene-3; PD-1, programmed death-1; TIM-3, T-cell immunoglobulin and mucin–3.
Blockade of CTLA-4, PD-1, and TIM-3 Pathways Enhances Cytokine Production During Malaria
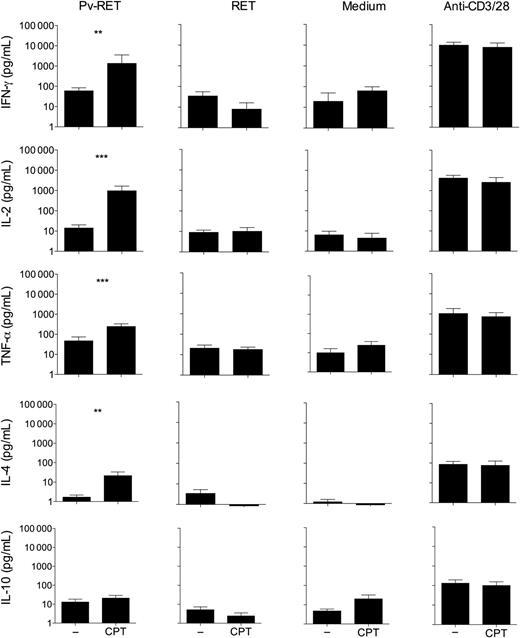
Blockage of CTLA-4, PD-1, and TIM-3 signaling during P. vivax infection enhances cytokine production. PBMCs from P. vivax–infected patients were cultured with P. vivax–infected reticulocytes (Pv-RET), uninfected reticulocytes (RET), medium alone, and anti-CD3/anti-CD28 (from left to right), in the absence (−) or presence of anti-CTLA-4 plus anti-PD-L1 plus TIM-3 blocking antibodies (CPT). Supernatant was collected after 96 hours of culture, and the levels of IFN-γ, IL-2, TNF-α, IL-4, and IL-10 were measured by cytometric bead array. Bars indicate mean values, and lines represent standard error from 12 patients pooled from 3 independent experiments (n = 12). **.001 < P < .01 and ***P < .001. Abbreviations: CTLA-4, cytotoxic T-lymphocyte attenuator-4; IFN, interferon; IL, interleukin; PBMCs, peripheral blood mononuclear cells; PD-1, programmed death-1; PD-L1, programmed death-ligand 1; TIM-3, T-cell immunoglobulin and mucin–3; TNF, tumor necrosis factor.
Taken together, our results indicate that the induction of regulatory molecules during P. vivax infection leads to impaired T-cell function, which could bring important consequences to the development of immune mechanisms dependent on T cells.
DISCUSSION
Although T-cell effector function is suggested to be crucial for protective immunity against blood-stage malaria in mice, the mechanisms of protection in humans are unclear. An increasing number of studies have been shown that regulatory molecules are involved in exhaustion of T lymphocytes during viral and bacterial infections, and more recently during experimental malaria [18, 27, 34, 38–40]. However, the role of regulatory molecules in regulating the T-cell response to P. vivax malaria had not been examined. The findings reported here demonstrate that P. vivax infection triggers the expression of molecules involved in regulation of T-cell function. Moreover, simultaneous blockage of the signaling pathway of 3 important regulatory molecules, CTLA-4, PD-1, and TIM-3, restores cytokine production upon antigen-specific stimulation.
Cytokine signaling and continuous antigen stimulation through the T-cell receptor [24, 41–45] are known to trigger the expression of the regulatory molecules assessed in this study. We correlated the levels of IL-10 and IL-6 (cytokines important during malaria) and parasite burden. Positive correlations were observed between the levels of circulating cytokines and number of DNA copies of P. vivax (Supplementary DataA), corroborating existing data. As malaria is an inflammatory disease and many of the symptoms are due to the proinflammatory mediators produced during the syndrome [46], the induction of inhibitory molecules might be an attempt to control immunopathology. However, a consequent regulation of antigen-specific functions could impair parasite control and favor subsequent infections. Indeed, along with higher parasitemia, higher proportions of CTLA-4, LAG-3, PD-1, and TIM-3 expressing T cells were found in malaria patients. It is also interesting to note a positive correlation between the expression of regulatory/activation markers on T cells and tissue damage and decreased platelet counts (Supplementary DataB and Supplementary DataC). Plasmodium infection induced the expression of regulatory molecules in both T-cell subsets, but distinct proportions of receptors expressing CD4+ and CD8+ lymphocytes were observed. For example, the expression of LAG-3 was only upregulated on CD8+ T cells.
Induction of PD-1 expression was previously described in Malian children exposed to P. falciparum. It was also shown in the experimental model of malaria that P. yoelii induces PD-1 and LAG-3 expression on CD4+ T cells and that the blockade of PD-1 ligand and LAG-3 restored T-cell function, enhanced the antibody titers, and induced a rapid clearance of blood-stage malaria in mice. More recently, higher proportions of PD-1 and/or LAG-3 expressing T cells were found in children persistently exposed to P. falciparum compared with naive children and those from an area where the levels of malaria transmission has declined, Kenya. Similarly, our data demonstrate that P. vivax exposure leads to an important increased expression of regulatory molecules on both CD4+ and CD8+ T cells.
Several studies have demonstrated that T-cell dysfunction during chronic infection is mediated by the coexpression of more than 1 inhibitory receptor [40, 47]. In this context, the majority of human immunodeficiency virus (HIV)–specific CD8+ T cells exhibit an immature phenotype and express PD-1, CD160, and 2B4 but not LAG-3, and the blockade of both PD-1 and 2B4 signaling restores CD8+ T-cell functions during infection [48]. Furthermore, a study [35] using a chronic model of lymphocytic choriomeningitis virus showed that exhausted CD8+ T cells are subject to complex layers of negative regulation resulting from the coexpression of multiple inhibitory receptors. The coexpression of multiple distinct inhibitory receptors is associated with greater T-cell exhaustion and more severe infection. Moreover, simultaneous blockade of PD-1 and LAG-3 synergistically improved T-cell responses and diminished viral load in vivo. Coexpression of 2 regulatory molecules is also observed among T cells from P. vivax–infected patients. Moreover, a significant proportion of CD4+ and CD8+ T cells from P. vivax–infected patients express 4 regulatory molecules simultaneously. Lower frequencies of regulatory molecule–expressing cells were observed after malaria cure, and the levels of expression reached that observed in HD, following the lower cytokine levels and the absence of parasitemia.
PD-1 has received attention for being a marker of exhaustion of CD8+ T cells [40], but in some situations, PD-1 expressing T cells do not display defects in effector functions [12, 41–43]. Indeed, along with the expression of the regulatory molecules, T cells from P. vivax–infected patients displayed significantly higher proportions of T cells expressing the costimulatory molecule ICOS and Ki-67. The majority of CD4+ T cells expressing Ki-67, which are able to proliferate, also express ICOS. Interestingly, most of the cells that express Ki-67 also express PD-1. The coexpression of ICOS, Ki-67, and PD-1 is seen in both T-cell subsets during acute malaria, but it is even more evident among CD4+ T cells. On the other hand, lower proportions of Ki-67+ T cells coexpress the regulatory molecules LAG-3 and TIM-3. Different pattern of expression is seen within the populations of Ki-67+CD4+ and Ki-67+CD8+ T cells. Much higher frequencies of regulatory molecules are observed in Ki-67+CD4+ T cells compared to Ki-67+CD8+ T cells. Moreover, a 3-times higher proportion of Ki-76–expressing cells are observed among CD8+ T cells when compared to CD4+ T cells.
As previously reported in other infections [26, 35, 38], the blockade of a single inhibitory receptor does not altered the production of cytokines by T cells during malaria. However, in P. vivax infection, the simultaneous blockade of CTLA-4, PD-1, and TIM-3 signaling increased IFN-γ, IL-2, TNF-α, and IL-4 production upon antigen-specific stimulation. However, a strong stimulus can overcome T-cell exhaustion during vivax malaria as previously observed in HIV infection [40]. In the murine model of malaria, the blockade of CTLA-4 or PD-1 led to cerebral malaria due to increased cytokine production triggered by P. berghei [23]. On the other hand, blockade of PD-L1 and LAG-3 cleared established blood-stage Plasmodium infection in a different model of the disease. In the latter, the protection was associated with the generation of IFN-γ+TNF-α+ and IFN-γ+IL-2+CD49dhighCD11ahighCD4+ T cells [26]. Association of more than 1 blockade was done in several models of infectious diseases and also to restore antitumor immunity [49, 50]. These data further corroborate that coexpression of regulatory molecules on T cells from P. vivax–infected patients impairs their function. However, we are aware that because our study was limited to peripheral blood, it is unclear if the same differences would be observed in other relevant tissues.
In conclusion, our study shows that P. vivax–infected patients have a higher proportion of activated and exhausted T cells. The simultaneous expression of regulatory molecules during malaria strongly indicates T-cell exhaustion, which was confirmed by the restoration of cytokine production by the CTLA-4, PD-1, and TIM-3 signaling blockade. Identification of this mechanism that is able to regulate T-cell responses during malaria provides important information on protection against Plasmodium and may provide novel insights in immunotherapy against this infection.
Notes
Acknowledgments. We are grateful to Andréa Teixeira for reviewing this manuscript, to Dr Luiz Hildebrando Pereira da Silva for supporting the development of this work in the endemic area of Porto Velho, and to the nurses for excellent technical assistance. We acknowledge the Program for Technological Development in Tools for Health–PDTIS-FIOCRUZ for the use of its facilities.
Financial support. This work was supported by Conselho Nacional de Desenvolvimento Cientifico e Tecnologico (483098/2011-6), Fundação de Amparo à Pesquisa do Estado de Minas Gerais (CBB-PPM-00426-13), the National Institute of Science and Technology for Vaccines (CNPq-573547/2008-4/FAPEMIG/MS-CBB-APQ 00077-09) and the Oswaldo Cruz Foundation (FIOCRUZ). L. R. V. A. and R. T. G. are CNPq fellows (PQ). D. L. B. was supported by the Intramural research program of the National Institutes of Health/National Institute of Allergy and Infectious Diseases (NIH/NIAID).
Potential conflict of interest. D. L. B. has patents and receives patent royalties related to programmed death-1. All other authors report no potential conflicts.
All authors have submitted the ICMJE Form for Disclosure of Potential Conflicts of Interest. Conflicts that the editors consider relevant to the content of the manuscript have been disclosed.
References

