


Abstract
The presence of Plasmodium vivax malaria parasites in the human bone marrow (BM) is still controversial. However, recent data from a clinical case and experimental infections in splenectomized nonhuman primates unequivocally demonstrated the presence of parasites in this tissue.
In the current study, we analyzed BM aspirates of 7 patients during the acute attack and 42 days after drug treatment. RNA extracted from CD71+ cell suspensions was used for sequencing and transcriptomic analysis.
We demonstrated the presence of parasites in all patients during acute infections. To provide further insights, we purified CD71+ BM cells and demonstrated dyserythropoiesis and inefficient erythropoiesis in all patients. In addition, RNA sequencing from 3 patients showed that genes related to erythroid maturation were down-regulated during acute infections, whereas immune response genes were up-regulated.
This study thus shows that during P. vivax infections, parasites are always present in the BM and that such infections induced dyserythropoiesis and ineffective erythropoiesis. Moreover, infections induce transcriptional changes associated with such altered erythropoietic response, thus highlighting the importance of this hidden niche during natural infections.
SIGNIFICANCE STATEMENT
Analysis of bone marrow aspirates from 7 patients with Plasmodium vivax malaria revealed parasites and erythropoietic defects in all of them. Global transcription identified genes related to such defects, highlighting the importance of this hidden niche during infections.
Plasmodium vivax is the most widely distributed human malaria parasite and is responsible for 7 million yearly clinical cases, including many causing severe disease or death [1]. Studies of the human bone marrow (BM) during P. vivax malaria infections are scarce, even though the presence of parasites in this tissue was first acknowledged in 1894 [2]. Moreover, sternal puncture evaluation as an alternative method for malaria diagnosis revealed parasite enrichment in the BM compared with peripheral blood [3]. Nuclear abnormalities in erythroblasts, a common feature of dyserythropoiesis, were first observed in vivax malaria [4]. In contrast, an electron microscopic study of the human BM during P. vivax attacks in anemic children revealed BM dyserythropoiesis and ineffective erythropoiesis in the absence of parasites [5]. Unequivocal evidence for the presence of parasites in the BM using molecular markers, as well as observations on BM dyserythropoiesis and ineffective erythropoiesis, however, were recently reported in a clinical case [6]. In addition, experimental P. vivax infections in splenectomized monkeys also revealed that the BM is a niche for parasites during active infections [7].
The mechanisms leading to dyserythropoiesis and ineffective erythropoiesis during malaria are not fully understood, especially for P. vivax. However, findings from studies in human patients, animal models, and in vitro studies all seem to support the idea that an inadequate erythropoietic response is due to the presence of parasites or their products during infections as well as host immune responses [8]. Synchronous in vitro differentiation of reticulocytes and erythrocytes from hematopoietic stem cells [9] offered the possibility of studying vivax infections in vitro during erythropoiesis. Using such methods, intact and lysed P. vivax–infected cells were shown to suppress erythroid development by promoting cell cycle arrest [10, 11]. Moreover, in vivo studies using Plasmodium yoelii, a murine malaria species that shares some biological features with P. vivax, showed that infected cells as well as parasite-conditioned media have been shown to induce secretion of tumor necrosis factor (TNF) in mouse macrophages [12], which in turn have been shown to suppress erythropoiesis in vitro through TNF release [13]. Clinical data indicate that erythropoietic defects are associated with the presence of the parasites in the BM, independent of anemic status or levels of circulating erythropoietin [5, 14].
The proinflammatory cytokines TNF and interferon (IFN) γ have also been shown to inhibit erythropoiesis [15, 16] by interfering in the expression of transcriptional factors controlling erythropoiesis and by with the production of erythropoietin [8]. In contrast, interleukin 10, an anti-inflammatory cytokine, has been suggested to protect surrounding cells from erythropoietic defects by regulating the expression of surface and soluble TNF receptor [17]. Of interest, hemozoin (a by-product of hemoglobin digestion produced by malaria parasites) can suppress erythropoiesis in vitro in the absence of TNF, although addition of TNF synergized with hemozoin to inhibit erythropoiesis [18]. This was confirmed in vivo for Plasmodium falciparum infections in children [19]. In vitro cultures of erythroblasts exposed to hemozoin have shown changes in cell cycle regulation, as well as down-regulation of Globin Transcription Factor 1 (GATA-1), a master transcription factor of erythropoiesis [20]. Finally, serum proteome profiles of nonanemic and anemic patients infected with P. vivax showed changes in several physiological pathways, including oxidative stress, cytoskeletal regulation, lipid metabolism, and complement cascades [21].
The data reviewed above clearly indicate that, during malaria acute attacks, parasites and products in the BM could affect normal erythropoiesis. Noticeably, most of the data have been studied in P. falciparum and have not yet been directly investigated in P. vivax. In the current study, to provide insights into alterations of the human BM during natural infections, we evaluated morphological as well as transcriptional changes in BM aspirates obtained from patients with P. vivax malaria during acute attacks and 42 days after drug treatment.
METHODS
Ethical Statements
The protocol was reviewed and approved by the Ethics Review Board of the Fundação de Medicina Tropical Heitor Vieira Dourado (PB_1.065.022/2015), where adult patients presenting with positive diagnoses of vivax malaria (microscopy) were enrolled after providing signed informed consent. All participants were treated according to recommendations for the treatment of uncomplicated P. vivax malaria from the Brazilian Ministry of Health, which included chloroquine for 3 days (600 mg/d on day 1, and 450 mg on days 2 and 3), followed by primaquine for 7 days (30 mg/d). BM punctures were performed, with use of appropriate needles, aseptic conditions, and local anesthesia, by an expert physician.
Sample Collection and Hematological Characterization
At days 0 (diagnosis visit) and 42 (convalescence visit), 4 mL of BM aspirates from iliac crest was obtained. Hematological parameters were measured using a Sysmex KX-28N hematology analyzer. The percentage of BM blood in the aspirate (BM purity) was calculated as follows: [1 ─ (total nonnucleated cells BM/total nonnucleated cells PB) × (total nucleated cells PB/total nucleated cells BM)], where PB represents peripheral blood [22].
CD71 Purification of Aspirates
CD71+ cells were enriched as described elsewhere [6]. After plasma removal, blood cells were washed twice with ice-cold incomplete Roswell Park Memorial Institute (iRPMI) 1640 medium, resuspended at 30% hematocrit and filtered through a 50-µm cell strainer. Cell suspensions were brought to 50% hematocrit and incubated with CD71 microbeads for 15 minutes at 4°C (Miltenyi Biotech). Magnetic isolation was done with LS (Miltenyi Biotech, USA) columns. Cell suspensions were loaded into a prewet column and allowed to flow. Of the recovered CD71+ pellet, 2 µL was used for a smear, 2 µL was used for staining with anti-CD71 and anti-glycophorin A (Miltenyi Biotech), to confirm purification, and the rest was resuspended in Trizol reagent and kept at ─80°C until RNA extraction. Thin smears containing CD71+ cells were stained with rapid panoptic stain to quantify erythoid cells and leukocyte contaminants with light microscopy.
Quantitative and Qualitative Analysis With Light Microscopy
Panoptic-stained thin smears containing CD71+ cells were used for dyserythropoiesis counts. The erythroid precursors were classified as basophilic, polychromatic, or orthochromatic erythroblasts. A total of 1000 red cell precursors were counted by 3 different viewers. Reticulocytes were counted in brilliant cresyl blue–stained thin smears.
Parasite Count
Malaria parasitemia was estimated using Giemsa-stained thin blood smears. A total of 10 000 enucleated red blood cells were counted, and the parasitemia was calculated as the percentage of infected red blood cell. Whole BM and whole peripheral blood were used for these counts. P. vivax monoinfection on admission and absence of parasites at convalescence were confirmed by means of quantitative polymerase chain reaction (qPCR) [23].
Total RNA Isolation
CD71+ cells were resuspended in 200 µL of Trizol reagent and kept at─80°C until RNA extraction. After thawing, the cell suspensions were vigorously homogenized by mixing with 200 µL of chloroform and incubated at room temperature for 15 minutes. The resultant mix was cold centrifuged (at 4°C and 12 000g for 15 minutes). The supernatant was mixed with isopropanol and incubated overnight. Ethanol 75% was used for RNA precipitation, and the resultant pellet was suspended in diethyl pyrocarbonate–treated water and kept at ─80°C until RNA sequencing. Aliquots were used for integrity analysis and concentration measurement with the High Sensitivity RNA ScreenTape system (Agilent Technologies). RNA quality control was performed by the translational genomics core facility at El Instituto de Investigación Germans Trias y Pujol (IGTP).
Messenger RNA Sequencing Library Construction, Sequencing, and Bioinformatic Analysis
CD71+ fractions were used for transcriptomic studies. Material from 3 patients (patients 1, 3, and15) had enough RNA quality (RNA integrity number >7) in both days 0 and 42, to generate RNA sequencing libraries using the TruSeq stranded messenger RNA kit (Illumina). Next-generation sequencing library preparation and Illumina sequencing were performed by the Genomics Unit of the Center for Genomic Regulation. Samples showed excellent sequence quality scores (score >30; approximately 250 million reads sequenced in a single lane). The quality of raw data was checked using FastQC software, version 0.11.9 (https://www.bioinformatics.babraham.ac.uk/projects/fastqc/). The reads were mapped to the human genome (Ensembl GRCh38.p10) using Bowtie 2 [24] software, version 2.3.5.1, and Samtools [25] and HTSeq-count [26] software, version 0.11.0 were used to count aligned reads. Clustering and differential expression analysis were performed using the DESeq2 software package, version 1.29. Statistical cutoffs for significant differences in gene expression were set for adjusted P values (<.05) and absolute fold change (>1.2). To identify human genes affected by P. vivax, we compared the resulting data from samples obtained from 3 patients during acute malaria infection to samples obtained during convalescence from the same 3 patients.
Functional Enrichment Analysis
Gene set enrichment analysis (GSEA) in preranked mode was performed using the GSEA tool [27] and the fast GSEA implementation of the preranked GSEA algorithm implemented in the fgsea package in R software [28]. Analyses were performed using preranked paired sample individual and average log2 fold change or the signed minus log-adjusted P value as the metric. To visualize GSEA results, we used Enrichment Map [29]. Gene ontology terms found to be enriched using the significant differentially expressed genes were visualized with the ClueGO Cytoscape plug-in [30].
Reverse-Transcription qPCR Assays to Validate Gene Expression
A set of genes related to erythropoiesis and with different patterns of expression during infection was selected to confirm expression by means of reverse-transcription qPCR. Five aliquots of messenger RNA from different patients were used to measure transcripts for genes GATA1, ALAS1, ALAS2, ARID3A, NFE, and TAL1, using as calibrator the GAPDH gene (Homo sapiens constitutively expressed gene). The qPCR assays were performed using triplicates for each sample and repeated twice for quality control. Day 42 samples were used to determine a threshold for transcript expression.
Cytometry Bead Array
Chemokines, anaphylatoxins, and cytokines in the peripheral blood and BM were measured by means of Cytometric Bead Array (BD Biosciences). Human chemokine, anaphylatoxin and T-helper (Th) 1/Th2/Th17 cytokine kits (BD Biosciences) were used, following the manufacturer’s guidelines and protocols. A FACSCanto II flow cytometer (BD Biosciences) was used for sample acquisition, and FCAP-Array software (version 3; Soft Flow) was used to calculate the levels of each molecule’s levels (in picograms per milliliter pg/mL and as the mean fluorescence intensity).
RESULTS
Presence of P. vivax Parasites in the Human BM During Acute Vivax Malaria
We confirmed P. vivax monoinfection for all patients by means of qPCR (Supplementary Table 1). Examination of peripheral blood thin smears during acute infections revealed a wide range of P. vivax parasitemia (parasite count, 299–12 792/µL) among the 7 patients included in this study. Noticeably, we observed P. vivax parasites in BM aspirates from all patients, and quantification of BM parasitemia in Giemsa-stained smears revealed overall similar parasitemia in BM and peripheral blood (Figure 1A). At microscopy, no nucleated cell was seen to be infected by P. vivax. We next attempted to characterize P. vivax stage distribution in BM aspirates compared with peripheral blood and did not observe any statistically significant difference in parasite stage distribution (Figure 1B).

Plasmodium vivax parasites in bone marrow (BM), dyserythropoiesis, and inefficient erythropoiesis during active P. vivax infections. A, Parasitemia in BM aspirates and peripheral blood (PB) on admission (day 0). Percentage of infected red blood cells (RBCs; n = 10 000 enucleated RBCs); values represent means (n = 3). B, Parasite stage distribution in BM and PB on admission (n = 200 infected RBCs) Abbreviations: G, gametocytes; mT, mature trophozoites; R, rings; S, schizonts; yT, young trophozoites. C, Dyserythropoiesis in BM aspirates on admission (day 0) compared with convalescence (day 42), shown as percentage of dyserythropoietic cells (n = 1000 erythroid cells); values represent means (n = 3). *P < .05 (paired Student t test). D, Representative images of dyserythropoietic cells. Rapid panoptic–stained BM CD71+ fraction smears showing erythroblast presenting a dysplasic nucleus (top), erythroblast presenting a budding nucleus (middle), and cytoplasmic bridge between erythroblasts (bottom). E, Comparison of dyserythropoiesis (percentage of dyserythropoietic erythroblasts) and hemoglobin levels on admission. F, Ineffective erythropoiesis in BM aspirates on admission (day 0). Polychromatic and orthochromatic erythroblasts were quantified (n = 200 erythroblasts). The ratio of orthochromatic to polychromatic erythroblasts (oEb/pEb ratio) was used as a proxy of inefficient erythropoiesis. Red line indicates effective erythropoiesis (oEb/pEb ratio approximately 2); ratios < 2 indicate a defective maturation of polychromatic into orthochromatic erythroblasts (ineffective erythropoiesis).
Dyserythropoiesis and Ineffective Erythropoiesis as Common Features in P. vivax–Infected Patients
Supplementary Table 2 summarizes essential hematological and clinical data on admission (day 0) and during convalescence (day 42) for all patients studied. Absence of parasites at day 42 was confirmed by means light microscopy (not shown) and qPCR (Supplementary Table 1). Five patients presented normal levels of hemoglobin at admission, ad 2 were mildly anemic (patients 9 and 13), with a significant change in hemoglobin levels (decrease >20%) during infection, which levels returning to normal by day 42. We used CD71-coated microbeads to purify erythroid cells from each BM aspirate. CD71 enrichment was very efficient, presenting a median yield of 88.7% (interquartile range, 73.4%–95.7%). White blood cell contamination was estimated using light microscopy (median, 2.6%; interquartile range, 1.2%–7.7%). All erythroblast stages were found after purification, and they closely mimicked the original composition of the BM aspirate (not shown). Because proportions of polychromatic and orthochromatic erythroblasts were faithfully maintained on purification, we used the CD71+ fraction to quantify dyserythropoiesis and ineffective erythropoiesis.
Interestingly, we observed dyserythropoiesis in all patients recruited, which significantly decreased after recovery from the infection (Figure 1C). Dyserythropoietic cells included erythroblasts presenting dysplasic or irregularly shaped nuclei, budding or multiple nuclei and cytoplasmic bridge between erythroblasts (Figure 1D). Nuclear abnormalities were the most common observation and were predominantly seen in polychromatic erythroblasts, as described elsewhere [5].
Dyserythropoiesis in patients with P. vivax malaria has been reported to be most marked with higher levels of anemia, although no statistical correlation was found. Similarly, we also observed a trend toward a higher dyserythropoiesis with lower hemoglobin levels, although it was not statistically significant (P = .23) (Figure 1E). Hemoglobin levels and dyserythropoiesis were not related to levels of parasitemia. This is in accordance with the finding that P. vivax can cause anemia even at low levels of parasitemia [31].
To assess ineffective erythropoiesis during P. vivax acute infection, we quantified the different erythroblast maturation stages in the BM. During healthy (effective) erythropoiesis, the proportions of proerythroblasts and basophilic, polychromatic, and orthochromatic erythroblasts are 1:2:4:8, because there is a cell duplication for each step of maturation [32]. Because orthochromatic and polychromatic erythroblasts are the most abundant cells in the BM, we used the ratio of orthochromatic to polychromatic erythroblasts to quantify ineffective erythropoiesis (Figure 1F). In normal conditions, this ratio is about 2 (effective). The ratio was <2 in all P. vivax–infected patients, suggesting that ineffective erythropoiesis is common during active P. vivax infection.
Surprisingly, we did not observe any relationship between levels of dyserythropoiesis and ineffective erythropoiesis. On the other hand, ineffective erythropoiesis was not related to parasitemia, as we observed for dyserythropoiesis. According to the stage of development of erythropoietic lineage, 66% of polychromatic and 34% of orthocromatic erythroblasts were dyserythropoietic. Proerythroblasts and basophilic erythroblasts with dyserythropoiesis signals were not found. In conclusion, although dyserythropoiesis and ineffective erythropoiesis were reported in the BM of anemic children [5] and of an anemic adult from a clinical case report [6], we found these phenomena to be a hallmark of all P. vivax infections in the BM, as they are also present in nonanemic patients.
Use of CD71 Purification of BM Aspirates in Specific Transcriptomic Studies of Erythropoiesis in Patients
CD71+ fractions were used for transcriptomic studies. Material from 3 patients [1, 5, 13] had enough RNA quality on both days 0 and day 42 to generate RNA libraries. A pipeline for bioinformatics analysis of the data is shown in Supplementary Figure 1. To identify genes related to clinical conditions, the resulting data from these 3 patients during acute malaria were compared with data from the same patients during convalescence. The overall alignment rate into the reference human genome ranged from 86.71% to 99.15%, with a mean of 26 064 genes mapped, of which 52.5% corresponded to protein coding genes. Differential expression analysis comparing samples from days 0 and 42 revealed a total of 274 genes with significantly different expression (adjusted P < .05) during acute vivax malaria compared with convalescence, most of them up-regulated. All data are freely available through the Gene Expression Omnibus NIH database repository (GSE136046).
Principal component analysis showed differential clustering of samples from days 0 and 42, indicating a distinct composition and/or expression profile for P. vivax active infection compared with convalescence (Figure 2A). Indeed, heat maps showed differential expression profiles for each patient during active infections and after drug treatment (Figure 2B). Noticeably, GSEA showed heme synthesis and chromatin silencing terms significantly enriched at day 42 and immune response terms enriched at day 0 (Figure 2C, Supplementary Figure 2, and Supplementary Table 3).
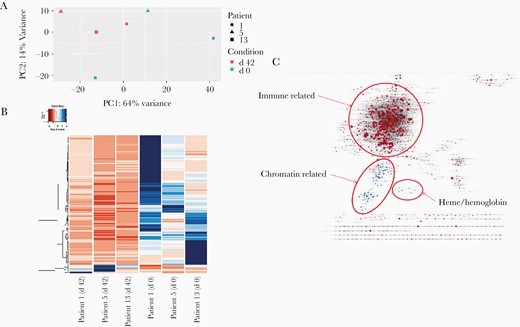
Principal component analysis, heat map, and gene set enrichment analysis (GSEA). A, Principal component analysis based on global normalized RNA sequencing gene counts by sample and condition. The day 42 sample group is in red, and the day 0 sample group in blue; patients 1, 5, and 13 are represented with a circle, a triangle, and a square, respectively. Abbreviations: PC1, principal component 1; PC2, principal component 2. B, Heat map of gene expression based on normalized mapped read counts of statistically significant (adjusted P <.05) differentially expressed genes, considering all samples (columns). C, Gene ontology enrichment map showing a network of gene ontology terms (C5 MaSigDB collection) corresponding to gene sets found significant at a false discovery rate of <0.25 on performing preranked GSEA using the signed minus log-adjusted P value as metric (signed meaning that the direction of change is kept). Red: up-regulated at 0 days, down at 42; blue: down-regulated at 0 day, up at 42.
Gene Expression Validation
We used reverse-transcription qPCR to validate the expression of the aforementioned genes on days 0 and 42 for the 3 individual patients. Figure 3A shows the down-regulation of genes related to erythropoiesis (ALAS1, ALAS2, NFE, TAL1, ARID3A, and GATA1). Figure 3B shows a trend in negative correlation between parasitemia and the expression of such genes.
![Transcriptional validation and correlation of hemozoin with inefficient erythropoiesis. A, Relative expression of erythropoietic genes in patients (patients 1, 5, and 13). Threshold level 0 was determined based on transcriptional levels at day 42. Logarithmic fold change scale is shown on the y-axis. Statistical significance was calculated using 2-way analysis of variance, with differences considered significant at P ≤ .05. *P < .05; †P < .03; ‡P < .001. B, Correlation between parasitemia and expression levels assessed with quantitative polymerase chain reaction (Delta-Delta Cycle Threshold [ΔΔCt]). For all genes, except TAL1, low expression was correlated with high parasitemia.](https://oup.silverchair-cdn.com/oup/backfile/Content_public/Journal/jid/225/7/10.1093_infdis_jiaa177/1/m_jiaa177f0003.jpeg?Expires=1750198116&Signature=HYLQ7GCys2cxs71zr9~DuhXmwUbPLo9m0u3nsi5kSdcE~2Gr3oMBj2iFWmD1Ch2yPSELtl4oiz5xMTSk45p~WLCHm-m50qHL~X0h2dJ16dAWtkAdIYUFaJyF505K1Ee0JdXbMhV-WDhQqQxbZ7R211m4m9TOm8Vpq2WMdBKzswUC4cOVDnXe-kU7hRwi7tHRPXrB2rIGq6JUcn4CMMfwkRZKL6ReGT~0k8uz46h0tASedWEp5vueRvszG3VrV6KdC0NpXfDLhzDrVRQezkAt-JOzMeqECy-aA-mHJKps-2MknbQJmAFJdhTeyp880iMuIWgUAEcrZSHr~mtJQK6oJw__&Key-Pair-Id=APKAIE5G5CRDK6RD3PGA)
Transcriptional validation and correlation of hemozoin with inefficient erythropoiesis. A, Relative expression of erythropoietic genes in patients (patients 1, 5, and 13). Threshold level 0 was determined based on transcriptional levels at day 42. Logarithmic fold change scale is shown on the y-axis. Statistical significance was calculated using 2-way analysis of variance, with differences considered significant at P ≤ .05. *P < .05; †P < .03; ‡P < .001. B, Correlation between parasitemia and expression levels assessed with quantitative polymerase chain reaction (Delta-Delta Cycle Threshold [ΔΔCt]). For all genes, except TAL1, low expression was correlated with high parasitemia.
Use Cytokine Measurement to Reveal Inflammatory BM Environment
We quantified cytokines in BM aspirates and peripheral blood plasma during acute P. vivax infection and convalescence in the 7 patients studied (Figure 4C). Although we found a small increase in TNF and IFN-γ during infection, values were almost negligible. Larger values were obtained for interleukin 17A for some samples, but no significant difference was observed between infection and convalescence, for either BM or peripheral blood. In contrast, strong signals were detected for interleukin 6 and 10, which were increased during active P. vivax infection in both BM and peripheral blood plasma, in accordance with previous reports [33, 34]. In addition to cytokines, genes involved in the complement cascade, such as the 3 C1q chains (A, B, and C) and receptors for C3a and C5, were found to be up-regulated in CD71+ cells during active P. vivax infection.
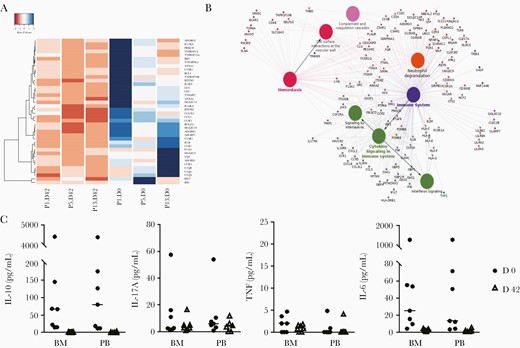
Immune-related genes and cytokine profile. A, Heat map of gene expression for innate immunity related genes based on normalized mapped read counts of statistically significant differentially expressed genes. Clustering was performed with genes in the enriched innate immunity gene ontology category (rows) for each sample (columns). Gradient colors range from red to blue, representing lower to higher expression. B, Clustering of up-regulated inflammatory genes based on gene ontology clustering (ClueGO tool). Only high-expression transcripts with significant differences (adjusted P <.05) were used. C, Comparison of cytokine levels between bone marrow (BM) aspirate and peripheral blood (PB), in both visits, measured by means of Cytometric Bead Array (n = 7). Absolute values were used for plotting and to calculate mean values for each group. Abbreviations: IL-6, interleukin 6; IL-10, interleukin 10; IL-17A, interleukin 17A; TNF, tumor necrosis factor.
DISCUSSION
In our study, 3 of the 7 patients showed 2–3-fold parasite enrichment in the BM. Thus, although parasitemia in the BM and peripheral blood are often similar, parasite enrichment in the BM can occur, as reported elsewhere [6]. To complicate matters, there is also the possibility that during aspiration, adhered cells were not analyzed. BM biopsies would solve the technical issue, but that is a more invasive and painful procedure. In fact, cases of vivax malaria where parasites have been exclusively found in this tissue have been described [35]. However, similarly to what has been described in a clinical case [6], we observed a trend toward enrichment of rings, schizonts, and gametocytes. However, owing to common low parasitemias hampering reliable differential counting, generating antibodies or identifying molecular markers specific for each parasite stage is required for confident quantification of P. vivax stages. No nucleated cell in BM was seen to be infected by P. vivax. That has been reported elsewhere in 1 patient with severe anemia [36].
One interesting group of genes that was found significantly to be down-regulated in the BM during active infection, the erythroid maturation genes, including GATA1, the major transcription factor driving erythropoiesis [37], as well as NFE, TAL1, and ARID3A, nuclear factors involved in erythroid maturation [38]. In addition, 2 enzymes involved in heme biosynthesis that are induced during erythropoiesis, ALAS-1 and ALAS-2, were also found among this group of down-regulated genes. All genes were indeed down-regulated during infections, with the exception of NFE in patient 13. Interestingly, fold changes >4 were observed for GATA-1, NFE, TAL-1, and ALAS-2 in patient 5, who was nonanemic and the patient presenting the most marked dyserythropoiesis and ineffective erythropoiesis.
Decreased expression of the enzymes ALAS-1 and ALAS-2 could be a result of the ineffective erythropoiesis observed during active infections or could be due to enrichment of polychromatic respect to orthochromatic erythroblasts in these samples. In contrast, GATA-1 has been found to be constantly and similarly expressed during erythroblast differentiation [37, 38]. Thus, different erythroblast composition due to ineffective erythropoiesis is less likely to explain substantial changes in the expression of GATA-1, suggesting that GATA-1 down-regulation is directly caused by P. vivax, in our sample. However, GATA-1 modulation has also been described for other anemic conditions, such as that caused by 3′-Azido-3′-deoxythymidine and sickle cell anemia [39, 40].
In erythroblast cultures, it has been found that hemozoin induces down-regulation of GATA-1, resulting in erythropoiesis defects [20]. Thus, we explored the relationship between parasitemia in the BM aspirates of these patients and expression levels. GATA-1, NFE, ALAS-1, and ALAS-2 seemed to be more down-regulated in those samples with higher parasitemia, although this correlation was weak (Figure 3B).
Overall, taking into account the results of published in vitro studies and our transcriptomic study, it is legitimate to speculate that P. vivax and, likely, hemozoin produced by parasites, induces GATA-1 down-regulation in the erythroid lineage, resulting in ineffective erythropoiesis in the BM. Finally, GATA-1 is also a master regulator of megakaryopoiesis and platelet production, and thrombocytopenia is also present in most active P. vivax infections [41].
Another cluster of significantly differentially expressed genes was related to the immune response. These genes were up-regulated during active P. vivax infection compared with convalescence (Figure 4A). Functional enrichment and network analyses confirmed such results (Figure 4B). The erythroblastic island, where erythropoiesis occurs, presents a specific immune microenvironment regulating erythroblast differentiation around a central macrophage; CD71+ cells are immunomodulatory and are capable of producing cytokines and chemokines [42]. TNF, as well as its receptors TNF receptor superfamily 1A, 10A, and 10B, were found up-regulated during active P. vivax infection. TNF inhibits erythropoiesis through several proposed mechanisms, including blockage of GATA-1 transcriptional activity. Several genes induced by TNF, as well as IFN-γ, were also found to be up-regulated during active P. vivax infection and are pathways related to erythropoiesis inhibition and apoptosis.
Complement activation could thus lead to phagocytosis of these cells, contributing to ineffective erythropoiesis. Moreover, annexin A2 and A5, which serve as ligands for C1q on apoptotic cells [43], were also found to be up-regulated during infection. Overall, these results suggest that the inflammatory microenvironment regulating erythroblast development could be profoundly disturbed by the inflammatory response to active P. vivax infection, leading to apoptosis and phagocytosis of erythroblasts.
In summary, during active vivax malaria infections, parasites are always found in the BM and induce dyserythropoiesis and ineffective erythropoiesis, independent of patients’ anemic status. Such defects are related to transcriptional changes affecting immune-related genes as well as erythropoietic-related genes, which were seemingly orchestrated by GATA-1 down-regulation. The question thus remains why P. vivax has chosen CD71+ reticulocytes, mostly found in the BM, as a host cell while actively inducing erythropoietic defects during infection.
Our group has postulated that P. vivax infections also induce spleen remodeling facilitating adherence of infected reticulocytes to the spleen [44], and this postulation has received support from 2 clinical cases of spleen rupture [45, 46]. Thus, in addition to the BM, the spleen seems another niche rich in reticulocytes where the parasites can multiply. In fact, formation of hematopoietic niches and extraxmedullary erythropoiesis in the spleen is prevalent in benign clinical hematological disorders [47], and in other infections innate immune activation initiates extramedullary hematopoiesis [48]. Further investigations on the BM as a new parasite niche, and its link to anemia and splenomegaly are warranted. Studies in asymptomatic population infected with this parasite are also relevant and must be pursued, to elucidate the consequences of chronic infection and what happens in niches such as BM.
Data presented herein should be considered as pioneering but preliminary analysis of erythropoiesis in a few patients with P. vivax malaria, in whom BM aspirates were made possible. The major question that still persists is the specificity of such findings to P. vivax infection or to a more general inflammatory systemic disease.
Supplementary Data
Supplementary materials are available at The Journal of Infectious Diseases online. Consisting of data provided by the authors to benefit the reader, the posted materials are not copyedited and are the sole responsibility of the authors, so questions or comments should be addressed to the corresponding author.
Notes
Acknowledgments. We thank all patients and healthy donors that participated in these studies. We thank the El Instituto de Investigación Germans Trias y Pujol (IGTP) Cytometry Unit for fluorescence-activated cell sorting services, IGTP Translational Genomics Unit for RNA quality control services, and IGTP High Content Genomics and Bioinformatics (and Susanna Aussó) for their contribution to RNA sequencing data quality control, differential gene expression, and functional genomic analyses. We thank the Center for Genomic Regulation’s Genomics Unit for next-generation sequencing services. ISGlobal and IGTP are members of the CERCA Programme, Generalitat de Catalunya.
Author contributions. Conception and coordination of study: H. A. d. P. and M. V. G. L.
Performance of experiments: M. A. M. B., B. B., A. A. H., K. D., E. F. G. F., A. G. C., A. C. G. A., B. W. H., E. V. D. P., and C. F. B. Data analysis: M. A. M. B., B. B., A. A. H., K. D., M. d. P. A., E. V. D. P., C. F. B., WM, H. A. d. P., and M. V. G. L. Bioinformatic analysis: T. C. R. and L. S. Obtaining of bone marrow aspirates: I. P. S. and M. V. G. L. Drafting of manuscript: M. A. M. B., B. B., K. D., T. C. R., and H. A. d. P. All authors read and approved the content of the manuscript.
Financial support. This work was supported by Coordenação de Aperfeiçoamento de Pessoal de Nível Superior (grant 71/2013 and Science Without Borders fellowships to M. A. M. B. and K. D.); Fundação de Amparo à Pesquisa do Estado do Amazonas (grant PRONEM 009/2011, ProAM-Estado fellowship to B. B., and funding for M. V. G. L.’s laboratory); the Sao Paulo Research Foundation (B. W. H. and E. V. D. P.); CNPq (fellowships to W. M. M., E. V. D. P., and M. V. G. L. and funding for M. V. G. L.’s laboratory); the Brazilian Ministry of Health (funding for M. V. G. L.’s laboratory); and the Ministerio Español de Economía y Competitividad (grant SAF2016-80655-R to the laboratory of C. F. B. and H. A. d. P.).
Potential conflicts of interest. All authors: No reported conflicts. All authors have submitted the ICMJE Form for Disclosure of Potential Conflicts of Interest. Conflicts that the editors consider relevant to the content of the manuscript have been disclosed.
References
Author notes
M. A. M. B. and B. B. contributed equally to this work.

