


Abstract
Background. It is unknown whether neuronal injury begins during acute human immunodeficiency virus (HIV) infection, and whether immediate initiation of combination antiretroviral therapy (cART) prevents neuronal injury.
Methods. Cerebrospinal fluid (CSF) neurofilament light chain (NFL), a measure of axonal injury, was assessed before and after cART initiation in individuals starting treatment during acute or chronic HIV infection. Nonparametric statistics examined relationships between NFL and disease progression, neuroinflammation, and cognitive performance.
Results. Before treatment, subjects with acute infection had lower CSF NFL levels, with elevations for their age in 1 of 32 subjects with acute infection (3.1%) and 10 of 32 with chronic infection (31%) (P = .006). This persisted after cART initiation, with 1 of 25 acute (4%) and 4 of 9 chronic subjects (44%) showing elevated NFL levels (P = .01). In acute infection, pre-cART NFL levels were inversely correlated with proton magnetic resonance spectroscopic findings of N-acetylaspartate/creatine in frontal gray matter (r = −0.40; P = .03), frontal white matter (r = −0.46; P = .01), and parietal gray matter (r = −0.47; P = .01); correlations persisted after treatment in the frontal white matter (r = −0.51; P = .02) and parietal gray matter (r = −0.46; P = .04).
Conclusions. CSF NFL levels are not elevated in untreated acute HIV infection or after 6 months of immediately initiated cART but are abnormal in chronic HIV infection before and after treatment. In acute HIV infection, CSF NFL levels are inversely associated with neuroimaging markers of neuronal health.
Human immunodeficiency virus (HIV) type 1 RNA has been detected in the cerebrospinal fluid (CSF) of infected individuals as early as 8 days after estimated exposure [1]. Long-term central nervous system (CNS) HIV infection is associated with cognitive impairment, termed HIV-associated neurocognitive disorder (HAND), even in the setting of suppressive combination antiretroviral therapy (cART) [2, 3]. It is not known how early during the course of infection perturbations associated with HIV in the CNS lead to neuronal injury or whether very early initiation of cART may prevent such injury and HAND.
Recent studies have used CSF biomarkers to identify neuronal injury within the CNS. These include the light subunit of the neurofilament protein (NFL), a structural component of myelinated axons responsible for maintenance of axonal caliber and integrity [4, 5]. Elevated levels of NFL in the CSF are characteristic of normal aging and neurodegenerative disorders such as Alzheimer disease [6, 7] but have also been demonstrated in HIV-associated dementia (HAD) [8, 9], in neurologically asymptomatic chronic HIV infection [3, 9], and in a subset of subjects with primary HIV infection at a median of 3 months after transmission [9, 10]. Elevated CSF NFL levels are associated with concomitant elevations in markers of neuroinflammation [3, 6, 7, 9, 10], and although antiretroviral treatment reduces CSF NFL levels [11], elevations may persist, even in the setting of effective cART [3, 12].
Despite a growing understanding of the CNS events occurring months to years after HIV transmission, the time course of neuroinflammation and neuronal injury in the earliest stages of infection remains incompletely understood. However, such knowledge could inform recommendations for the timing of cART initiation among those without immunosuppression. In this study, we investigated whether neuronal injury, measured according to CSF NFL levels, is present in the first weeks after viral transmission and whether early cART initiation is associated with normal levels of this marker during short-term follow-up.
METHODS
Study Design and Participants
Study participants were derived from 3 separate studies of Thai individuals enrolled into studies at the Southeast Asia Research Collaboration with Hawaii (SEARCH) research program in Bangkok, Thailand. All subjects were >18 years old and without a history of medical or neuropsychological comorbid conditions, including head trauma, active illicit drug use, AIDS-defining opportunistic infections, stroke, autoimmune disease (eg, multiple sclerosis), hepatitis C, or syphilis. Individuals with a history of controlled depression or minor depressive symptoms were enrolled, but those with active or uncontrolled psychiatric abnormalities were excluded.
Participants in RV254/SEARCH 010 (NCT 00796146) had acute HIV infection, defined by either positive nucleic acid testing results (NAT) with nonreactive HIV immunoglobulin M–sensitive immunoassay (IA) or reactive HIV immunoglobulin M–sensitive IA with indeterminate Western blot, as described elsewhere [13]. In all, 3564 and 46 288 individuals were screened with IA and NAT, respectively. Forty subjects screened with IA (1.1%) were HIV infected, of whom 37 (93%) were enrolled. Forty subjects screened with NAT (0.09%) were HIV infected, of whom 33 (83%) were enrolled. Subjects joined the protocol within a mean of 2 days of identification, and a subset consented to optional CNS procedures, including lumbar puncture (LP) and proton magnetic resonance spectroscopy (MRS). Of 70 subjects enrolled, 32 (46%) underwent initial assessment with LP and proton MRS, and a subset underwent follow-up clinical assessments 24 and 96 weeks after cART initiation. Twenty subjects (63%) underwent CSF sampling at baseline and 24-week follow-up, 7 (22%) underwent only baseline CSF sampling, and 5 (16%) did not undergo baseline CSF sampling but agreed to undergo LP at 24-week follow-up.
Participants in SEARCH 011 (NCT 00782808) were chronically infected and antiretroviral therapy naive but met Thai Ministry of Public Health guidelines for treatment initiation (CD4 T-lymphocyte count <350 cells/µL or symptomatic disease), as described elsewhere [14]. Of 80 individuals screened for participation in the chronic infection cohort, 60 (75%) met inclusion criteria. Of these, 32 (53%) agreed to baseline CSF sampling and were included in the current study. All subjects started cART immediately after baseline assessment. A subset (8 of 32; 25%) were reassessed at 48 weeks. One subject (11%) who underwent LP at 48 weeks had not undergone CSF sampling at baseline. Finally, 18 cognitively normal HIV-uninfected Thai control subjects between 18 and 50 years of age were enrolled into RV304/SEARCH 013 and completed one-time proton MRS and LP.
All subjects provided written informed consent. The Chulalongkorn Hospital Institutional Review Board approved all protocols, and approvals or waivers were obtained from institutional review boards or their equivalent at each of the collaborating institutions.
Antiretroviral Treatment
Subjects in SEARCH 010 and 011 initiated cART immediately after baseline assessment. Subjects in SEARCH 010 started standard nonnucleoside reverse-transcriptase inhibitor–based cART (typically efavirenz, tenofovir, and emtricitabine) or the same regimen intensified with raltegravir and maraviroc. One subject who declined treatment was excluded. SEARCH 011 subjects started nonnucleoside reverse-transcriptase inhibitor–based cART (efavirenz or nevirapine) that included an nucleoside reverse-transcriptase inhibitor backbone of lamivudine, zidovudine, tenofovir, or stavudine. One subject, an exception, started protease inhibitor-based cART. Subjects received phone calls approximately every 3 months to encourage adherence. Although adherence is not explicitly addressed in this analysis, plasma and CSF viral load information was available at all time points.
Specimen Sampling, Processing, and Laboratory Analysis
We performed LP in accordance with standard sterile procedures, collecting approximately 10 mL of CSF at each time point. Levels of CSF HIV RNA were measured using the Roche Amplicor kit (version 1.5), as described elsewhere, with lower limits of detection of 50 copies/mL in plasma and 100 copies/mL in CSF owing to sample dilution [14]. CSF cell counts and glucose and protein levels were quantified using fresh samples at the time of collection. The remaining cell-free CSF was stored within 6 hours of collection at −80°C. The CSF NFL levels were measured using a highly sensitive, 2-site enzymatic quantitative IA with a lower limit of detection of 50 ng/L (Uman Diagnostics). The age-specific upper limits of normal for white subjects at the laboratory have been reported elsewhere [3]. Blood and CSF neopterin, CSF chemokine (CXC motif) ligand 10 (CXCL10)/interferon γ–induced protein 10 (IP-10), and CSF chemokine (CC motif) ligand 2 (CCL2)/monocyte chemotactic protein 1 (MCP-1) were quantified using commercially available assays [1].
Proton MRS
Participants underwent proton MRS performed with GE Signa 1.5-T images at Chulalongkorn University Hospital, as described elsewhere [1, 15]. Single-voxel proton MRS was performed with a volume head coil for signal detection, with localized double spin-echo (PRESS) hydrogen 1 MRS in the frontal white matter, posterior cingulate gyrus gray matter, frontal white matter, and basal ganglia, using the automated PROBE-P (proton brain examination) sequence with 8-cm3 voxels. MRS data were analyzed by 1 author (N. S.) using the spectral analysis package LCModel (version 6.2; http://s-provencher.com/pages/lcmodel.shtml). Metabolites included N-acetylaspartate (NAA), a marker of neuronal health; high-choline containing metabolites, representing cellular membranes and thus cellular infiltration and inflammation; metabolites high in myo-inositol, a marker of astrocytosis and gliosis; and glutamate + glutamine, reflecting neuronal cell function. These were selected based on their associations with HIV-related brain injury [2, 16–18] and measured with respect to creatine (Cr).
Neuropsychological Testing
A trained nurse-psychometrist performed neuropsychological testing. For SEARCH 010, participants completed an abridged 4-test battery including the Grooved Pegboard (fine motor function, manual dexterity), Color Trails 1 and Trail Making A (psychomotor speed), and Color Trails 2 (cognitive flexibility, executive function) tests. Scores were normalized to nearly 500 HIV-uninfected Thai subjects from equivalent age and educational strata to calculate z scores and a composite NPZ-4 score, the average of individual z scores [5, 19]. For SEARCH 011 participants, HAND status was determined based on neuropsychological testing and clinical criteria by the investigators in a consensus conference using the 2007 Frascati criteria as a guide [20]. The details of these methods have been described elsewhere [14].
Statistical Methods
The primary end points for the main portion of the study were the CSF NFL values before and after cART initiation. Analyses used the Mann–Whitney U test and the Kruskal–Wallis test with post-hoc testing corrected with Dunn multiple comparison. Because normal values of CSF NFL increase with age, subjects were stratified to identify CSF NFL elevations compared with the published upper limit of normal for their age group [3, 9], and χ2 statistics were used to compare proportions within each group. Nonparametric correlations between measured parameters used Spearman rank correlation coefficients; linear regression was also conducted for illustrative purposes. Analyses were performed with SPSS (version 19.0) and GraphPad Prism (version 5.0d) software.
RESULTS
Baseline Characteristics of Participants
Subjects with acute infection tended to be younger, and a higher proportion of them were male subjects (Table 1). Within each group and across all subjects, CSF NFL levels did not correlate with CD4 T-lymphocyte counts. Median log-transformed plasma HIV RNA levels were higher in the acute infection group; however, the median log-transformed CSF HIV RNA levels did not differ between groups, nor did median baseline CSF protein. The median CSF white blood cell count was higher in the chronic infection group, and CSF neopterin levels were elevated in both groups compared with Thai controls (P < .001). Table 1 compares CXCL10/IP-10, CCL2/MCP-1, and interleukin 6 (IL-6) levels between the acute and chronic infection groups; taken together, these results suggest neuroinflammation in both HIV-infected groups, with more evident cellular measures of inflammation in chronic infection.
Baseline Characteristics of Study Participantsa
| Characteristic | Acute HIV Infection (n = 32) | Chronic HIV Infection (n = 32) | HIV-Uninfected Controls (n = 18) | P Value (Acute vs Chronic)b |
|---|---|---|---|---|
| Demographic characteristics | ||||
| Age, y | 29 (24–37) | 34 (28.5–36.5) | 33 (27–39) | .10 |
| Male sex, % | 94 | 41 | 50 | <.001 |
| Duration of infectionc | 18 d (13–24 d) | 3.7 y (0.9–6.5 y) | … | … |
| Typical cART regimen | NNRTI-based cART ± raltegravir/maraviroc | NNRTI-based cART | … | … |
| Plasma values | ||||
| HIV RNA, log10 copies/mL | 5.5 (4.9–6.3) | 4.7 (4.4–5.2) | … | .002 |
| CD4 T-lymphocytes, cells/µL | 401 (318–568) | 232 (160–351) | … | <.001 |
| CSF values | ||||
| HIV RNA, log10 copies/mL | 3.5 (2.8–4.5) | 4.1 (3.7–5.2) | … | .09 |
| Protein, mg/dL | 31.5 (25.5–36) | 33 (28–43) | 27.5 (24.5–38.5) | .33 |
| WBCs, cells/µL | 0 (0–3) | 4 (2–9) | 0 (0–0) | .002 |
| Neopterin, nmol/L | 7.7 (4.7–13.4) | 9.4 (7.1–13.8) | 2.6 (1.9–2.9) | .34 |
| CCL2/MCP-1, pg/mL | 465 (341–1171) | 522 (406–1001) | 331 (236–405) | .59 |
| CXCL10/IP-10, pg/mL | 539 (229–748) | 834 (591–1025) | 174 (89–293) | <.001 |
| IL-6, pg/mL | 4.3 (4.3–8.2) | 6.4 (6.4–6.5) | 4.3 (4.3–4.3) | .24 |
Abbreviations: cART, combination antiretroviral therapy; CCL2, chemokine (CC motif) ligand 2; CSF, cerebrospinal fluid; CXCL10, chemokine (CXC motif) ligand 10; HIV, human immunodeficiency virus; IL-6, interleukin 6; IP-10, interferon γ–induced protein 10; MCP-1, monocyte chemotactic protein 1; NNRTI, nonnucleoside reverse-transcriptase inhibitor; WBCs, white blood cells.
a Values represent medians (interquartile ranges) unless otherwise specified.
bP values determined with Mann–Whitney U test.
c For acute infection, this duration represents time since exposure; for chronic infection, participant's estimation of the time since diagnosis, subject to recall bias.
Individuals in the acute infection group were stratified by Fiebig stage [3, 21]; 11 of 32 subjects were stage I (35.5%), 2 were stage II (6.25%), 15 (46.9%) were stage III, 1 (3.1%) was stage IV, and 3 (9.4%) were stage V. Although subjects in the acute infection group underwent a brief neuropsychological testing battery that was insufficient to classify HAND, none had severe neurologic signs or symptoms on detailed neurologic evaluation at baseline. In the chronic infection group, 18 of 32 subjects (56.2%) were cognitively normal, 6 (18.8%) had asymptomatic neurocognitive impairment, 4 (12.5%) had mild neurocognitive disorder (MND), and 4 (12.5%) had HAD.
Before cART initiation, the chronic infection group had higher median CSF NFL levels than the acute infection cohort (Figure 1A; P = .004). Ten of the 32 subjects (31%) in the chronic infection group and 1 of the 32 (3.1%) in the acute infection group had CSF NFL levels above the upper limit of normal for their age in white subjects (Figure 2A; P = .006). Among HIV-uninfected Thai controls, 2 of 18 had CSF NFL levels above the upper limit of normal for their age in white subjects (Figure 2C); both were <30 years old. A greater proportion of subjects with chronic infection had CSF NFL levels elevated for their age, compared with Thai HIV-uninfected controls (P = .03); there was no difference between the proportions of Thai HIV-uninfected controls and acutely infected subjects with elevated CSF NFL levels (P = .60).
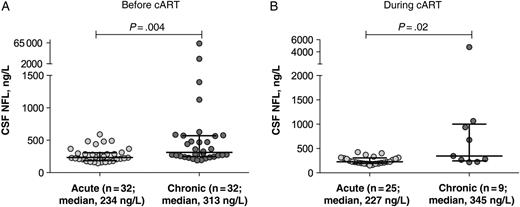
Cerebrospinal fluid (CSF) neurofilament light chain (NFL) levels in acute and chronic human immunodeficiency virus infection cohorts at baseline before treatment (A) and at follow-up time points during treatment (B). Horizontal lines represent medians and interquartile ranges. Abbreviation: cART, combination antiretroviral therapy.
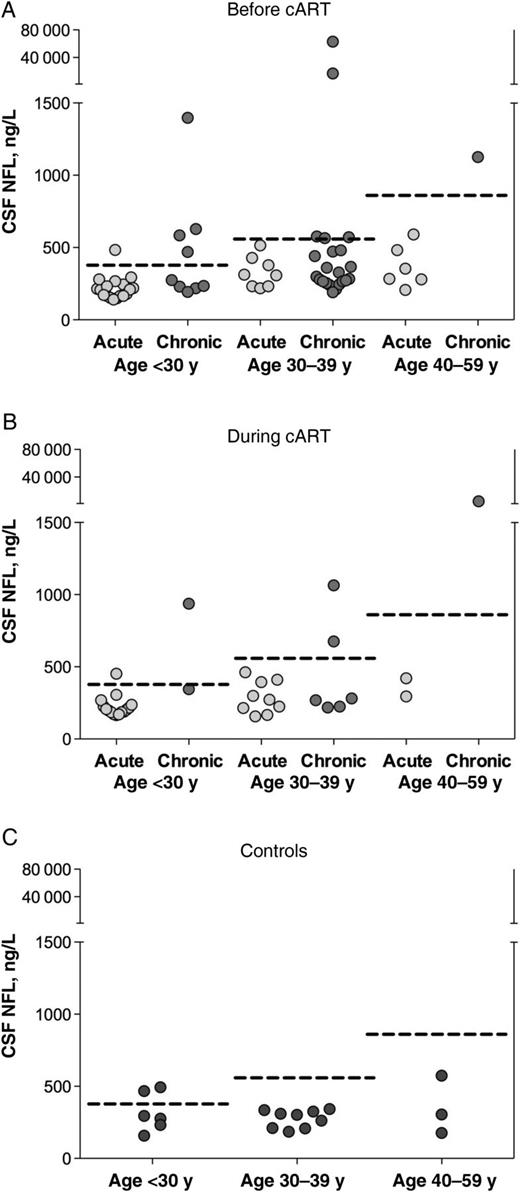
Cerebrospinal fluid (CSF) neurofilament light chain (NFL) levels in subjects with acute or chronic human immunodeficiency virus infection and controls, stratified by age group. Dotted lines represent age-specific upper limits of normal CSF NFL values for each age stratum; points above dotted lines represent individuals with CSF NFL levels elevated for their respective age group. A, Baseline CSF NFL levels before treatment compared with age-specific upper limit of normal for participants aged <30, 30–39, or 40–59 years; 1 of 32 subjects in the acute and 10 of 32 in the chronic infection group had levels above the upper limit of normal for their age (P = .006). B, Follow-up CSF NFL levels at 24 weeks of treatment in the acutely infected cohort and 48 weeks of treatment in the chronically infected cohort; 1 of 25 subjects in the acute and 4 of 9 in the chronic infection group had levels above the upper limit of normal for their age (P = .01). C, CSF NFL levels in control subjects; 2 of 18 controls had elevations relative to the upper limit of normal for their age. Abbreviation: cART, combination antiretroviral therapy.
Characteristics of Study Subjects at Follow-up
At 24-week follow-up in the acute cohort, all participants had a decline in plasma and CSF viral loads. Two of the 25 with acute infection had plasma viral loads above the lower limit of detection (64 and 74 copies/mL; lower limit of detection for assay, 50 copies/mL), but all had CSF HIV RNA levels below the lower limit of detection (100 copies/mL). At 48-week follow-up in the chronic infection cohort, all subjects had plasma suppression; 1 had <50 copies/mL in plasma but 400 copies/mL in the CSF.
Comparison of CSF NFL levels after 24 weeks of cART in the acute infection and 48 weeks in the chronic infection group showed persistent differences (Figure 1B; P = .02). When stratified by age, 1 of the 25 subjects with acute infection (4%) and 4 of the 9 with chronic infection (44%) for whom follow-up CSF findings were available had elevations above the upper limit of normal for their age (Figure 2B; P = .01). At 96-week follow-up, none of the subjects with acute infection for whom follow-up CSF findings were available (n = 14) had CSF NFL levels that were elevated for their age (although the single subject with an elevated level at 24 weeks did not have the level checked at 96 weeks).
Of the 20 subjects in the acute cohort for whom serial NFL data were available at baseline and 24 weeks of therapy, 1 (5%) had elevated NFL levels for their age at both time points, and 19 (95%) had normal levels for their age at both time points. No subjects with normal CSF NFL levels at baseline had abnormal levels for their age after initiating treatment.
Of the 8 subjects in the chronic infection cohort for whom serial NFL data were available at baseline and 48 weeks of therapy, 3 (37.5%) had elevated NFL levels for their age at both time points, 4 (50%) had normal levels for their age at both time points, and 1 (12.5%) had normalization of the CSF NFL level after initiating treatment. No subjects with normal CSF NFL levels at baseline had abnormal levels for their age after initiating treatment.
Correlates of CSF NFL Levels
In the acute infection cohort, there were no correlations between CSF NFL and neuroinflammatory markers, including neopterin (Figure 3A and 3B), CXCL10/IP-10, CCL2/MCP-1, or IL-6 at baseline or either follow-up time point. In the chronic infection cohort, there was a correlation with CSF neopterin at both the baseline time point (r = 0.37; P = .04) (Figure 3C) and 48 weeks after treatment initiation (r = 0.68; P = .050) (Figure 3D) but no associations with CSF CXCL10/IP-10, CCL2/MCP-1, or IL-6.

Relationship between cerebrospinal fluid (CSF) neurofilament light chain (NFL) and CSF neopterin at baseline and follow-up time points. A, C, Relationship at baseline (before treatment) in the acute (A) and the chronic (C) human immunodeficiency virus infection cohorts. B, D, Relationship at 24 weeks of treatment in the acute infection cohort (B) and at 48 weeks of treatment in the chronic infection cohort (D). Statistical analysis represents Spearman correlation. Abbreviation: cART, combination antiretroviral therapy.
Among subjects with acute infection, pretreatment CSF NFL levels were inversely correlated with NAA/Cr ratios in the frontal white matter (r = −0.46; P = .01), frontal gray matter (r = −0.40; P = .04), and parietal gray matter (r = −0.47; P = .01) (Figure 4A–D). At 24 weeks after treatment initiation, CSF NFL levels were still correlated with NAA/Cr ratios in the frontal white matter (r = −0.51; P = .02) and parietal gray matter (r = −0.46; P = .04) and were also correlated with NAA/Cr ratios in the basal ganglia (r = −0.47; P = .03) (Figure 4E–H). At 96 weeks after initiation of cART, there were no significant correlations between CSF NFL and any MRS metabolites in the 14 subjects for whom data were available.
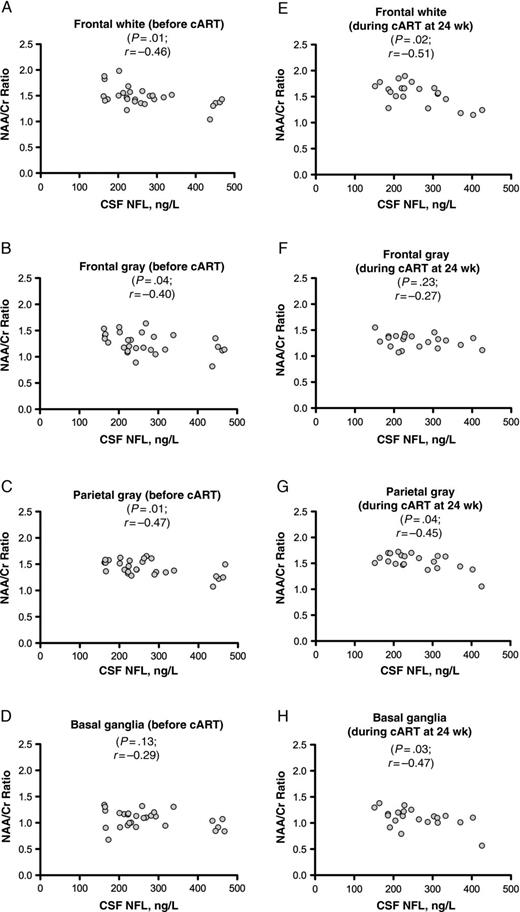
Relationship between cerebrospinal fluid (CSF) neurofilament light chain (NFL) and the proton magnetic resonance spectroscopy–derived N-acetylaspartate (NAA)/creatine (Cr) ratio, a marker of neuronal health, in the acute human immunodeficiency virus infection cohort. A–D, Relationship at baseline (before treatment). E–H, Relationship after 24 weeks of treatment in the same subjects. There were no correlations between CSF NFL levels and NAA/Cr ratios after 96 weeks of treatment in the acute infection group, nor were there any in the chronically infected group (both not shown). Statistical analysis represents Spearman correlation. Abbreviation: cART, combination antiretroviral therapy.
In the chronic infection cohort, baseline CSF NFL levels were inversely correlated with frontal white matter glutamate + glutamine/Cr (r = −0.37; P = .04). We detected no correlations at 48 weeks after treatment initiation in the 8 subjects with follow-up CSF samples.
Correlations With Neuropsychological Testing Results
In participants with acute HIV, there was a trend toward an inverse association between CSF NFL level and performance on the Color Trails 1 test at enrollment (r = −0.38; P = .06). This correlation was not noted after 24 (r = −0.27; P = .20) or 96 weeks of treatment (r = −0.14; P = .66). There were no correlations with Color Trails 2, Grooved Pegboard, Trail Making A, or composite NPZ-4 scores at any study interval. There were also no correlations between CSF NFL level and neuropsychological testing results in the chronic infection group at either time point, nor were CSF NFL levels correlated with HAND status. Specifically, in this sample, subjects with HAND were not more likely to have elevated CSF NFL levels for their age (comparison of proportions, P = .69). This remained the case when subjects with symptomatic HAND (MND or HAD) were compared with the rest of the cohort (comparison of proportions, P = .85).
DISCUSSION
This study showed that CSF NFL levels are not elevated in acute HIV infection, suggesting that neuronal injury occurs later in the disease course. This stands in contrast to findings in chronically infected subjects, who are more likely to have elevated CSF NFL levels for their age. Neuronal injury may develop in a subset of individuals sometime after the acute period but early in primary HIV infection [9, 10]. The lack of CSF NFL elevation in acute infection may be related to a low magnitude and duration of neuroinflammation at this early point, as suggested by lower CSF white blood cell counts and neopterin levels compared with those reported in primary HIV infection [10]. Although it is also possible that the acute HIV subjects in our study had a lower incidence of CNS involvement than individuals enrolled in prior studies, CSF HIV RNA levels were detectable (>100 copies/mL) in 26 of 32 subjects (82%) before treatment, suggesting HIV entry into the CNS. Thus, it is more plausible that levels of CNS inflammation—and thus, neuronal injury—are minimal at this early time point and increase as the infection goes untreated, consistent with prior observations [22].
Normal CSF NFL levels were maintained after 24 and 96 weeks of suppressive cART initiated during the acute period. Subjects starting therapy in later infection were more likely to have elevated pretreatment CSF NFL levels, and a higher proportion of them had elevated CSF NFL levels after 48 weeks of treatment. Thus, initiation of cART in acute compared with chronic HIV infection is associated with lower levels of neuronal injury at follow-up intervals. We note that our subjects were virologically controlled and that 56% in the acute cohort were treated with 5-drug regimens, whereas the chronic cohort received standard cART. It should also be noted that no subjects in either group had an interval development of abnormal CSF NFL levels with treatment. Because it has been suggested that CSF NFL levels are predictive of the development of HAND [3, 8, 12], these data support the argument that cART is neuroprotective. Moreover, in some cases, neuronal injury may resolve or improve with therapy.
There were no correlations between CD4 T-lymphocyte counts and CSF NFL levels, suggesting that NFL is not simply a function of CD4 T-lymphocyte count but rather may be related to exposure of the brain to HIV and subsequent inflammation; this may differ from findings in chronic infection, in which progressive systemic disease as demonstrated by falling CD4 T-lymphocyte count is associated with rising CSF NFL levels [3, 23]. It is possible that as untreated HIV infection persists during the early stages, an increasing level of neuroinflammation reaches a threshold that initiates neuronal injury weeks to months after exposure [11, 22]. Optimally, longitudinal follow-up of individuals identified but not treated during acute infection would confirm this model, but such a study is unlikely given increasing support for early and continuous treatment at the time of first HIV diagnosis.
Overall, although we found few correlations between CSF NFL and markers of disease progression and inflammation, those that did exist were consistent with findings reported elsewhere. CSF NFL levels did not correlate with either plasma or CSF HIV RNA levels or with CD4 T-lymphocyte count or estimated duration of infection in the acute group, nor did they correlate with CSF markers of neuroinflammation. Still, as expected, there was a marked total decrease in CSF neopterin levels after initiation of cART. Our findings of a modest association between CSF NFL and neopterin levels at both time points in the chronic infection cohort are consistent with findings reported elsewhere [3, 10, 13] and suggest that neuroinflammation is a substantial contributor to axonal injury. The association with neopterin is supportive of a monocyte-related injury mechanism during chronic infection, as has been described by others [4, 14].
In the acute infection cohort, we found an inverse association between CSF NFL levels and proton MRS NAA/Cr ratio, a marker of neuronal and glial health, in the 4 brain regions assessed; this persisted after treatment at week 24. This is consistent with data reported elsewhere in subjects with primary HIV infection [10, 14], and in animal models [24, 25]. The disappearance of these associations at 96 weeks after cART initiation suggests resolution of injury, although our study may have been underpowered to detect this relationship.
Levels of CSF NFL have been shown elsewhere to be elevated in those with advanced neurologic disease [1, 9]. Our study did not detect elevated baseline levels of NFL in chronic infection subjects with MND or HAD compared with those who were cognitively normal or had asymptomatic HAND, but it was probably underpowered to identify this association. It is therefore not possible to draw conclusions about the relationship between CSF NFL levels and the extent of neurologic impairment in this population.
Although the suggestion of an inverse correlation with Color Trails 1 performance in the acute infection group is potentially interesting, this isolated finding should be interpreted with substantial caution, given our small sample in which other neuropsychological measures were not associated with NFL. A 2014 study suggested a correlation between NFL levels and results of the Trail Making A test, another test of processing speed [26], and earlier findings suggested that CSF NFL levels may be related to abnormalities in executive functioning, particularly in early HIV infection [10]. The relationship between CSF biomarkers of neuronal injury and neuropsychological testing abnormalities warrants continued evaluation.
Limitations
This study is limited by its relatively small sample size and the proportion of individuals lacking complete longitudinal CSF data. Although a high percentage of eligible participants in both groups were enrolled, the initial screening may have resulted in a selection bias toward identifying less disabled or lower-risk subjects. Subject attrition between baseline and follow-up sampling, especially in the chronic infection group, could have resulted in unintentional biases as well. We attempted to remain restrained in our statistical analyses and to investigate relationships of interest based on evidence reported elsewhere. Our control cohort was not optimally matched to either study cohort but does provide some basis for comparison with regard to HIV uninfected Thai subjects, whose CSF NFL levels were consistent with those in a white population from which the upper limits of normal for the NFL assay were determined.
Implications
To our knowledge, this is the first study examining CSF NFL as a marker of neuronal injury in acute HIV infection. Previous studies have shown CSF NFL elevations in a subset of individuals with primary infection, at a median of 3 months after transmission [9, 10, 22]. Our current study suggests that neuronal injury does not begin during acute infection but is initiated at some point thereafter, presumably after several months of processes, including immune activation, which underlie HIV-related neuropathogenesis. Moreover, neuronal injury does not seem to develop in individuals who begin treatment immediately after contracting HIV infection, whereas initiation of cART at a later time point in those who have been chronically infected may partially mitigate neuronal injury but does not necessarily result in the normalization of CSF NFL levels. These findings may provide further rationale for identifying HIV-infected individuals as early as possible in the course of disease and initiating antiretroviral therapy at the time of diagnosis.
Notes
Acknowledgments. We thank the research participants. We also thank Collin Adams and Akash Desai for their administrative support and Victor DeGruttola for his statistical input and for editing the manuscript. The study team is grateful to the contribution of the staff at The Thai Red Cross AIDS Research Centre and the Department of Retrovirology, US Army Medical Component, Armed Forces Research Institute of Medical Sciences.
The RV254/Southeast Asia Research Collaboration with Hawaii (SEARCH) 010 Study Group includes Nittaya Phanuphak, Nipat Teeratakulpisarn, Eugene Kroon, Donn Colby, Duanghathai Sutthichom, Somprartthana Rattanamanee, Peeriya Mangyu, Sasiwimol Ubolyam, Pacharin Eamyoung, Suwanna Puttamaswin, Somporn Tipsuk, and Putthachard Sangtawan from SEARCH/TRCARC/HIV-NAT; Mantana Pothisri from Chulalongkorn University; Robert O’ Connell, Rapee Trichavaroj, Siriwat Akapirat, Bessara Nuntapinit, Nantana Tantibul, Hathairat Savadsuk, and Vatcharain Assawadarachai from the Armed Forces Research Institute of Medical Sciences; Nelson Michael, Jerome Kim, Merlin Robb, Linda Jagodzinski, Shelly Krebs, Silvia Kim, and Sodsai Tovanabutra from the US Military HIV Research Program; and Laura Napolitano, Molly Martell, and Yolanda Lie from Monogram Biosciences.
Disclaimer. The views expressed are those of the authors and should not be construed to represent the positions of the US Army or the Department of Defense.
Financial support. This work was supported by the National Institute of Mental Health, National Institutes of Health (grants R01MH095613, R01NS061696, and R21MH086341), The Sahlgrenska Academy at the University of Gothenburg (grant ALFGBG-11067), the Swedish Research Council (grant K2011-58P-20931-01), and the US Military HIV Research Program. Antiretrovirals were generously provided by the Thai Government Pharmaceutical Company, Gilead, Merck, and ViiV Healthcare.
Potential conflicts of interest. J. A. has received honoraria from ViiV Healthcare and Gilead. M. G. has received research grants from Abbott/AbbVie, Baxter, Bristol-Myers Squibb, Gilead Sciences, GlaxoSmithKline, Merck, and Tibotec/Janssen and honoraria as a speaker and/or advisor from Abbott/AbbVie, Boehringer-Ingelheim, Bristol-Myers Squibb, Gilead Sciences, GlaxoSmithKline, Janssen-Cilag, and Merck. S. S. has received travel support and an honorarium from AbbVie. All other authors report no potential conflicts.
All authors have submitted the ICMJE Form for Disclosure of Potential Conflicts of Interest. Conflicts that the editors consider relevant to the content of the manuscript have been disclosed.
References
Author notes
Presented in part: 2014 Conference on Retroviruses and Opportunistic Infections, Boston, Massachusetts, 3–6 March 2014.
See the list of team members in acknowledgments.

