


Abstract
Background. Mass screening and treatment currently fails to identify a considerable fraction of low parasite density infections, while mass treatment exposes many uninfected individuals to antimalarial drugs. Here we test a hybrid approach to screen a sentinel population to identify clusters of subpatent infections in the Kenya highlands with low, heterogeneous malaria transmission.
Methods. Two thousand eighty-two inhabitants were screened for parasitemia by nested polymerase chain reaction (nPCR). Children aged ≤15 years and febrile adults were also tested for malaria by rapid diagnostic test (RDT) and served as sentinel members to identify subpatent infections within the household. All parasitemic individuals were assessed for multiplicity of infections by nPCR and gametocyte carriage by nucleic acid sequence–based amplification.
Results. Households with RDT-positive individuals in the sentinel population were more likely to have nPCR-positive individuals (odds ratio: 1.71, 95% confidence interval, 1.60–1.84). The sentinel population identified 64.5% (locality range: 31.6%–81.2%) of nPCR-positive households and 77.3% (locality range: 24.2%–91.0%) of nPCR-positive individuals. The sensitivity of the sentinel screening approach was positively associated with transmission intensity (P = .037).
Conclusions. In this low endemic area, a focal screening approach with RDTs prior to the high transmission season was able to identify the majority of the subpatent parasite reservoirs.
Heterogeneity of infectious agents, including malaria, is apparent at all spatial scales and levels of transmission intensity, although it is most pronounced where transmission is low [1, 2]. Across all levels of transmission intensity, a substantial proportion of malaria infections are asymptomatic and often present at densities below the threshold for detection by microscopy or rapid diagnostic tests (RDTs) [3–7]. While not associated with (acute) clinical symptoms, a proportion of these infections may progress to clinical disease [8] and can also produce gametocytes and thereby contribute to onward malaria transmission [2, 9, 10]. It has been argued that for programs to sustainably reduce or eliminate malaria transmission, the asymptomatic and subpatent reservoir must be detected and targeted [7, 9, 11, 12]. The detectability of malaria infections in malaria-endemic countries is related to malaria parasite density that is associated with acquired malaria immunity [13–15]. Consequently, infections are most likely to be detected by microscopy or RDTs in children and in symptomatic infections, while asymptomatic adults are more likely to carry infections at subpatent densities [4, 15, 16].
There are 2 commonly advocated approaches to include asymptomatic malaria-infected individuals in treatment campaigns: mass screening and treatment (MSAT) and mass drug administration (MDA). MSAT campaigns typically test all individuals, using either RDT or microscopy, and treat individuals that test positive [17]. The success of MSAT campaigns is greatly influenced by the sensitivity of the diagnostic. In low-transmission settings in particular, a considerable proportion of infections is missed during MSAT campaigns because many infections are present at densities below the detection limit of the diagnostic methods commonly used [10, 18, 19]. Onward malaria transmission from these subpatent infections was considered the most plausible explanation for a recent failure of RDT-based MSAT campaigns to sustainably reduce malaria transmission in the pre-elimination setting of Zanzibar [7].
Community-based MDA campaigns avoid the problem of imperfect diagnostics by treating without prior diagnosis. However, MDA in low-endemic settings would administer medication to individuals whom are not infected with malaria nor will have any benefits of the prophylactic effect of drugs due to the low exposure [20, 21]. Based on the limited success of MDA approaches under research conditions and the risk of increasing drug pressure that is associated with the spread of drug-resistant strains of parasites [20, 22], the use of MDA in malaria has received limited support [1, 21], Alternative strategies are required that are capable of targeting the entirety of the parasite population while being operationally feasible in malaria-endemic communities.
Malaria infections are known to cluster at the household level and it has been shown that asymptomatic parasite carriers are more likely to reside in households when a symptomatic case occurs in the same household [17, 23–25], For example, in Zambia, it was found that prevalence of malaria in households with a symptomatic case was 8.0% compared to <1.0% in households without a symptomatic case [25]. Similarly in Senegal, it was found the risk of being parasite positive was more than 3 times higher when residing in a household with a symptomatic case [24]. This suggests that a hybrid approach in which focal MDA is guided by the occurrence of positive (index) cases detected by screening of a sentinel population may represent an efficient method of maximizing the number of infections treated while limiting the total number of antimalarials distributed and thereby drug pressure [12, 17, 22]. We aimed to determine the potential of this approach and identify the most appropriate definition of a sentinel population that balances the number of individuals screened against the proportion of the parasite reservoir identified and to ascertain factors associated with its sensitivity.
METHODS
Study Area
This study was undertaken in a previously described study site in Rachuonyo South District, western Kenyan highlands (34.75 to 34.95°E, 0.41 to 0.52°S) with elevation between 1400 and 1600 m [26]. The landscape is intersected with rivers and rolling hills and is characterized by marked variations in elevation within a small area [27]. Malaria transmission intensity is generally low with a mean polymerase chain reaction (PCR) prevalence of 20% (equivalent to 6% prevalence by microscopy [4]) but is highly heterogeneous [28]. Plasmodium falciparum is the predominant malaria parasite, and transmission follows a bimodal pattern associated with the peaks in rainfall, which typically occur between April and June (long rainy season) and between October and December (short rainy season). Five areas within this 100 km2 area with evidence of ongoing malaria transmission [27] were selected for the current study (Figure 1).
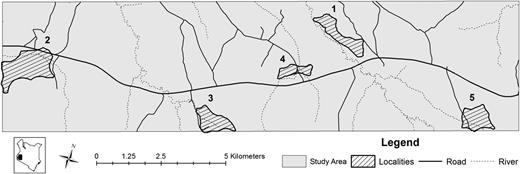
Map of study area showing the main roads (black lines) and rivers (dotted lines). The five selected localities where this survey occurred are shown.
Ethical Review and Approval
The study was approved by the ethical committees of the London School of Hygiene and Tropical Medicine (Ref: LSHTM 5956) and the Kenya Medical Research Institute (Ref: SSC 2163 and SSC 2495). Individual informed consent was sought from all eligible participants. Consent for children under the age of 18 was provided by a parent/guardian and children between 14 and 17 years also provided written assent. Participants below 18 years of age who were pregnant, married, or a parent were considered “mature minors” and consented for themselves [29].
Data Collection
All residents were enumerated and households were assigned spatial coordinates with handheld global positioning system receivers (Garmin 62S; Garmin International, Inc, Olathe, KS). In March 2012, prior to the main malaria transmission season [27], all households were visited and information obtained on standard malaria indicators and socioeconomic factors. Tympanic temperature was measured (Braun Thermoscan, Braun); those with a temperature >37.5°C were considered febrile. All individuals between 6 months and 15 years as well as febrile adults were tested for malaria infections using an RDT (First Response, Premier Medical Corporation Ltd, Kachigam, India). This definition of the sentinel population was based on previous evidence that these groups have the highest proportion of infections with detectable parasite densities [4, 15, 30] and are also most accessible for testing. All RDT-positive cases were provided treatment according to national guidelines. Blood spotted on filter paper (Whatmann 3MM, Maidstone, UK) was collected from all consenting participants ≥6 month of age and stored at room temperature. For gametocyte detection, 100 μL of whole blood in nucleic acid stabilizer (Angora buffer, Avantor Performance Materials, Deventer, the Netherlands) was collected from all individuals in 3 of the 5 localities and stored for up to 1 week at −20°C and subsequently at −80°C.
Laboratory Analysis
Filter paper samples were analyzed for malaria infection using nested polymerase chain reaction (nPCR) targeting the P. falciparum 18S ribosomal RNA gene [31, 32] after Chelex-saponin extraction [31]. All nPCR-positive samples were tested for the presence of multiple clonal infections based on the merozoite surface protein-2 (MSP2) using capillary electrophoresis; [33] samples were analyzed with Peak Scanner (version 1.0, Applied Biosystems, California), and unique clones were determined to be any discrete peaks greater than the background noise for each plate. For the 3 localities where whole blood samples were collected, total nucleic acids were extracted for all nPCR-positive samples using the MagNA Pure LC Total Nucleic Acid Isolation Kit (Roche, Switzerland) on an automated extractor (MagnaNA Pure LC 2.0). The presence of gametocytes was determined by detection of gametocyte-specific PfS25 messenger RNA by nucleic acid sequence–based amplification [34].
Statistical Analyses
The sensitivity and specificity of different sentinel definitions were determined at the household level (ie, the proportion of all households with nPCR-detected infections that was correctly identified) and at the individual level (ie, the proportion of all individuals with nPCR-detected infections that was correctly identified). Five sentinel populations for RDT screening were defined: (1) all household occupants ≤5 years, (2) all occupants ≤15 years, (3) all occupants ≤5 years and any febrile individual in other age groups. (4) all occupants ≤15 years and any febrile individual in other age groups, and (5) only febrile individuals. If at least 1 individual in this sentinel population was found to be parasitemic by RDT, the household was considered “infection positive” (ie, there was evidence for the presence of infections and all household members would therefore be eligible for interventions such as focal mass treatment). In addition, the sensitivity of a sixth approach was determined in which RDTs were not used but all household members were considered infection positive if there was ≥1 febrile household member.
Analysis was conducted using STATA (v12.0, STATA Corp, Texas) and R (v. 3.0.2, The R Foundation, Boston, Massachusetts). Principal component analysis was used to determine socioeconomic status for each household, and resulting scores were divided into quintiles [35]. Buffer zones of 50, 100, and 250 m around each household were calculated using ArcGIS (v. 10.2, ESRI, California). The mean number of allelic types present in each infected individual was determined and corresponding 95% confidence intervals (CIs) were calculated assuming a zero-truncated Poisson distribution. Logistic regression was used to assess associations with RDT positivity in the nPCR-positive sentinel population, adjusting for clustering within localities using the svyset command with cluster as the strata. Factors assessed include gender, age, self-reported fever in the past 24 hours, sleeping under a bednet the previous night, travel within the past 3 months, presence of eaves on the house, socioeconomic status quintile, elevation, current temperature, complexity of infection, and hemoglobin levels, as well as self-reported use of antipyretic and use of antimalarial drugs. The final adjusted model was determined using a backward stepwise process, retaining all variables where P < .05. A finite population correction factor was applied to the standard error for all statistics and the corrected 95% CIs were calculated.
RESULTS
In total, 2082 of 2310 eligible individuals were sampled in 401 households (locality range [range]: 233–635), representing 94.2% (range: 90.8%–100.0%) of all households or 89.6% (range: 87.9%–93.3%) of all eligible individuals (Table 1). Eligible individuals consist of those who regularly sleep in the compound and are older than 6 months of age. There was no significant difference in age, proportion of females, or reported recent travel between the localities. Bednet use the previous night was reported by 71.5% of participants (range: 53.4%–77.4%). Overall, 1203 individuals were screened for malaria by RDT based on their age (≤15 years, n = 1158) or febrile status (n = 45) and 24.9% (95% CI, 24.3%–25.5%; range: 6.7%–48.6%) were RDT positive.
Population Demographics
| Mean | Locality Range | |
|---|---|---|
| Population characteristics | ||
| Households sampled (%) | 94.2 | 90.8–100.0 |
| N eligible | 2310 | 272–646 |
| N sampled | 2082 | 233–635 |
| Sex (% male) | 45.3 | 43.1–47.3 |
| Reported net use | 71.5 | 53.4–77.4 |
| Parasite metric | ||
| nPCR prevalence | 23.5 | 11.7–38.9 |
| <5 | 17.3 | 9.8–32.1 |
| 5–15 | 35.3 | 14.0–59.5 |
| >15 | 16.4 | 8.2–25.5 |
| MSP2–MOIa | 2.22 | 1.61–2.61 |
| <5 | 2.24 | 1.33–2.60 |
| 5–15 | 2.34 | 1.54–2.81 |
| >15 | 1.95 | 1.72–2.23 |
Demographics of the study population, including the number of people sampled overall, the range of values per locality and for parasite metrics, the 95% confidence interval was computed.
Abbreviations: MOI, multiplicity of infection; MSP2, merozoite surface protein-2; nPCR, nested polymerase chain reaction.
a N = 489 nPCR positive.
Of all participants, 23.5% (95% CI, 23.1–24.0, range: 11.7–38.9) were parasitemic by nPCR, the mean number of allelic forms per infection (multiplicity of infection [MOI]) was 2.22 (95% CI, 2.18–2.25, range 1.61–2.61) and 65.0% (n = 249; range: 64.0%–84.6%) of the 383 nPCR-positive individuals tested harbored gametocytes. Parasite prevalence (35.6%, 95% CI, 34.8–36.4 vs 12.3%; 95% CI, 11.7%–12.9%; P < .001) and MOI (2.33, 95% CI, 2.28–2.38 vs 1.95, 95% CI, 1.86–2.04; P < .001) were significantly higher in the 5 to 15-year-old population compared to those 16 years of age and older, respectively. Parasite prevalence in 5 to 15-year-olds was also significantly higher compared to those <5 years (17.3%, 95% CI, 16.3%–18.2%; P < .001) but MOI was not significantly different (2.24, 95% CI, 2.21–2.34; P = .105). For individuals tested by RDT, MOI was significantly greater in patent infections (2.48, 95% CI, 2.42–2.53) compared to subpatent infections (1.95, 95% CI, 1.87–2.02; P < .001). Of all nPCR-positive children ≤15 years old, 29.9% (95% CI, 28.7%–31.1%) had subpatent infections.
Identifying Parasite-Positive Households Through Sentinel Populations
Overall, 42.4% of the 401 households surveyed had no infections and there were 8 households (2.0%) where all members were nPCR positive (Supplementary DataA). Individuals who were RDT negative or not screened by RDT were significantly more likely to be nPCR positive if there was a RDT-positive individual in their household (odds ratio: 1.71, 95% CI, 1.60–1.84); the odds of being nPCR positive increased with the number of RDT-positive individuals within a household (Supplementary Data). Of the 6 definitions of sentinel population, testing those ≤15 years or febrile adults achieved the highest sensitivity and specificity for detecting the parasite reservoir (Table 2): at the household level, sensitivity was 64.5% (range: 31.6–81.2) with a specificity of 90.6% (range: 82.3–94.9); at the individual level, sensitivity was 77.3% (range: 24.2–91.0) and specificity was 55.7% (range: 31.3–85.1) (Table 2).
Sensitivity and Specificity of Sentinel Populations to Detect the Parasitemic Reservoir
| Definition of Sentinel Population | RDT Test ≤5 yr | RDT Test ≤15 yr | RDT Test ≤5 yr and Any Febrile Cases | RDT Test ≤15 yr and Any Febrile Cases | RDT Test Febrile Cases | No RDT, Febrile Cases | ||||||
|---|---|---|---|---|---|---|---|---|---|---|---|---|
| % | Range | % | Range | % | Range | % | Range | % | Range | % | Range | |
| Household level | ||||||||||||
| Sensitivity | 26.0 | 10.5–36.5 | 64.1 | 31.6–80.0 | 28.1 | 10.5–41.2 | 64.5 | 31.6–81.2 | 6.5 | 0–10.6 | 13.8 | 5.3–15.0 |
| Specificity | 95.3 | 93.9–97.4 | 90.6 | 82.3–97.4 | 95.3 | 93.9–97.4 | 90.6 | 82.3–94.9 | 99.4 | 97.4–100.0 | 91.8 | 87.2–95.8 |
| Individual level | ||||||||||||
| Sensitivity | 39.1 | 9.1–51.3 | 76.9 | 24.2–90.1 | 41.7 | 9.1–56.3 | 77.3 | 24.2–91.0 | 10.4 | 0–13.9 | 18.0 | 12.1–20.5 |
| Specificity | 81.3 | 71.3–93.9 | 55.8 | 31.6–85.1 | 81.8 | 71.4–93.9 | 55.7 | 31.3–85.1 | 95.1 | 91.9–98.3 | 86.0 | 81.1–90.7 |
The sensitivity and specificity of different sentinel populations at the household level (ie, the proportion of all households with nPCR-detected infections that was correctly identified) and at the individual level (ie, the proportion of all individuals with nPCR-detected infections that was correctly identified). All household occupants in the sentinel population were screened and all household members were considered infection positive if 1 individual in the sentinel population recorded a positive result (either RDT or fever). The approach with the highest sensitivity is indicated in bold.
Abbreviations: nPCR, nested polymerase chain reaction; RDT, rapid diagnostic test.
Correctly and incorrectly classified households appeared evenly distributed throughout the area with little variation between the best (locality 1) (Figure 2A) and worst-performing locality (locality 5) (Figure 2B). Because 82 households with 244 nPCR-parasite-positive individuals were not identified as infection positive, we determined the impact of extending the focal treatment response to include buffer areas around RDT-positive sentinel cases on sensitivity and specificity. Based on the 94.2% of eligible compounds sampled, the median distance for households that were incorrectly classified as parasite-free (parasite-positive individuals by nPCR but not by RDT in the sentinel population) from the closest household with an RDT-positive sentinel case was 85.1 m (interquartile range [IQR]: 56.9–147.3 m). The addition of buffer zones around targeted households improved the sensitivity, but the specificity was greatly reduced beyond 50 m and the addition of a 150 m buffer resulted in the inclusion of nearly every household as infection positive, thereby resulting in an approach similar to MDA if this definition was used to target antimalarial drugs (Supplementary Data).
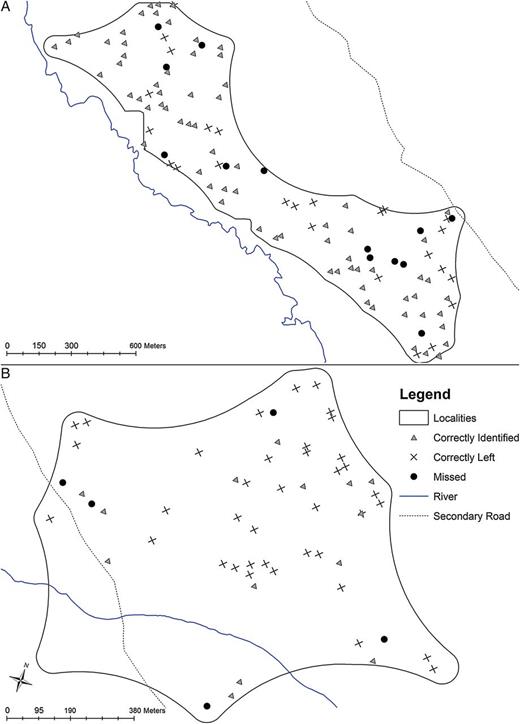
Maps of focal screening and treatment (FSAT) sensitivity. Locality with the highest (A) and lowest (B) proportion of the parasite reservoir identified using the FSAT approach. Dots represent each household screened as part of this study, including those households that had nPCR-positive individuals but were missed by the best definition of sentinel population (black circle), those that were correctly identified as infection positive (gray triangle) and those that were correctly classified as infection negative (black cross). Abbreviation: nPCR, nested polymerase chain reaction.
Factors Associated With Parasite Carriers Being Correctly Identified Versus Missed
The number of RDT-positive individuals in the sentinel population ranged between 1 and 12 per household, and larger households were more likely to have RDT-positive cases (P < .001). In the 165 households with RDT-positive individuals, 52.1% had 1 and 31.5% had 2 RDT-positive individuals. The majority of RDT-positive individuals were under 15 years old (96.7%), but the age ranged from 6 months to 82 years (Supplementary DataB). Of the households with a single index case, the median age of the RDT-positive individual was 13 (range: 6 months to 82 years). Overall, PCR prevalence (35.0%, 95% CI, 34.3%–35.6% vs 11.1%, 95% CI, 10.7%–11.6%; P < .001) and MOI (2.35, 95% CI, 2.31–2.40 vs 1.76, 95% CI, 1.71–1.81; P < .001) was higher in correctly identified compared to missed households, respectively. Sensitivity of the screening approach was associated with the average nPCR parasite prevalence in the locality and with the proportion of infections in the sentinel population that were subpatent but was not associated with mean altitude, or the demographic indicators tested, including the proportion of households in the lowest socioeconomic status quintile and the proportion of people in the sentinel population (Table 3).
Locality-Level Factors Associated With Screening Approach Sensitivity
| Locality | 1 | 2 | 3 | 4 | 5 | P Value |
|---|---|---|---|---|---|---|
| N households | 109 | 120 | 73 | 42 | 57 | … |
| N individuals Sampled | 571 | 635 | 365 | 233 | 278 | … |
| Sensitivity, nPCR | ||||||
| Household | 81.2 | 66.1 | 55.0 | 44.0 | 31.6 | … |
| Individual | 91.0 | 76.2 | 69.9 | 61.5 | 24.2 | … |
| Parasite metrics | ||||||
| nPCR prevalence (95% CI) | 38.9 (38.0–39.9) | 19.4 (18.6–20.1) | 20.0 (19.1–21.0) | 16.8 (15.6–18.0) | 11.7 (10.8–12.6) | .037 |
| Estimated microscopy parasite prevalence [4] (95% CI)a | 16.5 (13.6–20.0) | 6.1 (4.6–7.9) | 6.3 (4.6–8.7) | 5.0 (3.3–7.5) | 3.2 (2.0–5.0) | … |
| Subpatent infections in sentinel population (%)b | 39.2 (37.6–40.7) | 48.4 (46.2–50.5 | 65.7 (63.1–68.4) | 59.0 (55.2–62.7) | 81.8 (78.6–85.0) | .037 |
| MOI (95% CI) | 2.61 (2.55–2.67) | 1.89 (1.83–1.96) | 1.88 (1.79–1.96) | 2.32 (2.20–2.45) | 1.61 (1.51–1.72) | .188 |
| Demographic indicators | ||||||
| Mean altitude (range) | 1449.0 (1417–1478) | 1422.8 (1396–1443) | 1495.9 (1458–1518) | 1465.1 (1447–1477) | 1535.2 (1512–1560) | .104 |
| Economic status, % in lowest SES quintile | 19.1 | 12.6 | 14.7 | 18.2 | 23.5 | .505 |
| Age, % ≤15 yr | 54.5 | 57.7 | 54.2 | 57.9 | 53.5 | .391 |
| Fever, % febrile individuals | 2.6 | 2.4 | 2.5 | 1.7 | 2.5 | .492 |
Parasite and demographic data per locality ordered by the sensitivity at household/individual level for the optimum definition of sentinel population (testing those ≤15 years and febrile adults).
Abbreviations: CI, confidence interval; MOI, multiplicity of infection; nPCR, nested polymerase chain reaction; RDT, rapid diagnostic test; SES, socioeconomic status.
a Microscopy parasite prevalence was estimated based on nPCR data based on a published mathematical model to illustrate transmission intensity in the different localities; statistical testing was not performed because this was a derived variable.
b nPCR-positive infections that were RDT negative.
In the households where parasite carriers were missed due to no RDT-positive test result, 43.5% (95% CI, 47.5%–51.7% range: 25.0–73.3) of nPCR-positive individuals were ≤15 years of age (Figure 3), indicating subpatent parasite carriage in the sentinel population. The odds of individuals in the sentinel population being correctly identified increased if they reported fever in the past 24 hours (adjusted odds ratio [AOR] 1.56, 95% CI, 1.25–1.95), had higher temperature (AOR 1.81 [per °C], 95 CI, 1.58–2.07), and had a greater number of parasite clones (AOR: 1.26 [per clone], 95% CI, 1.16–1.37) (Table 4); whereas females (AOR: 0.73, 95% CI, .57–.92) and those reporting having taken antimalarial drugs in the 2 weeks prior to the survey (AOR: 0.69, 95% CI, .53–.90) were more likely to have a subpatent infection and therefore be missed.
Individual Factors With RDT-positivity in nPCR-positive Individuals
| Univariate | Adjusted | |||||
|---|---|---|---|---|---|---|
| OR | 95% CI | P Value | AOR | 95% CI | P Value | |
| Gender | ||||||
| Male | 1.0 | … | … | 1.0 | … | … |
| Female | 1.06 | .99–1.13 | .095 | 0.73 | .57–.92 | .008 |
| Age, years | 1.06 | 1.05–1.07 | <.001 | |||
| Fever in preceding 24 h | 1.66 | 1.52–1.82 | <.001 | 1.56 | 1.25–1.95 | <.001 |
| Travel outside district in past 3 mo | 0.67 | .56–.79 | <.001 | |||
| Bednet use previous night | 0.89 | .82–.96 | .005 | 2.31 | 1.86–2.87 | <.001 |
| Open eaves | 1.88 | 1.62–2.19 | <.001 | 1.82 | 1.33–2.49 | <.001 |
| SES | ||||||
| 1 | 1.0 | … | … | |||
| 2 | 0.96 | .83–1.09 | .51 | |||
| 3 | 0.92 | .80–1.04 | .19 | |||
| 4 | 0.76 | .67–.98 | <.001 | |||
| 5 | 0.52 | .45–.60 | <.001 | |||
| Elevation (meters) | 0.99 | .98–.99 | <.001 | |||
| Temperature, °C | 1.44 | 1.36–1.53 | <.001 | 1.81 | 1.58–2.07 | <.001 |
| Hemoglobin level (d/L) | 0.99 | .98–.99 | <.001 | |||
| Reported use of antipyretic drugs in the preceding 2 wk | 0.96 | .88–1.04 | .302 | |||
| Reported use of antimalarials in the preceding 2 wk | 1.11 | 1.03–1.19 | .003 | 0.69 | .53–.90 | .007 |
| Complexity of infection, mean number of MSP-2 clones | 1.28 | 1.23–1.34 | <.001 | 1.26 | 1.16–1.37 | <.001 |
Results of logistic regression to identify factors associated with RDT positivity in nPCR-positive individuals in the sentinel population.
Abbreviations: AOR, adjusted odds ratio; CI, confidence interval; MSP2, merozoite surface protein-2; nPCR, nested polymerase chain reaction; OR, odds ratio; RDT, rapid diagnostic test; SES, socioeconomic status.
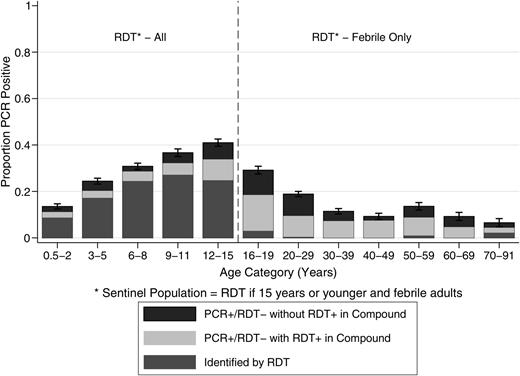
Detectability of infections in the sentinel age population. Prevalence of nPCR infection by age group in the sentinel population (aged 0.5–15 years and febrile adults). Bars indicate whether these infections were detected by RDT (dark grey) or whether these were RDT-negative but present in households with RDT-positive individuals (light grey) or RDT-negative without RDT-positive household members (black). Error bars indicate the 95% confidence interval for total nPCR parasite prevalence by age. Abbreviations: nPCR, nested polymerase chain reaction; PCR, polymerase chain reaction; RDT, rapid diagnostic test.
DISCUSSION
Including the asymptomatic and subpatent parasite reservoir of infection in control measures is predicted to considerably augment efficiency [4, 7], but sensitive and operationally attractive strategies to identify these individuals are needed. Here, we determine the value and limitations of a viable operational approach in which individuals who are most likely to harbor parasite densities detectable by conventional diagnostics (ie, in this setting, children and those with fever) are screened by RDT to identify clusters of subpatent parasite carriage in residents of the same household prior to the malaria transmission season when clusters are expected to be the most identifiable [9].
Focal MDA campaigns have been used in areas of heterogeneous malaria transmission [36], but there have not been any attempts to determine the value of this approach in guiding household-level treatment where considerable clustering of malaria infections is likely [37]. The presence of RDT-positive individuals in the sentinel population was highly predictive of nPCR prevalence in individuals who were RDT negative or not screened by RDT, confirming household-level clustering of malaria [17, 38]. We showed that at the time of this survey, the majority of individuals that were nPCR positive for asexual parasites also had concurrent gametocytes, illustrating their potential role in onward malaria transmission [39].
We showed that in our setting, screening those ≤15 years and febrile adults with a conventional RDT screened just over 50% of the total population and identified over 75% of the patent and subpatent parasite infections while minimizing the administration of antimalarial drugs to noninfected individuals. Although the addition of a malaria diagnostic test increases the operational complexity, there are advantages in ensuring more appropriately targeted treatment. If we had conducted focal MDA in all identified households, only one-third of all uninfected individuals would have received treatment. This approach would have been considerably more sensitive than strategies used in Zanzibar and Burkina Faso where infection was detected at an individual level by RDT and no attempt was undertaken to target subpatent parasite carriage in household members of RDT-positive individuals [7, 40]. By comparison, if a full MDA approach had been used in our setting, three-quarters of the total population would have received treatment despite not having a current infection. There are risks and expenses associated with overtreatment, and the use of antimalarial drugs should ideally be targeted to those with infection and at risk of infection [20, 22].
Our approach to screen individuals most likely to have infections at densities detectable by RDT [41, 42] did not result in the detection of all parasite-positive households or individuals. Although RDT screening of all age groups might be advocated, recent studies have shown that this approach is unlikely to result in complete uptake [19] and will not detect all infections [40]. Furthermore, individuals with subpatent infections in the sentinel population were more likely to be younger and have less complex infections, suggesting that the infections that were missed had lower parasite densities. Although the association of subpatent parasite carriage with reported drug use suggests that a fraction of RDT- and nPCR-positive individuals may be older infections with persisting gametocyte populations [43], this is unlikely to have affected our main outcomes and the histidine-rich protein 2 (HRP-2)–based RDT is likely to have a similar issue with positive results after clearance of asexual infections. The risk of missing infections due to fluctuating parasite densities and the single time point of sampling was also minimized by use of an HRP-2–based RDT [44].
In this study, it was striking that there was a high prevalence of subpatent infections in the youngest age groups [7], particularly in localities with the lowest average parasite prevalence. These findings indicate that even in low endemic settings and young age groups, molecular or alternative diagnostics may be required to detect all parasitemic individuals [4, 7, 18]. If we had used nPCR to test the sentinel population (≤15 years and febrile individuals), we would have achieved a sensitivity of 89.2% and a specificity of 50.9% to detect all nPCR-positive individuals in our study setting. It is currently unknown what coverage of the parasite populations is needed to achieve sustainable reductions in transmission. In addition, it is unknown to what extent that the impact of our screening approach may have been maximized by an iterative approach where repeated screening with RDTs followed by focal MDA may progressively reduce the parasite biomass in the population. Furthermore, the timing of a screening campaign with RDTs may lead to different proportions of the parasite population being detected depending on fluctuations in parasite densities during the season in relation to recent superinfections [33]. However, our findings indicate that any screening and treatment approaches to reduce malaria transmission would benefit from field-deployable molecular diagnostics.
Notes
Acknowledgments. We thank project staff, the community of Kabondo and Kasipul, Rachuonyo South, and KEMRI/CDC Kisumu. In addition, we thank our field staff who all worked very hard to make this study happen. We also thank D. Nuno Sepulvda for providing statistical support and Dr Kevin Tetteh for providing support during the analysis and manuscript preparation. We would also like to acknowledge Rob de Lange at Avantor Performance Materials B.V. for donating DNA/RNA stabilizing buffer. This manuscript has been approved by the Director of the Kenya Medical Research Institute.
T. B., G. H. S., A. Y. B., J. C., and C. D.—study design; A. Y. B., G. H. S., J. S., W. O., C. O., and E. L. M.—fieldwork and sampling; A. B., G. S., J. S., and W. O.—database management; A. Y. B., L. G., G. H. S., V. O., E. U. M., and S. S.—laboratory analysis, G. H. S.—statistical analyses, G. H. S., A. Y. B., T. B., J. C., C. D., and J. S. were involved in manuscript preparation. All authors read and approved this manuscript.
Financial support. This work was supported by the Bill and Melinda Gates Foundation, under the Malaria Transmission Consortium (45114), awarded to J. C.; and the Grand Challenge Grant (OPP1024438) awarded to T. B. The funders had no role in any aspect of study design, data collection, analysis, or manuscript preparation.
Potential conflicts of interest. All authors: No reported conflicts.
All authors have submitted the ICMJE Form for Disclosure of Potential Conflicts of Interest. Conflicts that the editors consider relevant to the content of the manuscript have been disclosed.
References
Author notes
Presented in part: 63rd American Society of Tropical Medicine and Hygiene Annual Meeting, New Orleans, Louisiana, 2–6 November 2014; Challenges in Malaria Research Conference, Oxford, United Kingdom, 22–24 September 2014.
G. H. S. and A. Y. B. contributed equally to this work.

