


Abstract
To assess ethnic disparities in the association between indirect and direct measures of adiposity in African American (AA) and European American (EA) adults.
We analyzed the indirect [weight, body mass index (BMI), waist circumference (WC), waist-to-height ratio (WHtR)] and direct [total fat, trunk fat, fat-free mass (FFM)] adiposity measures in healthy AA and EA adults. Assessments included anthropometry, oral glucose tolerance test, body composition by dual-energy X-ray absorptiometry (DXA), and calculation of direct-to-indirect adiposity ratios (total fat/BMI, trunk fat/WC, trunk fat/WHtR, and FFM/weight).
A total of 314 subjects (167 AA, 147 EA) underwent DXA. All participants (mean age 44.2 ± 10.6 years) had normal fasting and 2-hour glucose values. The BMI (AA vs EA) was 31.2 ± 7.42 kg/m2 vs28.8 ± 6.78 kg/m2 (P = .0014); WC 95.3 ± 16.0 cm vs 92.9 ± 15.0 cm (P = .15). Significant correlations (P < .0001) were observed between BMI and total fat (r = 0.68), WC, and trunk fat (r = 0.61) and WHtR vs trunk fat (r = 0.77) for the combined cohort, with heterogeneity in the strength of association by sex and ethnicity. Fat-free mass was higher in AA vs EA participants (P = .03). Total fat/BMI was lower in AA vs EA participants (P = .0047); trunk fat/WC (P = .004) and trunk fat/WHtR (P = .0026) were lower in AA men vs EA men.
The BMI overestimated body fat in AA participants vs EA participants, and WC overestimated trunk fat in AA men vs EA men. These data indicate ethnic disparities in the fidelity of indirect measures of adiposity and argue for ethnic-specific BMI thresholds for determination of overweight/obesity.
Overweight [defined as body mass index (BMI) of 25- 29.9 kg/m2] and obesity (defined as BMI of ≥30 kg/m2) are prevalent conditions that affect 42.5% and 31.1% of US adults, respectively [1]. Obesity is associated with numerous adverse conditions, including type 2 diabetes (T2DM), hypertension, dyslipidemia, musculoskeletal disorders, sleep apnea, and increased risks for cardiovascular disease and mortality [2]. The association between adiposity and increased cardiovascular disease risk is influenced by body fat distribution [3, 4]. Excess visceral adipose tissue (VAT) portends greater risk for insulin resistance, T2DM, and cardiovascular disease compared with subcutaneous fat [3-8]. In the Dallas Heart Study excess VAT, but not general adiposity, was independently associated with incident prediabetes and T2DM [5]. Similar findings of disproportionately adverse cardiometabolic risks attributable to VAT have been reported in the predominantly Caucasian Framingham Heart Study cohort [6] and among African American participants enrolled in the Jackson Heart Study [7]. In a prospective study among Japanese Americans, greater visceral fat accumulation preceded the development of T2DM [8]. Clinically, the waist circumference is used as a surrogate for visceral fat, but the waist-to-height ratio has been suggested as a better screening tool for cardiometabolic risk factors in adults than waist circumference [9].
The use of BMI does not provide a precise measure of adiposity. The numerator in the formula for BMI, body weight, is a composite of fat mass and fat-free mass (including muscle, bone, vasculature, and other lean body components). The waist circumference suffers from a similar lack of precision as a measure of visceral fat due to the inclusion of subcutaneous tissues and anterior, flank, and posterior abdominal muscles. Individual and ethnic variations in the components of fat-free mass can confound estimates of adiposity using the BMI or waist circumference. For example, ethnic differences have been reported in the relationship between BMI and total body fat [10] and that between waist circumference and visceral fat [11]. The aim of the present study was to examine the relationship between indirect measures (weight, BMI, waist circumference, waist-to-height ratio) and direct measures (total fat, trunk fat, fat-free mass) of adiposity in healthy African American vs European American adults. Specifically, we wanted to determine whether a given BMI value indicated similar body fat composition and whether a given waist circumference signified similar trunk fat level, in African American vs European American adults.
The Pathobiology of Prediabetes in a Biracial Cohort (POP-ABC) study enrolled African American and European American adults with parental history of T2DM and assessed them for progression from normoglycemia to prediabetes/T2DM during 5 years of follow-up [12-14]. The primary results of the POP-ABC study identified baseline BMI, waist circumference, insulin sensitivity, and insulin secretion among the significant predictors of progression from normoglycemia to prediabetes/T2DM [15-18]. There was no significant difference in the incidence of prediabetes/T2DM between African American and European American adults with a parental history of T2DM, after adjusting for baseline variables. In the present analysis, we assessed the fidelity of BMI and waist circumference and waist-to-height ratio as measures of total and trunk fat when checked against direct body fat measurements among participants in the POP-ABC study.
Materials and Methods
Participants
The study subjects were participants in the POP-ABC study [12-14]. Those eligible for enrollment in the POP-ABC study were healthy, normoglycemic adults aged 18 to 65 years who self-reported being of non-Hispanic White (European American) or non-Hispanic Black (African American) ancestry and had 1 or both biological parents with T2DM [12-14]. The standard 75-gram oral glucose tolerance test was used to screen prospective participants, and those with normoglycemia, based on American Diabetes Association criteria, were enrolled [19]. Excluded from participation were individuals with a history of diabetes and those taking glucocorticoids or other medications that affect body weight or blood glucose regulation. Also excluded were persons enrolled in behavioral weight loss programs or who had a history of liposuction or bariatric surgery. The self-report of race/ethnicity was based on the 1990 US Census questionnaire [20]. The University of Tennessee Institutional Review Board approved the study protocol (IRB Approval # 8399). All participants gave written informed consent before initiation of the study, which was conducted at the University of Tennessee General Clinical Research Center (GCRC).
Assessments
Participants made outpatient visits to the GCRC after an overnight fasting. Assessments at baseline included general physical examination, anthropometric measurements (weight, height, and waist circumference), and a standard 75-gram oral glucose tolerance test. Weight in light outdoor clothing was measured in duplicate on a calibrated balance beam scale. Standing height was measured in duplicate with a standard stadiometer. Waist circumference was measured at the midpoint between the top of the iliac crest and the lowest costal margin in the midaxillary line, using a Gulick II tape measure (Country Technology, Inc., Gays Mills, WI, USA). The BMI was calculated as the weight (kg) divided by the height (m) squared. The waist-to-height ratio was calculated as waist circumference (cm) divided by height (cm).
Body composition (total fat mass, trunk fat mass, lean or fat-free mass) was assessed by dual-energy X-ray absorptiometry (DXA) using Hologic Discovery A80044A fan-beam densitometer (Hologic Inc., Bedford, MA, USA). The whole-body DXA examinations were conducted at the GCRC by certified technologists according to the manufacturer's standard acquisition protocol. The participants were positioned supine and centered on the tabletop with their heads straight, arms vertically by the side, hands flat on the table, feet together, and the entire body contained within the scan limit borders. The participants remained still until the scan was completed. The DXA technique acquires 2 low-dose X-ray images at different average energies. The ratio of the attenuation of these 2 average energies is used to distinguish both bone from soft tissue and the percentage of fat in soft tissue in the absence of bone. Percent fat for total body and the trunk area was calculated as fat% = fat mass/(fat mass + lean soft mass + bone mineral content)×100. The data were analyzed automatically using Hologic Discovery software version 12.1. Equipment maintenance, calibration, and quality control procedures were implemented in accordance with the manufacturer's instructions. Although not strictly equivalent, we used trunk fat mass as an indicator of abdominal (visceral) fat accumulation, as that was the relevant measure available from the DXA output provided by the model of Hologic scanner that was used in our study.
Definition of Adiposity Ratios
To enable a standardized comparison across different sex and race/ethnicity groups, we derived 4 ratios of direct-to-indirect measures of adiposity as follows: (1) percent total fat divided by BMI, (2) percent trunk fat divided by waist circumference, (3) percent trunk fat divided by waist-to-height ratio, and (4) fat-free mass (kg) divided by weight (kg). With the numerator as total body fat, a ratio of unity would indicate that the BMI estimated total body fat exactly, whereas ratios above or below unity would suggest that the BMI overestimated or underestimated total body fat. A similar rationale was applied to the other adiposity ratios. Using an identical approach, Dudeja et al determined that Asian Indians have higher body fat per unit BMI [21].
Statistical Analysis
Data were reported as means ± SD. Differences in BMI, waist circumference, waist-to-height ratio, total body fat, trunk fat, and adiposity ratios across race/ethnicity and sex were analyzed using ANCOVA, with age as a covariate. As all adiposity measures were skewed, we used log-transformed data for all analyses. The association of indirect and direct measures of adiposity across sex and race/ethnicity was analyzed using Spearman's correlation. We used regression models to analyze the relationship between the direct and indirect measures of adiposity and to determine any significant differences in the slope and/or intercept of regression lines for African American and European American participants. The significance level was set as P < .05 (2-tailed). The analyses were performed using SAS 9.4 (SAS Institute Inc., Cary, NC).
Results
Baseline Cohort Characteristics
Of the 376 subjects (217 African American, 159 European American) enrolled in the POP-ABC study, data from 314 participants (167 African American, 147 European American) who completed DXA during year 1 of the study were analyzed for the present report. Table 1 shows the characteristics of the 314 study subjects. The study participants had a mean age of 44.2 ± 10.6 years (range 18-65 years) and a mean BMI of 30.2 ± 7.24 kg/m2 (range 16.8-66.3 kg/m2). As a group, African American participants were younger and had higher weight and BMI but similar values for height, waist circumference, and waist-to-height ratio compared with European American participants (Table 1). Values for total body fat and trunk fat mass were not significantly different, but fat-free mass was higher in African American participants compared with European American participants. There were significant differences by sex in several adiposity measures. African American women had higher weight, BMI, waist circumference, and waist-to-height ratio than European American women, whereas all those measures did not differ significantly among men (Table 1). The ethnic difference in fat-free mass was driven predominantly by the higher values in African American men compared with European American men (Table 1).
Demographic, glycemic, anthropometric, and adiposity data in in African American and European American male and female participants
| All | African American participants (n = 167) | European American participants (n = 147) | P value | |
|---|---|---|---|---|
| Age (years) | 44.2 ± 10.6 | 42.6 ± 10.3 | 46.5 ± 10.5 | .0004 |
| Men | 42.8 ± 9.91 | 44.9 ± 10.1 | .28 | |
| Women | 42.5 ± 10.5 | 47.2 ± 10.6 | .0004 | |
| FPG (mg/dL) | 91.8 ± 6.78 | 90.8 ± 6.82 | 93.1 ± 6.50 | .0011 |
| Men | 91.9 ± 7.43 | 94.9 ± 5.05 | .022 | |
| Women | 90.4 ± 6.54 | 92.4 ± 6.93 | .018 | |
| 2hrPG (mg/dL) | 124 ± 25.8 | 123 ± 27.5 | 125 ± 23.3 | .47 |
| Men | 121 ± 27.5 | 119 ± 22.6 | .76 | |
| Women | 124 ± 27.4 | 128 ± 23.3 | .27 | |
| Weight (kg) | 85.3 ± 21.2 | 87.9 ± 21.1 | 81.8 ± 20.9 | .0058 |
| Men | 93.4 ± 24.8 | 90.6 ± 16.2 | .50 | |
| Women | 85.7 ± 19.1 | 77.9 ± 21.6 | .0022 | |
| Height (cm) | 168 ± 9.27 | 168 ± 9.53 | 168 ± 8.92 | .81 |
| Men | 178 ± 8.10 | 178 ± 7.15 | .99 | |
| Women | 164 ± 6.59 | 164 ± 5.41 | .92 | |
| Waist circumference (cm) | 94.3 ± 15.6 | 95.3 ± 16.0 | 92.9 ± 15.0 | .19 |
| Men | 97.2 ± 17.9 | 99.2 ± 10.7 | .26 | |
| Women | 94.5 ± 15.2 | 90.1 ± 15.9 | .018 | |
| BMI (kg/m2) | 30.2 ± 7.24 | 31.2 ± 7.42 | 28.8 ± 6.78 | .0028 |
| Men | 29.5 ± 7.62 | 28.4 ± 4.12 | .77 | |
| Women | 31.9 ± 7.25 | 28.9 ± 7.66 | .001 | |
| Waist-to-height ratio | 0.56 ± 0.09 | 0.57 ± 0.10 | 0.55 ± 0.08 | .13 |
| Men | 0.55 ± 0.10 | 0.56 ± 0.05 | .25 | |
| Women | 0.58 ± 0.10 | 0.55 ± 0.10 | .019 | |
| Total fat mass (kg) | 30.6 ± 13.5 | 31.8 ± 18.9 | 29.4 ± 13.2 | .24 |
| Men | 22.4 ± 10.1 | 24.4 ± 8.12 | .10 | |
| Women | 35.2 ± 13.4 | 31.6 ± 14.4 | .028 | |
| Total fat (%) | 35.1 ± 9.74 | 35.2 ± 10.3 | 34.9 ± 9.13 | .88 |
| Men | 23.9 ± 7.58 | 26.7 ± 5.20 | .017 | |
| Women | 39.4 ± 7.63 | 38.7 ± 8.00 | .42 | |
| Trunk fat mass (kg) | 15.1 ± 7.25 | 15.3 ± 7.50 | 14.8 ± 6.96 | .82 |
| Men | 11.3 ± 5.94 | 13.4 ± 4.94 | .016 | |
| Women | 16.8 ± 7.48 | 15.4 ± 7.65 | .099 | |
| Trunk fat (%) | 35.4 ± 10.4 | 35.7 ± 11.2 | 35.1 ± 9.48 | .89 |
| Men | 25.2 ± 9.23 | 29.1 ± 5.96 | .0058 | |
| Women | 39.5 ± 9.16 | 37.8 ± 9.55 | .16 | |
| Fat-free mass (kg) | 51.7 ± 11.9 | 53.1 ± 11.7 | 50.1 ± 11.9 | .05 |
| Men | 66.0 ± 12.5 | 62.6 ± 9.18 | .28 | |
| Women | 48.7 ± 7.44 | 44.3 ± 7.91 | .0001 |
Abbreviations: BMI, body mass index; FPG, fasting plasma glucose; 2hrPG, 2-hour plasma glucose.
Relationship Between Adiposity Measures
In both African American and European American male and female participants, the indirect measures were significantly correlated with the direct measures of adiposity (rho 0.59-0.77, P < .0001 for the combined cohort) (Table 2). The correlation coefficient between BMI and percent total fat was higher in women (rho = 0.84) than men (rho = 0.62) but comparable between African American women vs European American women, and between African American men vs European American men (Table 2). The correlation coefficient between waist-to-height ratio and percent trunk fat (rho = 0.77) was higher than that between waist circumference and percent trunk fat (rho = 0.59) in the combined study population, a pattern that was consistent across sex and race/ethnicity (Table 2).
Spearman correlations between indirect and direct adiposity measures in African American and European American male and female participants
| Measures | All participants | African American | European American | |||
|---|---|---|---|---|---|---|
| rho | P | rho | P | rho | P | |
| BMI vs %Total fat mass | 0.68 | <.0001 | 0.75 | <.0001 | 0.60 | <.0001 |
| Men | 0.62 | <.0001 | 0.66 | <.0001 | 0.58 | <.0001 |
| Women | 0.84 | <.0001 | 0.85 | <.0001 | 0.86 | <.0001 |
| Waist vs %Trunk fat | 0.59 | <.0001 | 0.61 | <.0001 | 0.56 | <.0001 |
| Men | 0.77 | <.0001 | 0.79 | <.0001 | 0.77 | <.0001 |
| Women | 0.82 | <.0001 | 0.78 | <.0001 | 0.86 | <.0001 |
| WHtR vs %Trunk fat | 0.77 | <.0001 | 0.79 | <.0001 | 0.73 | <.0001 |
| Men | 0.84 | <.0001 | 0.86 | <.0001 | 0.80 | <.0001 |
| Women | 0.86 | <.0001 | 0.83 | <.0001 | 0.89 | <.0001 |
Abbreviations: BMI, body mass index; WHtR, waist-to-height ratio.
Integrated Adiposity Ratios
To enable comparison across groups, we standardized directly measured adiposity values per unit of indirect adiposity value by calculating the following ratios: percent total fat/BMI, percent trunk fat/waist circumference, percent trunk fat/waist-to-height ratio, and fat-free mass/weight. Compared with European American men and women, African American men and women had lower total fat per unit of BMI (Fig. 1A and Table 3). Furthermore, African American men had lower trunk fat per unit of waist circumference or waist-to-height ratio compared with European American men (Fig. 1B and 1C and Table 3). Fat-free mass accounted for ∼70% of body weight in African American and European American men and ∼60% of body weight in African American and European American women (Fig. 2D and Table 3).
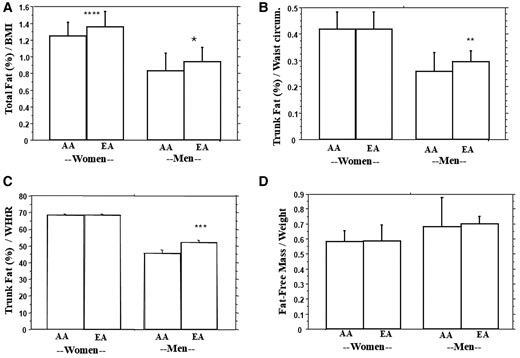
Comparison of percent total fat/BMI (A), percent trunk fat/waist circumference (B), percent trunk fat/waist-to-height ratio (C), and lean mass/weight (D) in African American (AA) and European American (EA) men and women. * P = .0047, **P = .004, ***P = .0026, ****P = .0001.
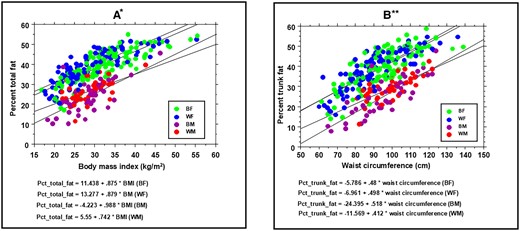
Regression of percent total fat vs body mass index (A) and percent trunk fat vs waist circumference (B) in BF (green), BM (purple), WF (blue), and WM) (red) participants. The regression equations by sex and race-ethnicity appear below the x-axis labels. * Percent total fat vs BMI: P = .005 (BM vs WM), P = .002 (BF vs WF); ** Percent trunk fat vs waist circumference: P = .012 (BM vs WM), P = .54 (BF vs WF).
Abbreviations: BF, Black female; BM, Black male; BMI, body mass index; WF, White female; WM, White male.
Comparison of integrated adiposity ratios in African American and European American male and female participants
| Adiposity ratio | Group | Men | P-value | Women | P-value |
|---|---|---|---|---|---|
| Total fat (%)/BMI (kg/m2) | African American | 0.833 ± 0.210 | .0047 | 1.248 ± 0.164 | .0001 |
| European American | 0.946 ± 0.159 | 1.355 ± 0.189 | |||
| Trunk fat (%)/Waist circumference (cm) | African American | 0.257 ± 0.072 | .004 | 0.417 ± 0.065 | .91 |
| European American | 0.294 ± 0.043 | 0.418 ± 0.064 | |||
| Trunk fat (%)/Waist-to-height ratio | African American | 45.6 ± 12.1 | .0026 | 68.2 ± 9.87 | .97 |
| European American | 52.3 ± 7.87 | 68.2 ± 9.98 | |||
| Fat-free mass (kg)/Weight (kg) | African American | 0.678 ± 0.200 | .52 | 0.579 ± 0.076 | .59 |
| European American | 0.696 ± 0.055 | 0.586 ± 0.108 |
Abbreviation: BMI, body mass index.
Regression Models
Figure 2 shows the regression of percent total fat vs BMI and that of percent trunk fat vs waist circumference by sex and race/ethnicity. There was a notable heterogeneity in the scatter of values for percent total fat in relation to BMI and percent trunk fat in relation to waist circumference. Compared with men, women had higher percent total fat at every BMI level and higher trunk fat at every level of waist circumference. There was a significantly lower increase in percent total fat per unit increase in BMI in African American men compared with European American men (P = .005) and in African American women compared with European American women (P = .002).
Similarly, there was a significantly lower increase in percent trunk fat per unit increase in waist circumference in African American men compared with European American men (P = .012). However, the slope and intercept of the regression plot of percent trunk fat vs waist circumference was not significantly different in African American women compared with European American women (P = .54) (Fig. 2).
Using the linear regression equations generated from our data, BMI cutoff points of 25 kg/m2, 30 kg/m2, 35 kg/m2, and 40 kg/m2 corresponded to total body fat of 28.7%, 34.1%, 39.5%, and 44.9%, respectively, in African Americans. In comparison, BMI cutoff points of 25 kg/m2, 30 kg/m2, 35 kg/m2, and 40 kg/m2 corresponded to total body fat of 31.6%, 36.0%, 40.5%, and 44.9%, respectively, in European American participants (Table 4). Using the regression equation for total fat (%) vs BMI (African American male: Y = −4.223 + .988 * X; European American male: Y = 5.55 + .742 * X), a total body fat of 24% would predict a BMI of 28.6 kg/m2 in an African American male vs 24.9 kg/m2 in an European American male, indicating that the BMI overestimates total body fat in African American men. A similar pattern was seen among women. At a waist circumference 102 cm (the diagnostic threshold for metabolic syndrome in African American and European American men), the regression equations predicted trunk fat values of 28.4% in African American men and 30.3% in European American men. Using the regression equations for trunk fat (%) vs waist circumference (African American male: Y = −24.395 + .518 * X; European American male: Y = −11.569 + .412 * X), a trunk fat of 30% would predict a waist circumference of 105 cm in an African American male vs 101 cm in an European American male, indicating that the waist circumference overestimates trunk fat in African American men. The percent trunk fat at a waist circumference of 88 cm (the diagnostic threshold for metabolic syndrome in African American and European American women) was 36.5% in African American women and 36.9% in European American women (Table 5).
Predicted body fat from selected body mass index thresholds in AA and EA male and female participants
| BMI cutoff | Percent total body fat | |||
|---|---|---|---|---|
| AA female | EA female | AA male | EA male | |
| 25 kg/m2 | 33.3 | 35.3 | 20.5 | 24.1 |
| 30 kg/m2 | 37.7 | 39.6 | 25.4 | 27.8 |
| 35 kg/m2 | 42.1 | 44.0 | 30.4 | 31.5 |
| 40 kg/m2 | 46.4 | 48.4 | 35.3 | 35.2 |
| BMI cutoff | Percent total body fat | |||
|---|---|---|---|---|
| AA female | EA female | AA male | EA male | |
| 25 kg/m2 | 33.3 | 35.3 | 20.5 | 24.1 |
| 30 kg/m2 | 37.7 | 39.6 | 25.4 | 27.8 |
| 35 kg/m2 | 42.1 | 44.0 | 30.4 | 31.5 |
| 40 kg/m2 | 46.4 | 48.4 | 35.3 | 35.2 |
Regression equations: total fat (%) vs. BMI.
AA female: Y = 11.438 + .875 * X; EA female Y = 13.277 + .879 * X.
AA male: Y = −4.223 + .988 * X; EA male: Y = 5.550 + .742 * X.
Abbreviations: AA, African American; BMI, body mass index; EU, European American.
Predicted body fat from selected waist circumference thresholds in AA and EA male and female participants
| Waist circumference cutoff | Percent trunk fat | |
|---|---|---|
| Female | AA female | EA female |
| 88 cm | 36.5 | 36.9 |
| Male | AA male | EA male |
| 102 cm | 28.4 | 30.3 |
| Waist circumference cutoff | Percent trunk fat | |
|---|---|---|
| Female | AA female | EA female |
| 88 cm | 36.5 | 36.9 |
| Male | AA male | EA male |
| 102 cm | 28.4 | 30.3 |
Regression equations: trunk fat (%) vs waist circumference.
AA female: Y = −5.786 + .48 * X; EA female Y = −6.961 + .498 * X.
AA male: Y = −24.395 + .518 * X; EA male: Y = −11.569 + .412 * X.
Abbreviations: AA, African American; EU, European American.
Discussion
Obesity is a well-known risk factor for adverse health outcomes, including increased risks for cardiometabolic, rheumatological, neoplastic, and other disorders [2, 22, 23]. The BMI and waist circumference are used clinically as convenient measures of total body fat and abdominal (visceral) adiposity, respectively. In the present study, we used trunk fat mass as an indicator of abdominal (visceral) fat accumulation, as that was the relevant measure obtained from the model of the Hologic scanner that was used in our study. The numerator in the BMI calculation is body weight, which includes fat mass, skeletal mass, muscle, and lean mass. Consequently, the BMI has limitations as an accurate measure of fatness. More precise measurement of adipose mass can be achieved using a variety of validated methods, such as DXA, computed tomography, and magnetic resonance imaging, among others [24, 25]. However, due to its simplicity, convenience, and lack of associated costs, the BMI has remained the clinical tool for assessing overweight/obesity status.
In addition to the risks associated with total body adiposity, waist circumference and other measures of fat accumulation in the trunk region and abdominal compartment have been particularly associated with insulin resistance and adverse cardiometabolic profile [4-8, 25]. Recently, the European Association for the Study of Obesity has published a new framework for the diagnosis, staging, and management of obesity that includes the use of waist-to-height ratio [26]. A systematic review and meta-analysis had previously suggested that the waist-to-height ratio might be a better screening tool for cardiometabolic risk factors than waist circumference or BMI [9]. However, the same lack of precision applies to the use of waist circumference as a surrogate measure of trunk fat due to the inclusion of subcutaneous tissues and lean body components of the anterior and posterior abdominal wall.
Cross-sectional national surveys have reported disparities in the prevalence of obesity, based on BMI and waist circumference data [10, 11, 27, 28]. In general, these surveys report a higher prevalence of obesity in African Americans compared with European Americans, particularly among women. In the present report, we assessed the associations between indirect estimates of adiposity and DXA-derived direct measures of total and trunk adiposity in African American and European American participants in the POP-ABC study. We found that clinical estimation of adiposity using BMI correlated significantly with DXA-derived measures of total body fat in our study population. Similarly, waist circumference and waist-to-height ratio were significantly correlated with trunk fat mass as measured with DXA. Thus, our findings provide some support for the utility of BMI and waist circumference as surrogate markers of total and trunk fat, respectively, in clinical practice. Furthermore, our data indicate that shifts in BMI and waist circumference would provide meaningful information in people undergoing treatment for overweight or obesity.
We observed that fat-free mass (comprising muscle, bone, and other lean mass components) accounted for ∼70% and ∼60% of body weight in men and women, respectively, in the POP-ABC study population. Notably, fat-free mass was significantly higher among African American participants compared with European American participants. Because fat-free mass is captured as part of body weight and factored into the calculation of BMI, sex and ethnic differences in fat-free mass could influence the agreement between BMI and body fat. Consonant with the latter notion, we found heterogeneity in the strength of association between BMI and total fat by sex and ethnicity, as we did for the association between waist circumference and trunk fat. We reasoned that the ratios of total fat/BMI and trunk fat/waist circumference would yield an estimate of “excess fat” that could then be compared across different groups. Indeed, when compared across sex and ethnicity, African American men and women had significantly lower percent body fat per unit BMI compared with European American participants. African American men also had significantly lower trunk fat per unit waist circumference or waist-to-height ratio compared with European American men. Physiologically, these findings can be explained by the well-known higher muscle mass and bone density in African Americans compared with European Americans [29-31].
Our present findings indicate that the BMI, though significantly correlated with total body fat, systematically overestimates adiposity in African American men and women compared with European American men and women. The degree of overestimation seemed greater among individuals with lower BMI and became attenuated at BMI levels of ∼40 kg/m2 in men. Further, waist circumference and waist-to-height ratio overestimated trunk fat in African American men compared with their European American men. Our findings are in accordance with published reports showing either lower trunk fat or lower visceral adipose tissue in African Americans compared with European Americans [10, 11, 32, 33]. Thus, despite the strong correlations observed between indirect and direct measures of adiposity, our findings support the argument for consideration of ethnic-specific BMI cutoffs for the classification of obesity [34-38]. Current definitions stipulate similar cutoff points for healthy BMI (<25 kg/m2), overweight (BMI ≥25 and ≤30 kg/m2), and obesity (BMI ≥30 kg/m2) for African Americans and European Americans and lower cutoff points for Asians [2, 39, 40]. The metabolic syndrome criteria also stipulate similar cutoff points for waist circumference (102 cm for men, 88 cm for women) for African Americans and European Americans [41]. Our present findings support previous suggestions that the rationale for using similar cutoff points for African Americans and European Americans deserves to be revisited [32-37]. In the primary report from the POP-ABC study, the incidence of prediabetes/T2DM was 11.3 cases per 100 person-years in African American adults with a parental history of T2DM and 13.7 cases per 100 person-years in European American adults with a parental history of T2DM (P = .2997), adjusted for baseline variables [15]. In multivariate analyses, baseline age, BMI, waist circumference, insulin sensitivity, and insulin secretion, but not race/ethnicity, were significant predictors of incident prediabetes/T2DM, as previously reported [15-18].
Our study has numerous strengths. We enrolled a large cohort of phenotypically well-characterized individuals. Further, body composition data were acquired using DXA, a well-validated methodology. Moreover, all participants were confirmed to have normoglycemia, thereby obviating potential confounding interactions between hyperglycemia/diabetes and fat metabolism. Despite these strengths, our study has some limitations. We studied a special population (individuals of European and African descent with a parental history of T2DM), which may limit the generalizability of our findings to other populations and individuals without a family history of diabetes. Further, our DXA-derived trunk fat mass was not an exact measure of visceral fat. In conclusion, our study demonstrates that among otherwise healthy subjects with a wide BMI range, African American participants had lower total body fat per unit of BMI than their European American counterparts. Our findings support the notion of ethnic-specific BMI cutoffs for obesity classification.
Acknowledgments
The authors gratefully acknowledge the assistance of Mary Peterson, RN, and the staff of the GCRC and the altruism of the research volunteers who participated in the POP-ABC study.
Funding
This study was supported by National Institutes of Health grant R01 DK067269 (to S.D.-J.) and American Diabetes Association grant 7-07-MN-13. The funding sources had no role in the production of the manuscript or in the decision to submit it for publication.
Author Contributions
S.D.-J., as the principal investigator, developed the study concept and design and drafted, reviewed, and revised the manuscript; Z.L. collected and analyzed data and drafted, reviewed, and revised the manuscript; P.A. collected and analyzed data and drafted, reviewed, and revised the manuscript. A.P. collected the data and reviewed and revised the manuscript; J.W. performed statistical analyses and reviewed and revised the manuscript.
Disclosures
The authors have no conflicts of interest to disclose regarding the content of this manuscript.
Data Availability
Some or all datasets generated and/or analyzed during the current study are not publicly available but are available from the corresponding author on reasonable request.
