


Abstract
Growth hormone (GH) replacement therapy improves longitudinal growth and adult height in children with GH deficiency (GHD). GH stimulates insulin-like growth factor (IGF)-I release, the biomarker used for monitoring GH activity during treatment.
This study aims to provide model-based insights into the dose–IGF-I responses of once-weekly somapacitan, a novel long-acting GH, compared with daily GH in children with GHD.
Analyses included dosing information and 1473 pharmacokinetic samples from 210 somapacitan-treated pediatric patients with GHD across 3 trials, including phase 1 (NCT01973244), phase 2 (NCT02616562; REAL 3), and phase 3 (NCT03811535; REAL 4), as well as 1381 IGF-I samples from 186 patients with GHD treated with somapacitan in REAL 3 and REAL 4. Pharmacokinetic/pharmacodynamic modeling to characterize somapacitan dose–IGF-I response and predict the response to dosing day changes.
Relationships were established between somapacitan dose, exposure, change from baseline IGF-I SD score (SDS), and height velocity (HV). A linear model permitted the development of a tool to calculate estimated average weekly IGF-I exposure from a single IGF-I sample obtained at any time within the somapacitan dosing interval at steady state. In practice, the use of this tool requires knowledge of somapacitan injection timing relative to IGF-I sample collection timing. IGF-I SDS simulations support flexible dosing day changes while maintaining at least 4 days between doses.
We characterized the dose–IGF-I response of somapacitan in children with GHD. To support physicians in IGF-I monitoring, we present a practical guide about expected weekly average IGF-I concentrations in these patients and provide insights on dosing day flexibility.
GH deficiency (GHD) in children has, for decades, been successfully treated with daily injections of recombinant human GH to improve longitudinal growth and adult height [1, 2]. GH stimulates insulin-like growth factor (IGF)-I release, the most widely used biomarker for monitoring GH treatment in pediatric GHD [3]. In clinical practice, IGF-I sampling is also used by physicians to guide dose adjustment and to monitor adherence and overtreatment in children with GHD [4-7].
Although daily GH injections do not mimic endogenous IGF-I release patterns, IGF-I concentrations remain relatively constant throughout the day and from day to day in patients treated with daily GH [8]. The IGF-I profile during treatment with a long-acting GH (LAGH), such as novel once-weekly somapacitan, differs from the IGF-I profile during daily GH treatment by exhibiting larger peaks and troughs over the dosing interval [9]. This difference raises an important question for physicians used to monitoring IGF-I during daily GH replacement therapy: When should blood samples be obtained to monitor IGF-I concentrations for patients receiving replacement therapy with LAGH treatment? To address this question, physicians require additional guidance about IGF-I sampling time to determine IGF-I exposure in patients treated with LAGHs [10, 11].
Somapacitan (Sogroya, Novo Nordisk A/S) is a LAGH administered as a once-weekly subcutaneous (SC) injection for pediatric and adult patients with GHD. With 1 single amino acid substitution linked to a short noncovalent albumin-binding moiety, somapacitan is a human GH derivative with 99% similarity to daily GH [12]. Somapacitan reversibly associates with circulating endogenous albumin, which delays its elimination and prolongs in vivo half-life to allow once-weekly administration. This technology is also used to enhance the half-life of other approved peptide drugs, such as the long-acting insulin detemir and glucagon-like peptide-1 receptor agonist semaglutide [13-16]. The recent pivotal phase 3 trial REAL 4 in treatment-naïve children with GHD demonstrated efficacy and safety of 0.16 mg/kg/week somapacitan similar to daily GH (0.034 mg/kg/day Norditropin, Novo Nordisk A/S) after 52 weeks of treatment. Further similar mean IGF-I standard deviation score (SDS) values within the normal range (−2 to +2) were observed for somapacitan (+0.28) compared with daily GH (+0.10) at week 52 [17]. These findings are also consistent with the 4-year results from the phase 2 trial REAL 3 in children with GHD, which showed treatment with 0.16 mg/kg/week somapacitan has a sustained efficacy and safety profile similar to the control group where patients received daily GH (0.034 mg/kg/day Norditropin) for up to 3 years and after control group patients in the fourth year switched from daily GH to once-weekly somapacitan [18]. Treatment with once-weekly somapacitan reduces the treatment burden for patients and their parents/guardians in REAL 3 and REAL 4 [17-20].
In the present study, we used pharmacokinetic and pharmacodynamic (PK/PD) modeling based on data from 210 and 82 pediatric patients with GHD treated with somapacitan and daily GH (Norditropin), respectively, to address the following questions: (1) How does the IGF-I profile of somapacitan compare with the one of daily GH? (2) How can IGF-I be monitored following once-weekly somapacitan? (3) How do IGF-I and height velocity (HV) respond to a change in somapacitan dose? (4) What is the expected IGF-I response when initiating somapacitan in treatment-naïve patients or in patients switching from daily GH; and, finally, (5) What is the expected IGF-I response when changing the dosing day or missing a dose?
Materials and Methods
Clinical Trial Data
The analyses were conducted based on data from patients with GHD randomized to somapacitan or daily GH injections in 3 active-controlled trials: (1) a multinational single-dose phase 1 trial in previously GH-treated children with GHD (NCT01973244); (2) a global phase 2 trial in treatment-naïve children with GHD (NCT02616562, REAL 3); and (3) a global phase 3 trial in treatment-naïve children with GHD (NCT03811535, REAL 4) (Table 1). In the first trial, 32 children with GHD were enrolled into 4 ascending somapacitan dose cohorts with a daily GH control group. Within each cohort, 6 children were randomized to a single SC dose of somapacitan of 0.02, 0.04, 0.08, or 0.16 mg/kg. In total 8 children were randomized to daily GH SC injections (0.03 mg/kg/day Norditropin) for 7 days. In the second trial (REAL 3), 57 children with GHD were randomized 1:1:1:1 for treatment with SC somapacitan (0.04, 0.08, or 0.16 mg/kg/week) or SC daily GH (0.034 mg/kg/day Norditropin) for 52 weeks. After 52 weeks, all children randomized to somapacitan were allocated to receive 0.16 mg/kg/week for the safety extension (week 52-156), while children randomized to daily GH continued treatment until week 156, after which all children were allocated to receive 0.16 mg/kg/week somapacitan (week 156-364). Results for efficacy and safety up to week 208 have been published [18, 20]. For the third trial (REAL 4), 200 children with GHD were randomized 2:1 for treatment with 0.16 mg/kg/week SC somapacitan or 0.034 mg/kg/day SC daily GH (Norditropin) for 52 weeks, respectively. After week 52, all children were allocated to receive 0.16 mg/kg/week somapacitan for a 3-year safety extension period. Results for efficacy and safety up to week 52 have been published [17].
Overview of trials and patients
| Trial | NCT01973244 | NCT02616562; REAL 3 | NCT03811535; REAL 4 |
|---|---|---|---|
| Study design | Phase 1, randomized 1:1:1:1, open-labelled, active-controlled, multinational, dose escalation trial | Phase 2, randomized 1:1:1:1, open-label, active-controlled, multinational, multicenter, dose-finding (double-blinded), parallel group trial | Phase 3, randomized 2:1, active-controlled, multinational, multicenter, open-label parallel group trial |
| Trial duration | 28-35 days 7 days (treatment period) | 364 weeks (7 years) Week 0-52 (26-week main phase +26-week extension period) week 52-156 (safety extension period) Week 156-364 (long-term safety extension period) | 208 weeks (4 years) Week 0-52 (main phase) Week 52-208 (safety extension period) |
| Treatment regimen | Somapacitan single dose 0.02, 0.04, 0.08 and 0.16 mg/kg/week, or daily GH (Norditropin) 0.03 mg/kg/day for 7 days | Week 0-52: somapacitan 0.04, 0.08 and 0.16 mg/kg/week, or daily GH (Norditropin) 0.034 mg/kg/day (1:1:1:1) Week 52-156: somapacitan 0.16 mg/kg/week or daily GH (Norditropin) 0.034 mg/kg/day (3:1) Week 156 to 364: somapacitan 0.16 mg/kg/week (all children) | Week 0-52: somapacitan 0.16 mg/kg/week or daily GH (Norditropin) 0.034 mg/kg/day (2:1) Week 52-208: somapacitan 0.16 mg/kg/week (all children) |
| Patients enrolled | Non-naïve pre-pubertal children with GHD | GH treatment naïve prepubertal children with GHD | GH treatment naïve prepubertal children with GHD |
| Population | Global | Global | Global |
| Comparator | Daily GH (Norditropin) | Daily GH (Norditropin) | Daily GH (Norditropin) |
| Patients randomized | 32 | 57 | 200 |
| Patients treated with somapacitan | 24 | 43 Week 156-208: 11a | 132 |
| Patients treated with daily GH | 8 | 14 | 68 |
Abbreviations: GH, growth hormone; GHD, growth hormone deficiency.
Children randomized to daily GH who switched to somapacitan after 156 weeks of treatment.
Prior to the initiation of the 3 trials (NCT01973244, phase 1; NCT02616562, REAL 3, phase 2; NCT03811535, REAL 4, phase 3) the protocol of each trial was reviewed and approved according to local regulations by appropriate health authorities, and by local and national independent ethics committees/institutional review boards. The trials were conducted in accordance with the International Conference on Harmonization Guidelines for Good Clinical Practice [21, 22] and the Declaration of Helsinki [23]. The data reported in this manuscript were exempt from human ethics review since it was based on previously collected data from all 3 trials.
Blood Sampling and Bioanalysis
In REAL 3 (phase 2) and REAL 4 (phase 3), serial blood sampling was performed throughout the trials at carefully selected time-windows relative to dosing (before first dose, 1-4 days after dosing, 4-6 days after dosing, and predose before next dosing) to cover baseline, maximum (peak), estimated weekly average, and minimum (trough) PK and IGF-I concentrations following once-weekly somapacitan dosing. In the phase 1 trial, 14 samples per patient were collected up until 10 days after the single somapacitan dose to characterize the PK/PD profile. Dosing time was entered in dosing diaries and was used to calculate actual time after dose for blood samples.
In both trials, REAL 3 and REAL 4, somapacitan serum concentrations were measured using a validated and noncommercially available somapacitan-specific Luminescent Oxygen Channeling Immunoassay developed by Novo Nordisk. The lower limit of quantification (LLOQ) was 0.5 ng/mL for all trials. IGF-I was analyzed using the IDS-iSYS Insulin like Growth Factor-I Assay Kit from Immunodiagnostic Systems (Cat. # IS-3900, RRID:AB_2861357). IGF-I values were analyzed on the ng/mL scale, and IGF-I SDS values were calculated using previously published reference data [24].
Population PK/PD and Exposure-Response Methods
PK/PD analysis of somapacitan
Somapacitan population PK/PD models were based on previously published models developed from full PK and IGF-I profiles obtained in phase 1 [25, 26]. The model consisted of a nonlinear PK model and an indirect response model of IGF-I. Nonlinear mixed-effects modeling was used to refit model to sparse PK and IGF-I data collected in REAL 3 and REAL 4 and full profile PK data from phase 1 to support the estimation of PK parameters in the model. The primary parameters of interest for the analysis were the relative bioavailability parameter (Frel), the baseline IGF-I production rate (kin), and maximum somapacitan response of IGF-I (Emax). Prespecified covariates evaluated for population PK/PD models were sex, race/ethnicity, and body weight. Interindividual variability for the parameters of interest were assumed to be log-normal, for the residual error to be log-normal for PK, and proportional for IGF-I (on ng/mL scale).
PK/PD analysis of daily GH
The population PD model for IGF-I following daily GH was based on IGF-I data collected until week 52 following daily GH treatment in REAL 3 and REAL 4. An indirect response model was estimated with primary parameters of interest kin and Emax to allow comparison to the somapacitan model. The PK model (1-compartment, linear absorption) and the concentration corresponding to half-maximum stimulation of IGF-I production rate (EC50) were assumed the same as a previously established for daily GH [26]. Negligible endogenous GH values were observed at baseline, and these were ignored in the analysis. The drug-independent IGF-I turn-over rate kout was assumed to be the same for somapacitan. The same interindividual variability structure, covariates, and residual error model was applied for the somapacitan population PD model.
Estimation of individual IGF-I SDS profiles and average
For each patient, the individual predicted weekly IGF-I profiles at week 52 were estimated based on observed IGF-I concentrations, actual time after dose, and the final population PK/PD model for somapacitan and daily GH, respectively. IGF-I profiles were estimated on the ng/mL scale and converted to SDS. Weekly IGF-I average (IGF-Iavg) SDS was derived as area under the curve from individually estimated IGF-I SDS profiles.
Relationship between sample time after dose and average for somapacitan
Linear modeling was used to estimate at different sampling time after dose (TAD) the difference between weekly IGF-Iavg SDS and IGF-ITAD SDS as well as between weekly IGF-Iavg (ng/mL) and IGF-ITAD (ng/mL) concentration values for subjects receiving 0.16 mg/kg/week somapacitan in REAL 3 and REAL 4. Results were approximated into a correction parameter to calculate IGF-Iavg based on a sample taken in daily (24 hours) intervals for ease of use.
Dose–IGF-I analysis and exposure–response analysis on HV
The relationship between somapacitan dose (mg/kg) and individual predicted IGF-Iavg SDS at week 52 from trials REAL 3 and REAL 4 was investigated with a linear model with baseline IGF-I SDS as covariate.
Exposure–response analyses were conducted based on week 52 data using a log-linear relationship between somapacitan exposure vs HV and a linear relationship between change from baseline IGF-I SDS vs HV. Included covariates were sex, age group, and region, with a sex by age group interaction.
Estimation and software
Population PK/PD parameters for somapacitan and daily GH were estimated by simultaneous fitting of PK and IGF-I data using the NONMEM software. Data below LLOQ were set to LLOQ/2. Full PK/PD models were constructed with all investigated covariates included [27]. The 90% CI for each covariate effect was estimated by sampling importance resampling [28]. Covariate–parameter relationships with a 90% CI that overlapped “no effect” (0 and 1 for continuous and categorical covariates, respectively) were not included in the final PK/PD models. NONMEM (ICON Development Solutions, Ellicott City, MD, USA) and R version 3.5.3 (R Foundation for Statistical Computing, Vienna, Austria) with PsN version 4.60 (https://uupharmacometrics.github.io/PsN/index.html, University of Uppsala) were used for the population PK/PD and exposure–response analyses.
Results
Data for PK and PK/PD Analyses
Baseline demographics and characteristics of patients are published elsewhere (Tables S1 and S2 [29]). Population PK/PD analyses for somapacitan were based on data from 210 children with GHD randomized to somapacitan in phase 3 trial REAL 4 (132), phase 2 trial REAL 3 (54), and a phase 1 trial (NCT01973244) (24) (Table S1 [29]). Population PK/PD analyses for daily GH were based on data from 82 patients with GHD treated with daily GH in REAL 4 (68) and REAL 3 (14) (Table S2 [29]). Eleven patients from REAL 3 contributed with data to both somapacitan PK/PD analysis and the daily GH population PD analysis, as they were randomized to daily GH and switched to somapacitan after 156 weeks of treatment. The baseline somapacitan dataset included 1534 PK samples and 1455 IGF-I samples. Less than 5% of data were excluded either due to missing data (0.6%), incomplete/ambiguous dosing diary before sampling (2.7%), or sampling outside the on-treatment period (0.8%). Eleven PK outliers and 1 IGF-I outlier were identified by CWRES in the starting model and were excluded. Following data cleaning, a total of 1473 PK concentration values and 1381 IGF-I values were included in the final somapacitan PK and PK/PD data sets. The PD dataset for daily GH included 452 IGF-I values.
Analyses of dose–IGF-I relationship and exposure–response analysis of HV were based on data from the main period of REAL 3 and REAL 4 (52 weeks) and included 175 children for somapacitan in the population PK/PD dataset (excluding data from phase 1 and patients switching from daily GH to once-weekly somapacitan in REAL 3; Table S1 [29]).
PK/PD Modeling
The population PK/PD models for somapacitan and daily GH converged successfully with covariance step and sampling importance resampling. The final model for somapacitan included body weight on relative bioavailability (Frel); body weight, sex, and race (Asian non-Japanese vs White/Other) on maximum IGF-I stimulation rate (Emax); body weight and race (Asian Japanese and Asian non-Japanese vs White/Other) on baseline IGF-I production rate (kin) as significant covariates. Body weight was the only significant covariate on somapacitan PK, and the analysis showed that, when dosing according to body weight (0.16 mg/kg/week), children are expected to have similar somapacitan exposure across demographic factors. The covariate effects identified on Emax and kin indicate differences in IGF-I concentrations (ng/mL) between the groups during treatment, and at baseline. However, these appeared to be correlated with age and sex, and no clinically meaningful covariate effects were found on IGF-I when evaluated as a change from baseline IGF-Iavg SDS. The final model for daily GH included body weight, sex and race (Asian non-Japanese vs White/Other) on Emax, as well as body weight and race on kin (Asian Japanese and Asian non-Japanese vs White/Other) as significant covariates.
How Does the IGF-I Profile of Somapacitan Compare to the one of Daily GH?
As expected, the weekly steady-state IGF-I SDS profiles were found to differ following 0.16 mg/kg/week somapacitan vs 0.034 mg/kg/day daily GH dosing in trials REAL 3 and REAL 4 (Fig. 1). The weekly IGF-I SDS profile for 0.16 mg/kg/week somapacitan was previously published for REAL 3 and REAL 4 and reached its maximum approximately 2 days after dosing [17, 19], differing from the estimated weekly profile of daily GH. In our analyses, the mean change from baseline for weekly IGF-Iavg increased 2.56 ± 0.76 SDS (mean ± SD) for somapacitan and 2.33 ± 0.86 SDS (mean ± SD) for daily GH after 52 weeks of treatment.
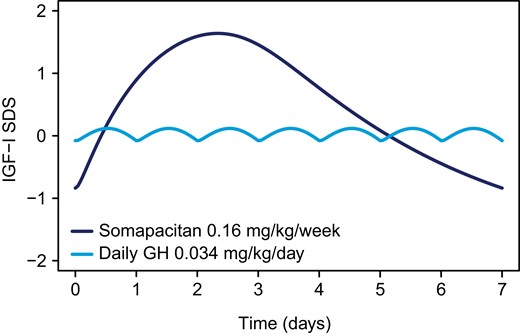
Weekly IGF-I response course for once-weekly somapacitan and daily GH at steady state in children with GHD. Estimated weekly IGF-I SDS profiles at steady state based on individual predictions of 146 subjects treated with 0.16 mg/kg somapacitan and 82 subjects treated with 0.034 mg/kg daily GH at week 52 in REAL 3 and REAL 4. Abbreviations: GH, growth hormone; GHD, growth hormone deficiency; IGF-I, insulin-like growth factor I; SDS, standard deviation score.
In REAL 3 and REAL 4, the distribution of IGF-I concentrations during the first year of treatment with 0.16 mg/kg/week somapacitan showed a low frequency of patients with IGF-Iavg above +2 SDS (2.7%) and none with IGF-Iavg SDS above +3 SDS. Overall, most patients (96.6%) in the trials achieved weekly IGF-Iavg within normal range (−2 to +2 SDS). IGF-I values for patients receiving daily GH in REAL 3 and REAL 4 were similar to those receiving somapacitan, showing a low proportion of patients with IGF-Iavg above +2 SDS (1.2%), no patients with IGF-Iavg above +3 SDS, and IGF-Iavg largely within normal range (−2 to +2 SDS) for most of the patients (95.1%).
How Can IGF-I Levels be Monitored Following Once-Weekly Somapacitan?
Linear models were established between individual estimated steady-state IGF-I concentrations (SDS and ng/mL) at different times after dosing (IGF-ITAD SDS and IGF-ITAD [ng/mL]) and weekly IGF-Iavg concentration SDS and IGF-Iavg absolute concentration (ng/mL) at steady state in 146 children receiving 0.16 mg/kg/week somapacitan for 52 weeks in the REAL 3 and REAL 4 trials. The difference between predicted IGF-Iavg SDS and IGF-ITAD SDS as well as IGF-Iavg (ng/mL) and IGF-ITAD (ng/mL) at each time point after dose is illustrated in Fig. 2A and 2B, respectively. Formulas were derived to allow approximation of IGF-Iavg SDS and IGF-Iavg (ng/mL) based on IGF-I SDS and IGF-I (ng/mL) concentration measurements on different days within the weekly somapacitan dosing interval (Table 2). Based on these analyses, the IGF-I value closest to IGF-Iavg occurs approximately 4 days (97-120 hours) after dosing. The correction factor at this time point can be considered negligible, so that no correction is needed. The peak IGF-I (49-72 hours after dose) was found to be approximately 1.0 SDS higher than the average IGF-I, which in turn was approximately 1.1 SDS higher than the trough IGF-I (145-168 hours after dose).
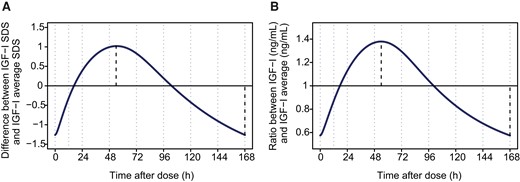
Calculation of approximate average IGF-I SDS and IGF-I concentration values over the weekly somapacitan dosing interval in children with GHD. Predicted difference between IGF-I SDS and average IGF-Iavg SDS and predicted ratio between IGF-I concentration (ng/mL) and IGF-Iavg concentration (ng/mL) at various times over the somapacitan weekly dosing interval. Average values were calculated based on formulas provided in Table 2. The dark line indicates the difference between (A) IGF-ITAD SDS and IGF-Iavg SDS and (B) IGF-I (ng/mL)TAD and IGF-I (ng/mL)avg, respectively. Dotted lines indicate time of maximum and minimum IGF-I SDS (A) and maximum and minimum IGF-I (ng/mL), respectively (B). Abbreviations: avg, average; GHD, growth hormone deficiency; h, hour; IGF-I, insulin-like growth factor I; TAD, time after dose; SDS, standard deviation score.
Calculation table for prediction of IGF-Iavg SDS and IGF-Iavg concentration (ng/mL) values by time after dose
| Calculating IGF-Iavg SDS | Calculating IGF-Iavg concentration (ng/mL) | |||
|---|---|---|---|---|
| Interval (time after dose) | Adjustment to measured IGF-I SDS to approximate IGF-Iavg SDSa | 90% prediction interval of IGF-I SDS adjustment value | Adjustment to measured IGF-I (ng/mL) to approximate IGF-Iavg (ng/mL)b | Coefficient of variation (%) of IGF-I (ng/mL) adjustment value |
| 25-48 hours | IGF-I SDS −0.8 | ±0.5 | IGF-I (ng/mL) × 0.8 | 9.0 |
| 49-72 hours | IGF-I SDS −1 | ±0.6 | IGF-I (ng/mL) × 0.7 | 8.3 |
| 73-96 hours | IGF-I SDS −0.5 | ±0.4 | IGF-I (ng/mL) × 0.9 | 7.4 |
| 97-120 hours | No adjustmentc | N/A | No adjustmentc | N/A |
| 121-144 hours | IGF-I SDS +0.7 | ±0.4 | IGF-I (ng/mL) × 1.3 | 10 |
| 145-168 hours | IGF-I SDS +1.1 | ±0.6 | IGF-I (ng/mL) × 1.6 | 15 |
Abbreviations: avg, average; CV, coefficient of variation; GHD, growth hormone deficiency; hrs, hours after dose; IGF-I, insulin-like growth factor I; PI, prediction interval; SDS, standard deviation score.
Adjustment of IGF-I SDS values should be performed by either adding or subtracting the value provided in the table according to the time point when the sample was obtained.
Adjustment of IGF-I (ng/mL) concentration values should be performed through multiplying by the factor provided in the table according to the time point when the sample was obtained.
Adjustment for values obtained 97-120 hours after dose is considered not to be required as the predicted adjustments of IGF-I SDS +0.1 (PI 90% +/0.3 SDS) and IGF-I (ng/mL) × 1.1 (6.9 CV%) are not clinically relevant.
In general, sample to sample variability should be expected during IGF-I monitoring for both somapacitan and daily GH. When accounting for the IGF-I profile over the week, as done using the modeling approach, the residual variability in IGF-I values was similar between somapacitan (21.3% coefficient of variation [CV]) and daily GH (23.8% CV). In addition, slight variations when monitoring IGF-I for somapacitan are expected, as profiles over the week vary among individuals. To quantify this variation, prediction interval (PI) of 90% and CVs were estimated when using the formulas parameter provided in the calculation table (Table 2) to predict IGF-Iavg SDS and IGF-Iavg (ng/mL) concentration values, respectively. Overall, the variability attributed to differences in profile were relatively small compared with the residual sample to sample variability, and the highest precision was obtained with samples taken 4 days (97-120 hours) after dose, where the 90% PI was ± 0.3 SDS or 6.9% CV on ng/mL scale (Table 2).
How do IGF-I and HV Respond to a Change in Somapacitan Dose?
An approximately linear relationship was found between somapacitan dose and IGF-I response in children with GHD (Fig. 3), indicating that a somapacitan dose change of 0.02 mg/kg is expected to result in a change in IGF-Iavg of 0.32 SDS (0.28; 0.37)95%CI. Significant exposure–response relationships between somapacitan exposure and HV as well as between change from baseline IGF-Iavg SDS and HV were observed after 52 weeks (Fig. 4A and 4B).
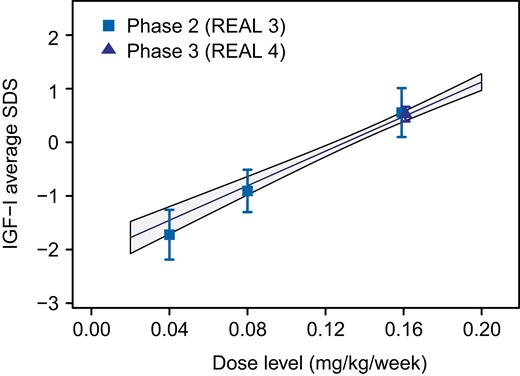
Somapacitan dose–IGF-I response relationship in children with GHD. Observed dose–response relationship between somapacitan dose and IGF-Iavg SDS at week 52 in REAL 3 and REAL 4 (symbols and bars indicate means with 95% CI of individual estimates). Lines with shaded areas show linear model estimated individual dose-response relationships with 95% CI. Abbreviations: avg, average; CI, confidence interval; GHD, growth hormone deficiency; IGF-I, insulin-like growth factor I; SDS, standard deviation score.
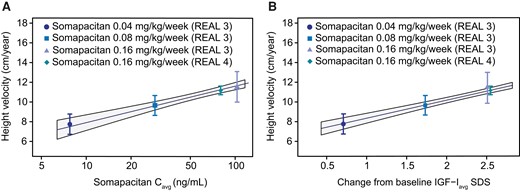
HV response relationship to somapacitan exposure and change from baseline IGF-Iavg SDS in children with GHD. (A) Observed mean HV at week 52 with 95% CI (points and bars) vs estimates of somapacitan Cavg by somapacitan dose level in REAL 3 and REAL 4. (B) Observed mean HV at week 52 with 95% CI (point and bars) vs estimates of change from baseline IGF-Iavg SDS by somapacitan dose level in REAL 3 and REAL 4. Lines with shaded areas are population predicted exposure-response relationships with 95% CI from model fit to subject level data. Abbreviations: avg, average; C, concentration; GHD, growth hormone deficiency; HV, height velocity; IGF-I, insulin-like growth factor I; SDS, standard deviation score.
What is the Expected IGF-I Response When Initiating Somapacitan in Treatment-Naïve Patients or in Patients Switching From Daily GH?
Simulations were used to illustrate expected IGF-I profiles when initiating somapacitan treatment in treatment-naïve patients and in patients switching from daily GH. After treatment initiation in GH treatment-naïve patients with 0.16 mg/kg/week somapacitan, steady-state IGF-I is reached within 1-2 doses (Fig. 5A). The IGF-I SDS profile when switching from daily GH treatment to once-weekly somapacitan was also simulated (Fig. 5B). The maximum IGF-I concentration at peak following the first somapacitan dose (8 hours after switch from last daily GH injection) is predicted to be 0.33 SDS higher than the somapacitan steady-state profile peak. Based on these analyses, steady state is expected to occur after the second somapacitan dose following a switch from daily GH.
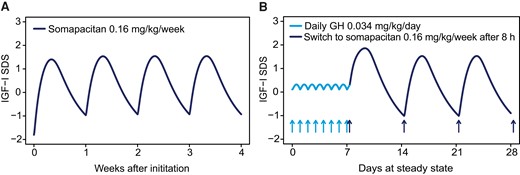
Steady-state weekly IGF-I SDS profile after initiation of somapacitan treatment in treatment-naïve patients and patients switching from daily GH. (A) After administration of somapacitan (0.16 mg/kg/week) in treatment naïve patients, steady-state IGF-I SDS is reached within 1-2 doses. (B) The typical IGF-I SDS profile when switching from daily GH to once-weekly somapacitan 8 hours after the last dose of daily GH (0.034 mg/kg). The maximum IGF-I SDS for the first somapacitan dose after the switch is predicted to be 0.33 SDS higher than for the somapacitan steady-state profile. Steady state is expected to occur after the second somapacitan dose. Abbreviations: GH, growth hormone; h, hour(s); IGF-I, insulin-like growth factor I; SDS, standard deviation score.
What is the Expected IGF-I Response When Changing the Dosing day or Missing a Dose?
Simulations were used to assess flexibility to dose up to 2 days prior (Fig. 6A) and 3 days after (Fig. 6B) the regular dosing day, followed by continued weekly dosing on the regular dosing day. After administering a dose 2 days early and then resuming the regular dosing day (ie, a 5-day-long dosing interval followed by a 9-day-long interval), the weekly peak and trough IGF-I SDS were predicted to be 0.19 SDS higher and 0.45 SDS lower than the regular steady-state profile, respectively. When administering a dose with 3 days delay (10- and 4-day dosing intervals), peak and trough IGF-I SDS were predicted to be 0.34 SDS higher and 0.61 SDS lower than the regular steady-state profile, respectively. IGF-I response reoccurred to steady state after 1-2 doses when weekly treatment of somapacitan at the regular dosing day was resumed.
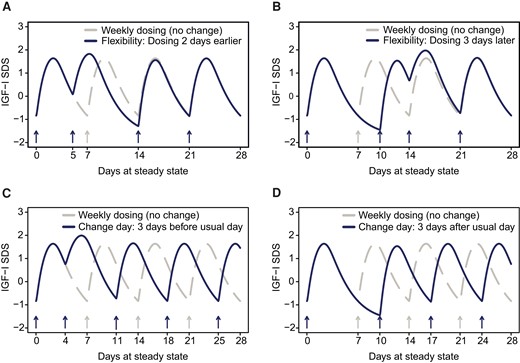
IGF-I response simulated for somapacitan flexible dosing and change of dosing day. (A) Flexibility to dose up with somapacitan to 2 days before the regular dosing day, then continue weekly dosing on the regular dosing day. The maximum and minimum IGF-I SDS observed after dosing were predicted to be 0.19 SDS higher and 0.45 SDS lower, respectively, compared to the regular steady state profile. (B) Flexibility to dose up with somapacitan to 3 days after the regular dosing day, then continue weekly dosing on the regular dosing day. The maximum and minimum IGF-I SDS observed after somapacitan dosing were predicted to be 0.34 SDS higher and 0.61 SDS lower, respectively, compared to the regular steady state profile. (C) Change of the regular dosing day of somapacitan by dosing up to 3 days earlier (ie, 4 days after the previous dose). The maximum IGF-I SDS observed after somapacitan dosing was predicted to be 0.35 SDS higher compared to the regular steady state profile, while no effect on trough IGF-I SDS were predicted. (D) Change of regular dosing day of somapacitan by dosing up to 3 days later. The minimum IGF-I SDS observed was predicted to be 0.61 SDS lower than the regular steady state profile, while no effect on maximum IGF-I SDS were predicted. Overall, the impact of the above changes to the regular dosing schedule of somapacitan on IGF-I profiles is considered minor, and steady state occurs 1 or 2 doses after regular weekly somapacitan treatment is resumed. A, B, C, and D: Solid lines are means of individual predictions. Dotted lines represent the regular dosing interval with no change of dosing day. Abbreviations: IGF-I, insulin-like growth factor I; SDS, standard deviation score.
Next, we assessed the change to a new weekly dosing day of somapacitan by dosing up to 3 days earlier (ie, 4 days after the previous dose) (Fig. 6C) or 3 days later (ie, 10 days after the previous dose), respectively (Fig. 6D). When shifting to a new dosing day by 3 days prior to the previous regular dosing day, maximum IGF-I SDS was predicted to be 0.35 SDS higher after dosing than the regular steady-state profile, while no effect on trough concentrations were predicted. When changing the dosing day by 3 days later than the previous regular dosing day, minimum IGF-I SDS was predicted to be 0.61 SDS lower than the regular steady-state profile, while no effect on maximum IGF-I concentrations were predicted. After the change to a new regular dosing day, IGF-I response returned to steady state after 1-2 weekly treatment doses of somapacitan when applied on the new regular dosing day.
Discussion
With the analyses presented here, we aim to inform physicians about correlations between once-weekly somapacitan dosing/exposure and IGF-I/HV response. Furthermore, our aim is to provide guidance in the clinical context of IGF-I monitoring during somapacitan treatment in children with GHD. In the current study, we compare effects on IGF-I SDS for patients treated with once-weekly somapacitan and daily GH and this supports our previously published results of phase 2 and phase 3 clinical trial data (REAL 3 and REAL 4) in prepubertal children with GHD [17, 19, 20]. We build upon these findings by quantifying the dose–IGF-I relationship and weekly IGF-I fluctuation to provide guidance on the impact of dosing and IGF-I monitoring. Finally, we expand on observations made in REAL 3 and REAL 4 by simulating IGF-I response after initiating somapacitan in treatment-naïve and previously daily GH-treated children with GHD, as well as following flexible dosing, changes in dosing day, and missed doses.
How Does the IGF-I Profile of Somapacitan Compare to the one of Daily GH?
Although the IGF-I SDS profiles differ between 0.16 mg/kg/week somapacitan and 0.034 mg/kg/day daily GH treatment, the increase in IGF-I (averaged over the course of the week) from baseline corresponded well between the treatments. As with daily GH, average IGF-I SDS at week 52 were within normal range (−2 to +2 SDS) for nearly all patients treated with somapacitan in the REAL 3 and REAL 4 trials, with none above +3 SDS. In line with this, observed data from the REAL 4 trial demonstrate that both groups, 0.16 mg/kg/week somapacitan and 0.034 mg/kg/day daily GH, showed a similar growth response in HV (noninferiority confirmed) and a similar change from baseline IGF-I SDS after 52 weeks [17].
How Can IGF-I be Monitored Following Once-Weekly Somapacitan?
IGF-I monitoring is an important element during GH treatment for long-term safety, adherence and to an extent to achieve optimal efficacy in children with GHD [4, 5, 30]. As demonstrated in this work, and previous publications [9, 17-19, 25], the IGF-I profile increases over the first 2-3 days after somapacitan administration and then declines towards a trough on day 7 just prior to the next administration of somapacitan. Similarly, studies with other once-weekly LAGHs, such as lonapegsomatropin and somatrogon, also show peak and trough IGF-I fluctuations over the course of the weekly dosing period [31, 32]. It is important to account for sampling time after dosing when treating patients with LAGHs and the medical community is therefore seeking specific guidance on monitoring IGF-I during treatment with LAGHs [10].
In this work, we used linear models to provide a quantitative solution to interpret IGF-I samples taken on any day after somapacitan dosing and derive estimated weekly average IGF-I SDS and average IGF-I concentration values with a simple calculation table. Thereby, weekly average IGF-I SDS values are calculated by either adding or subtracting a value according to the sampling time point, whereas weekly average IGF-I (ng/mL) concentration values are calculated through multiplying by a factor according to the sampling time point provided in Table 2. Results were approximated into a correction parameter for each daily interval (24 hours) for ease of use. Consistent with previously published findings [9, 17, 19], we show that an IGF-I sample taken 4 days (97-120 hours) after somapacitan dosing best captures the weekly average, and no correction is needed. However, compared with the weekly IGF-I SDS average, peak IGF-I SDS (49-72 hours after dose) is approximately 1.0 SDS higher, and this value should be subtracted, whereas trough IGF-I SDS (145-168 hours after dose) is approximately 1.1 SDS lower, this value should be added to derive the weekly average IGF-I SDS from samples taken 2 days (49-72 hours) and 6 days (145-168 hours) after dosing, respectively. For the weekly average IGF-I concentration value (ng/mL) prediction from a sample taken 2 days (49-72 hours) and 6 days (145-168 hours) after dosing, the IGF-I (ng/mL) laboratory value should be multiplied by 0.7 and 1.6, respectively. However, it should be noted that the precision of the calculated average is lower when samples are collected at either end of the dosing interval.
Variability in IGF-I values during monitoring is inherent with any GH treatment and was quantified for both somapacitan and daily GH. This study shows that the residual variability from sample to sample was similar for somapacitan and daily GH when accounting for the weekly fluctuation of the IGF-I profile following somapacitan. Hence, treating physicians can generally expect that their experience in terms of variations in IGF-I results during monitoring can be applied from daily GH treatment to somapacitan treatment if samples are either taken 4 days after dosing (no correction needed) or if the IGF-I result is converted to an estimated weekly average using the calculation table (Table 2).
The IGF-I calculation table is provided to estimate average IGF-I SDS and average IGF-I (ng/mL) concentrations based on blood samples taken on any day of the week. However, it should be emphasized that this tool is not generally approved for clinical use by regulatory authorities and results should always be interpreted in the context of individual clinical management. We further want to note that the analysis is limited to the scope of assessing the expected impact of sampling time during monitoring, dose–response, and dosing flexibility on IGF-I and that any potential effects on clinical outcomes have not been investigated.
How do IGF-I and HV Respond to a Change in Somapacitan Dose?
The relationships between somapacitan dose and IGF-I response have already been established in children with GHD, and the link from dose to IGF-I via nonlinear PK have been analyzed in detail with a population PK/PD analysis [19, 25]. In the current study, we approximated the relationship between somapacitan dose and IGF-Iavg SDS with a linear model to ease interpretation. A somapacitan dose change of 0.02 mg/kg is expected to result in an estimated IGF-Iavg change of 0.32 SDS. Thus, it is important to note that relatively small increments in somapacitan dose can provide clinically relevant changes in IGF-I concentrations. Consistent relationships were also observed between exposure, change from baseline IGF-I and HV with increasing doses of somapacitan. These results reassure that the dose-response relationship in pediatric GHD is well understood, and that the effects of different doses of somapacitan are predictable.
What is the Expected IGF-I Response When Initiating Somapacitan in Treatment-Naïve Patients or in Patients Switching From Daily GH?
Steady-state IGF-I is predicted to be reached after 1-2 somapacitan doses in both treatment-naïve patients and patients switching from daily GH. This is relevant because IGF-I monitoring is most reliable when done at steady state. For patients switching from daily GH to somapacitan, the stimulating effect of the last daily GH dose will be negligible after 8 hours due to the short half-life of daily GH. Thus, when initiating somapacitan treatment 8 hours or later after the last dose of daily GH, only a minor increase in IGF-I peak is expected compared with steady state following subsequent doses, and IGF-I should reach steady state after the second somapacitan dose. However, it should be noted that the analysis of somapacitan IGF-I levels was based on observed IGF-I data collected at the earliest 4 weeks after the baseline measurement for both treatment-naïve patients and patients switching from daily GH. While our model predicts a steady state after 1 or 2 doses, the earliest IGF-I samples available to confirm this were taken at week 4 after treatment initiation.
What is the Expected IGF-I Response When Changing the Dosing day or Missing a Dose?
Once-weekly somapacitan should be administered on the same day each week. However, on occasions when administration at the scheduled dosing day is not possible, our simulations indicate there is only minor impact on the IGF-I profile if once-weekly somapacitan is taken up to 2 days before or 3 days after the scheduled weekly dosing day—as long as the time between 2 doses is at least 4 days (96 hours). In such cases, once-weekly dosing could be resumed for the next dose on the regularly scheduled dosing day.
Changing the day of once-weekly somapacitan dosing can be done if, at the time of change, the time between 2 doses is at a minimum 4 days and a maximum 10 days. After selecting a new dosing day, the new once-weekly dosing regimen should be continued on the new dosing day. Simulations of IGF-I responses indicated that missing a dose, dosing flexibility, and change of dosing day had only minor impact on the IGF-I response since return to steady state occurred 1-2 doses after regular weekly treatment was resumed.
Conclusion
In the current work, we present model-based insights into once-weekly somapacitan dosing and IGF-I response in children with GHD compared with once-daily GH. Relationships were established between somapacitan dose, exposure, change from baseline IGF-I SDS and HV.
We provide an IGF-I calculation table with formulas to predict a patient's average IGF-I values from a single blood sample at steady state after 0.16 mg/kg/week somapacitan. With this we address a frequently asked question by physicians regarding the applicability of monitoring IGF-I in somapacitan-treated children with GHD. Our IGF-I calculation table may support physicians when monitoring IGF-I at any day during the weekly dosing interval.
In addition, we present a linear dose–response relationship between somapacitan dose and IGF-Iavg SDS response. Relationships between HV and somapacitan average concentration and between HV and change from baseline IGF-Iavg SDS were established. Further, we provide guidance for physicians when initiating the switch from daily GH to once-weekly somapacitan and present which IGF-I concentrations they can expect after the first dose of somapacitan has been given at least 8 hours after the last daily GH dose. Finally, our modeling analysis support flexibility to change the dosing day by up to 3 days before or after the regular dosing day and predicts only a minor impact on the IGF-I profile. In all cases, IGF-I steady state is assumed to reoccur 1-2 doses after resuming a regular once-weekly treatment schedule.
Overall, the results of our modeling study support existing clinical data of the observed somapacitan dose exposure response relationship in children with GHD. With our IGF-I calculation table physicians may have a practical tool to quickly estimate expected mean or maximum IGF-I concentrations in a clinical practice setting irrespective of the sampling day. The results can help set expectations for IGF-I response when changing dose, initiating therapy and applying dosing flexibility.
Acknowledgments
The authors thank the patients, nurses, study coordinators and all investigators involved in the 3 trials, without whom this study would not have been possible. The authors also thank Sebastian Röhrich and Anna Wickenberg of Novo Nordisk for reviewing the manuscript. Medical writing and editorial support were provided by Kati Rehberg, PhD, and Ryan Ard, PhD, of Novo Nordisk A/S. Novo Nordisk was involved in the study design, collection, analysis, interpretation, and presentation of data.
Funding
This work was supported by Novo Nordisk A/S.
Disclosures
R.J.K.: Novo Nordisk employee and shareholder. P.F.B.: Consultant for, and has received honoraria from Novo Nordisk, Novartis/Sandoz, Ascendis Pharma, BioMarin Pharmaceutical, Tolmar Pharmaceuticals, Cavalry Biosciences and Ipsen, and receives research support from Novo Nordisk. M.H.: Novo Nordisk employee and shareholder. J.C.B.: Speaker fees from Novo Nordisk, Pfizer and Ipsen; Financial support to attend scientific meetings from Novo Nordisk. B.S.M.: Consultant for AbbVie, Ascendis Pharma, BioMarin, Bristol Myers Squibb, EMD Serono, Endo Pharmaceuticals, Novo Nordisk, Pfizer, Proventionbio, and Tolmar; Research support from Alexion, AbbVie, Aeterna Zentaris, Amicus, Lumos Pharma, Lysogene, Novo Nordisk, OPKO Health, Pfizer, Prevail Therapeutics and Sangamo Therapeutics. J.M.: Speaker fee from Novo Nordisk, Pfizer and JCR; Advisory board for Novo Nordisk. Y.K.L.: Novo Nordisk employee and shareholder
Data Availability
Some or all datasets generated during and/or analyzed during the current study are not publicly available but are available from the corresponding author on reasonable request.
Clinical Trial Information
NCT01973244 (registered 22 October 2013), NCT02616562 (registered 25 November 2015), and NCT03811535 (registered 18 January 2019).
References
Abbreviations
- CV
coefficient of variation
- GH
growth hormone
- GHD
growth hormone deficiency
- HV
height velocity
- IGF
insulin-like growth factor
- LAGH
long-acting growth hormone
- LLOQ
lower limit of quantification
- PI
prediction interval
- PK/PD
pharmacokinetic and pharmacodynamic
- SC
subcutaneous
- SDS
SD score
- TAD
time after dose
