


Abstract
This paper investigates the short- and medium-term impact of a randomized group-based early child development program targeting parents of children aged 6–24 months in a poor, rural district of Rwanda. This low-intensity, short-duration, and low-cost program engaged parents through sessions that included a novel radio show and facilitated discussions during 17 weekly village-level meetings. The intervention included two treatment arms, with different components. Twelve months after baseline, children’s communication, problem-solving, and personal social skills improved in treated groups and persisted almost 3 years later in the full treatment arm. Positive effects on maternal time investments, attitudes, and beliefs, as well as investments in play resources, also persisted over time. A mediation analysis shows that the positive impact observed in child development can be attributed to positive changes in parental and home environment inputs, particularly in the longer term. This study offers important insights for the design and delivery at scale of early child development interventions among some of the most disadvantaged communities in the world.
A set of Teaching Slides to accompany this article are available online as Supplementary Data.
1. Introduction
Millions of children from low-income countries are at risk of not reaching their development potential due to extreme poverty (Grantham-McGregor et al. 2007). Children from poor families accumulate developmental deficits from a very early age (Cunha and Heckman 2007; Lu, Black, and Richter 2016), with severe consequences for human capital accumulation (Almond, Currie, and Duque 2018). These adverse effects can be transmitted across generations, creating severe poverty traps (Doepke, Sorrenti, and Zilibotti 2019). As such, early childhood interventions have been shown to be particularly valuable to improving child development outcomes when they target disadvantaged families (Heckman 2006; Walker et al. 2011; Gertler et al. 2014). This is especially the case of increasingly popular interventions that aim at improving parenting attitudes and behaviors that shape child development outcomes (Britto et al. 2017).
However, much of the existing evidence on early child development programs draws on interventions implemented in advanced economies or in middle-income countries that rely on reasonably well-functioning welfare systems and far-reaching bureaucracies (Andrew et al. 2018; Doyle 2020; Sylvia et al. 2021). In contrast, we have to date only limited knowledge about what early child development interventions may be affordable, sustainable and scaled up in low-income contexts, especially in Sub-Saharan Africa. First, it is an open question how governments in low-income countries should design and implement early child development programs to address the dire needs of vulnerable parents and children in ways that generate relevant and persistent impacts to those families—and hence break a known poverty trap mechanism—while ensuring the necessary uptake among targeted communities and navigating their own budgetary and institutional constraints.1 Second, low-income parents face multiple trade-offs when trying to ensure family survival and may not afford the time to engage in close interactions with small children when that takes time away from productive activities, or the cost of acquiring books, playing materials, and nutritious food for their younger children. Low literacy rates and low levels of education also mean that existing parenting programs involving activities such as book reading and other cognitive development activities may be challenging to implement.
To address these pressing questions, Save the Children designed, in discussion with the Government of Rwanda, a unique low-cost, low-intensity early child development parenting program (called First Steps or Intera za Mbere), with the intention of scaling it up to the national level. This paper evaluates the short- and medium-term impact of the program pilot. We provide some of the first evidence of how, in contexts where parenting inputs are very low due to low literacy levels, lack of knowledge, and income constraints,2 modest interventions to strengthening knowledge about parenting and acting upon this knowledge can improve child well-being and change key parental outcomes.3 Due to the design of two treatment arms with different components and novel delivery mechanisms, our study allows us also to identify features of the program that may be potentially scalable, affordable, and sustainable at the national level, potentially without the need to be integrated in existing national welfare programs, a question that remains open in the literature.
First Steps was developed and implemented by Save the Children UK and Save the Children Rwanda, in collaboration with Umuhuza, a Rwandan NGO, and evaluated in collaboration with the Institute of Development Studies in the UK. The program is a group-based parenting intervention structured across 17 weekly meetings. It targets parents of children aged 6–24 months in remote communities in the (rural) Ngororero district in the Western province of Rwanda. Ngororero is one of the poorest and most remote areas of Rwanda, itself one of the poorest countries in the world. Almost half of its population is under the poverty line and over one-fifth is in extreme poverty (NISR 2016). Fifty-six percent of children under 5 years old are stunted, compared to 38% at the national level (DHS 2015b).
First Steps was specifically designed to address the needs of these remote, rural families living in extreme poverty. It does so through the use of novel methods and delivery tools aimed at breaking down known human capital, information, resource, and other uptake barriers among deprived populations. As such, it is a unique intervention in the early child development literature. First, to address literacy and education constraints, instead of standard parenting training using only reading materials, the First Steps team designed and implemented an innovative radio drama aired during the group meetings, where each episode focused on a key parenting practice. The radio drama was both preceded and followed by group discussions with trained facilitators drawn from each village, who went over the script of the radio program and worked with the parents to reinforce its messages. Second, First Steps focused many of its interventions at the community-level (by drawing on local volunteers, group radio listening and group discussions), in contrast with the focus on households, common in other known parenting programs (Grantham-McGregor et al. 1991). This was intended to better facilitate the diffusion of ideas and information, as well as strengthen peer-to-peer learning among community members looking after young children (often jointly). This focus has the additional effect of reducing the costs of the program in relation to other interventions that rely more closely on costly one-to-one home visits. The use of facilitators living in each villages also ensured costs were kept low, while strengthening trust between the program and local communities. Indeed, the program was very low-cost. The cost per caregiver per session of First Steps ranged between |${\$}$|1.94 and |${\$}$|2.11, depending on the composition of each treatment arm. These figures are substantially lower than other comparable early child development interventions evaluated in the literature.4 Third, to reduce time and budgetary constraints often faced by low-income families, First Steps centered its activities around family daily routines and used household resources as learning tools.5 This approach aimed at limiting known trade-offs faced by very low-income families between time and financial investments in young children, time spent in productive activities, and investments elsewhere in the household (for instance, on food, clothing or education of older children).
The program was designed as a cluster-randomized controlled trial with two treatment arms and a control group. In the light treatment (LT) group, parents attended 17 weekly meetings, which included the group radio listening component and discussions led by a trained village facilitator. The full treatment (FT) group received further additional inputs: a second supervising facilitator, one home visit, and a children’s book gifted to each family.6 The design of these two treatment arms allows us to study in detail what components of First Steps (and how) may ensure longer term effects and thus be feasibly scalable.
We collected baseline, end-line, and follow-up data in August 2015, September 2016, and May 2018, respectively. The intervention started in November 2015 and ended in April 2016. We evaluate the impact of the program after 12 months, and again almost 3 years after its implementation. This is an important contribution as few existing early child development interventions are evaluated also over the longer term, particularly in low-income countries (Wang et al. 2021). We collected information on three sets of outcomes. First, we analyze the short-term (12 months) and medium-term (33 months) impact of First Steps on key dimensions of child development: communication ability, gross motor skills, fine motor skills, problem solving ability, and personal social interactions. Second, we gathered information on parenting outcomes that are at the core of children’s human capital production function, particularly during their early stages of life (Attanasio et al. 2020a). These include parental time investments in interactions with the child, and investments in play materials. Third, we were able to analyze the effect of the program on additional important determinants of parental behavior, such as parental perceptions of their ability to influence their children’s development trajectories (parental self-efficacy (PSE)), attitudes toward child development and gender norms, locus of control, and own aspirations. These are important outcomes because they may reinforce any positive impacts of the program and help sustaining them over the longer term, with potential normative spillovers at community level (Judge and Hurst 2007; Dercon et al. 2012).7 One outstanding debate in the literature relates to the mechanisms that may explain the impact of early child development interventions (Attanasio et al. 2020a). To address this, we make use of a simple theoretical framework and conduct a linear mediation analysis that allows us to identify the role of parental and home environment inputs on child development outcomes across different time periods (Heckman, Pinto, and Savelyev 2013). This analysis is crucial to understand the role of different inputs in the human capital accumulation process.
We report in the paper three main findings.8 First, we show that both the LT and FT arms of First Steps had a positive and substantial impact on child development outcomes after 12 months, with several effects continuing 33 months after the implementation of the program, albeit largely among the FT arm. Children whose parents participated in First Steps experienced an increase of 0.3 (LT) and 0.4 (FT) standard deviations (SD) in the aggregate average index of child development outcomes, relative to children in the control group 12 months after the intervention. The effect sizes are large and in line with effects reported in recent evaluations in more advanced economies (Carneiro et al. 2019; Doyle 2020).9 After 33 months, the FT arm still shows considerable effects (0.2 SD). These results add new insights to a large literature on the importance of early age interventions for long-term human capital development. Well-known interventions in the early child development literature have shown mixed effects over the longer term (Walker et al. 2005; Heckman et al. 2010; Gertler et al. 2014; Bailey et al. 2017; Andrew et al. 2018), which raise doubts about the feasibility of scaling-up such programs at the national level, especially in low-income countries where several possible anti-poverty interventions compete for scarce fiscal resources. We show that First Steps can produce effects that persist across time amongst some of the most deprived communities in the world at low cost.10 Although we are not able to evaluate each individual component of the two treatment arms, we postulate that the use of a low cost radio intervention may be largely responsible for these results in a context of such low literacy rates among parents.11 The stronger effects we find for the FT suggest further that additional components in the form of extra facilitation, one home visit, and a book gift may have contributed further to breaking uptake barriers to parenting improvements in low-income settings.12 All these components provide viable entry points to scaling up the program.
Second, we find large short-term (12-month) and medium term (33-month) impacts of both the LT and FT arms of First Steps on parental time investments. We also find large medium-term effects of both treatments on investments in play material resources in household. These are important results, which, taken together with the results above, strongly suggest that using delivery tools in parenting training interventions that align with the particular needs of low-income families may break well-known time and information barriers faced by these families. Since these barriers are common across all low-income countries, these delivery methods are likely to offer opportunities for improved early child development and parenting practices well beyond Rwanda. We find also positive impacts of the program on maternal perceived efficacy over their child’s development (in short term), attitudes towards gender roles, locus of control, and on aspirations, all normative changes that arguably may be able to sustain the impact of the program over the longer term.
Third, we address explicitly the “how” question to try to understand what mechanisms may explain such strong effects. The mediation analysis we conduct shows that maternal time investments yield important returns in terms of child development outcomes, which account for between 20 and 35% of, respectively, the short- and medium-term impacts of the First Steps program on child development outcomes. Material investments account for about 20% of the medium-term impact of the program, whereas maternal attitudes, locus of control and aspirations account for about 10% of the medium-term impact of First Steps. Although this analysis cannot be interpreted as fully causal, it goes a long way to show that changes in parental behavior in the form of increases in maternal time and material investments, and partly their attitudes and beliefs, play an important role in ensuring the persistence of the positive effects of the intervention over the longer term. This finding speaks to recent models of parenting, whereby child human capital production functions have been modified to include parenting inputs (e.g., practices, knowledge, skills, attitudes, and beliefs) as important elements in the production of children’s cognitive and non-cognitive skills (Cunha, Elo, and Culhane 2013; Britto et al. 2017; Doepke, Sorrenti, and Zilibotti 2019; Doyle 2020; Attanasio et al. 2020a). We show that these changes in parental practices and behaviors can be achieved by a relatively short and modest intervention amongst some of the most deprived and time-constrained households in sub-Saharan Africa.
Overall our findings offer specific entry points to implementing early child development interventions at scale using simple and low-cost activities in Rwanda that could be used in many other low-income countries with weak institutional capacity without the need of integrating into existing large national welfare programs.
The remainder of the paper proceeds as follows. Section 2 provides the background of the study and a description of the program, its design, and sampling strategy. Section 3 describes the data collected and the main outcomes of interest. Section 4 discusses the empirical strategy, and Section 5 presents the main findings. Section 6 shows results from heterogeneous treatment effects. Section 7 discusses potential mechanisms and results from the mediation analysis. Section 8 concludes the paper.
2. Setting and Experimental Design
2.1. The First Steps Program
First Steps is a participatory program in which parents, with their children, are invited to attend 17 weekly group meetings.13 During the weekly meetings, parents meet in a central location in their village (e.g. primary school, village leader office, or outdoors) to reflect about the previous week’s session, listen to a new episode of a radio drama, discuss its content with a local facilitator, and learn simple, age-appropriate activities and games they can use at home to support their child’s development. The radio drama was developed by Save the Children and Umuhuza, a local NGO. The 17 episodes depict a fictional community in which a parenting program is being implemented and each episode lasts around 15–20 minutes. The facilitator discusses the radio episode with the parents for about 30 minutes to 1 hour. The engaging plot follows the change experienced by the characters as they addressed various parenting practices, attitudes, and beliefs, including the role of fathers in childcare and development. The radio program is both preceded and followed by a participatory conversation between the village facilitator and the parents. The meetings also involve parents practicing games and activities with their children. The aim of these group sessions is to improve the quality of parent–child interactions and to equip parents to engage with their children in developmentally appropriate learning activities, centered around daily routines and using household resources as learning tools.14 It also aims to support parents with knowledge about feeding, nutrition, and child health.15
The village facilitators are drawn from a network of local women and men.16 Facilitators receive training during 3.5 days and are paid 4,000 RWF per month as an incentive (approximately 5 USD). All village facilitators also receive an activity booklet, which outlines the activities, games, and key messages to share with parents in each session. In the FT villages, one additional supervising facilitator is recruited at the cell level to support the village facilitators. These facilitators are trained for the same amount of time and receive a slightly higher payment (4,500 RWF per month). The delivery of First Steps by facilitators trained by the program and drawn from the local community with no specific prior experience or expertise is a key feature of the program, which promotes trust between families and the program and keeps costs relatively low.17
Online Appendix Section A.1.1 outlines the costs of the program (see Online Appendix Table A.1) and provides a comparison with the costs of other early child development programs implemented in low or middle income contexts. The closest program with similar components to First Steps studied in Carneiro et al. (2019) (the Nadie es perfecto—NEP, implemented in Chile) reports cost per child per session of |${\$}$|1.59 for the component with caregivers group meetings and |${\$}$|2.12 for the component with two additional sessions where children participate together with their parents. Carneiro et al. (2019) highlight this as an extremely low cost intervention as compared to others that, for example, deliver part of the program through home visits (as in Attanasio et al. 2022). Our study’s costs are comparable with the NEP intervention, but with the additional inclusion of the radio component, an important feature in contexts of very low-literacy rates, which is not the case of Chile. In Online Appendix Table A.2, we report a summary of costs and estimated impacts of other studies that evaluated similar programs (Yousafzai et al. 2014; Ozler et al. 2018; Ahmed, Hoddinott, and Roy 2019; Attanasio et al. 2022). As we summarize in Online Appendix Section A.1.1, the estimated costs of these studies are higher than those reported for First Steps. Although none of these interventions is directly comparable in content and duration, this exercise provides an idea of the competitiveness of First Steps in comparison to other programs. A comparison of the estimated impacts on child development outcomes shows that we have impacts similar in magnitude to other well-known programs but orders of magnitude cheaper.
2.2. Study Design and Sample Selection
The intervention was evaluated using a cluster-randomized controlled trial with a control group and two treatment arms. Within the Ngororero district, nine sectors (out of 13) were selected for the study (see Online Appendix A.2 for further details about the sample selection and intervention areas). The intervention was randomly assigned at the sector level to three groups, composed of 27 villages each: a control group, an LT group, and an FT group. The control group did not receive any treatment: parents were invited to participate in the program but were told that they would be offered it at a later date.18 Both LT and FT groups were offered group-based parenting sessions supported by a village facilitator, as described above. In addition, the FT group also received (i) additional inputs from a supervising facilitator recruited at the cell level to support the village facilitators; (ii) one home visit by the village and cell-based facilitators; (iii) provision of leaflets for parents to take home after each session reminding them of each session contents; and (iv) a child’s book gifted to each household upon completion of all sessions.
The program was randomized at the sector level because the weekly meetings included the live radio component. Therefore, by implementing the intervention arms at the sector level, risks of contamination were reduced as control villages were less likely to hear about the First Steps radio program from sector officials or from First Steps participants in community events. These villages did not receive information about the group meetings or the radio show air dates and time. A not very popular radio station was selected to reduce the likelihood that the control group would accidentally listen to the program.
In all selected villages—whether treatment or control—all families with a child aged between 6 and 24 months were eligible to participate in the program, and all eligible families were invited to participate. Participation of parents in the First Steps meetings was voluntary. Almost all families who were offered participation in the study accepted and participated in at least one session. Compliance rates, calculated as the ratio between the number of participants at end-line and the number of people assigned to the treatment at baseline, was 85% for the FT group and 89% for the LT group.
3. Data and Measurement
3.1. Data
Figure 1 presents an illustrative depiction of the timeline of the evaluation of First Steps. At baseline (August 2015), the study included an average of 540 children in each intervention arm, resulting in a total sample of 1,614 children and their parents. In September 2016 (end-line), due to an average attrition rate of 10%, the total sample included 1,452 children and their parents. In May 2018 (follow-up), we were able to track and interview 1,320 parents and 1,278 children.19 We tested for differential attrition in group assignment and baseline characteristics. These include also baseline levels of child skills, maternal time investment, and influence measures and their interactions with the treatment dummies. Overall, there does not seem to be differential attrition between treatment groups, with a few exceptions. To further account for potential differential attrition across treatment groups, we estimated treatment effects using inverse probability weighting (IPW) that adjusts any potential attrition bias by weighting the observations with the inverse of the probabilities of not dropping out of the sample. All results are consistent with our main findings, and discussed in detail in Online Appendix Section C.2.
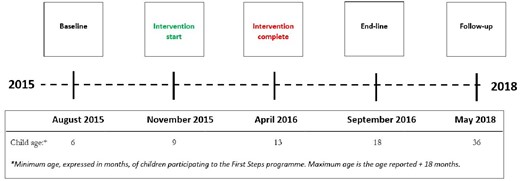
Timeline.
3.2. Measurement
Our aim is to estimate the impact of the program within the context of a child development production function. To this purpose, we follow the frameworks proposed in Attanasio et al. (2020a) and Cunha, Heckman, and Schennach (2010) and consider the following general production function for child cognitive and non-cognitive skills:
where |$\theta _{0}$| and |$\theta _{t}$| are measures of child development at baseline and at end-line or follow-up, respectively. |${T}_{t}$| are direct inputs from the treatment (e.g., time spent in the parenting meetings with the facilitators); |$I_{t}$| are parental time investments that take place during the intervention period; and |$S^{\tau }_{t}$| include type |$\tau$| measures of parental attitudes and beliefs that manifest during the intervention period. In the short-term impact analysis, this measure includes maternal influence only. In the medium-term analysis, this measure includes maternal self-efficacy, maternal attitudes toward child development, locus of control, and maternal aspirations about their children. These measures are only available at follow-up.20|$B_{t}$| is a measure of material resources available in the home environment (e.g., play materials). This measure is also only available at follow-up. |$X_{0}$| is a vector of household and parental characteristics measured at baseline and |$\eta _{t}$| are random shocks to child development.21 We describe each of these measures in the subsections below.
3.2.1. Child Development Measures
We collected data to measure child development skills (|$\theta$|) using an adapted translated (into Kinyarwanda) version of the Ages & Stages Questionnaires 3rd edition (ASQ henceforth). The ASQ is a well-established child development screening tool and is implemented without the need for additional professionals.22 The caregiver is required to interact with the child, while the enumerator observes and records the information.23 These observations include activities in the domains of communication, gross motor skills, fine motor, problem solving, and half of the questions on personal social skills. The other half of the questions on personal social skills are self-reported by the caregiver. Because self-reported answers may be subject to potential social desirability bias, we have conducted exercises to assess the potential extent of such a bias. This analysis is reported in Online Appendix Section C.3 and suggests that social desirability bias is not driving the estimated impact of First Steps on child development outcomes. Online Appendix Section A.3.1 provides detailed information about the ASQ tool and the construction of the main outcome variables. To draw general conclusions about the experiment’s results and to address the problem of testing multiple hypotheses, we aggregated the five indicators into one mean index defined as “child development aggregate index” that aggregates information over multiple treatment effect estimates (Kling, Liebman, and Katz 2007).24
3.2.2. Parental and Home Environment Measures
In addition to the child development outcomes, we also collected detailed data on the home environment, parenting practices, and parental behavior using the Home Observation for Measurement of the Environment—Short Form (HOME-SF) tool adapted for the Rwanda context. Online Appendix Section A.3.2 provides detailed information about this tool and the variables we constructed.
Parental time investment. The questionnaire includes questions about primary caregivers’ time investments (I) in activities they engage with their child, which allows us to investigate how parental engagement may mediate the impact of the program on child development outcomes. Information collected includes the frequency of interactions across a set of activities the primary caregiver performed with her child and similar practices followed by her/his partner. In most cases (93%), these questions were answered by the mother, who answered questions for herself and also on behalf of her husband. In 5% of the cases, the principal caregiver was the father. In approximately 2% of the cases, the principal caregiver was neither the mother nor the father.25
The caregiver was asked to report about the frequency of interactions with the child across 18 activities, including (i) positive discipline activities, such as praising, appreciation, and soothing when the child is upset; (ii) learning/play activities, such as playing, singing, and reading picture books; and (iii) negative discipline activities, such as criticizing, threatening, hitting, pushing, and spanking the child. For each activity, we created a standardized score by subtracting the control group mean and dividing it by the control group standard deviation of the relevant survey wave. We constructed an aggregate index by taking the average of the standardized scores. The resulting indicator is defined as maternal time investment.26 As time investment is self-reported by the respondent there might be concerns that the results might be driven by social desirability bias. We discuss this concern in detail in Online Appendix Section C.3. Results from empirical checks strongly suggest that our results are not substantially driven by social desirability bias.
Parental influence and self-efficacy. As part of the HOME-SF questionnaire, we recorded information about parental influence across six dimensions of their child’s lives: (i) child’s learning, (ii) child development, (iii) nutrition, (iv) child care, (v) discipline or child guidance, and (vi) health care. During the follow-up survey, we collected PSE measures administering the Tool to Measure Parenting Self-Efficacy (TOPSE) (Kendall and Bloomfield 2005). In this questionnaire, the respondent was asked to provide answers about self-efficacy statements using a scale from 1 (disagree a lot) to 5 (agree a lot) across eight different dimensions: (i) emotion and affection; (ii) play and enjoyment, (iii) empathy and understanding; (iv) control; (v) discipline and setting boundaries; (vi) pressures; (vii) self-acceptance; and (viii) learning and knowledge.27 We investigate the impact of First Steps on PSE, in line with other recent studies (Doyle et al. 2017; Carneiro et al. 2019; Attanasio, Meghir, and Nix 2020b). Parent training interventions had shown in the past how PSE can be increased (Tucker et al. 1998; Barlow et al. 2012), and as a mechanism for parenting behavioral changes targeted by early child development interventions.28 In our framework, parental influence and self-efficacy beliefs enter the child production function as a type |$\tau$| of measure |$S^{\tau }$|.
Parental attitudes, locus of control and aspirations. We expanded the HOME-SF at follow-up by asking questions on parental attitudes about child health, behavior, development, and gender roles in the household, locus of control, and caregiver’s aspirations for themselves and their children. This is because we were interested in exploring whether these additional dimensions could have been impacted by the participation to the program. Indeed, one of the guiding principles of working with the families during the group sessions was to empower families by providing the support they needed based on their strengths as a family, what they desire for their child, and their culture and values. Hence, during the sessions, the facilitators highlighted the importance of parental self-image, confidence, and aspirations for child development. The existing literature indeed highlights the role of parental beliefs and attitudes in shaping the development of a child. Indeed, a change in these dimensions could influence the quality and effectiveness that parental investments may have on children development outcomes (Dercon et al. 2012; Cunha, Elo, and Culhane 2013; Carneiro et al. 2019; Attanasio et al. 2020a). These outcomes measure another set |$\tau$| of the maternal attitudes and beliefs dimension (|$S^{\tau }$|).
Material resources in the home environment (B). We asked the caregiver whether the child played with homemade and shop toys, with objects in or outside the household, and with drawing material, puzzles, color, size, and counting games. These measures can be intended as a proxy for parental material investment.29
3.3. Descriptives
3.3.1. Baseline Balancing
We examined whether observable baseline characteristics were balanced among treatment arms. Column (1) of Online Appendix Table B.1 shows the averages for control group characteristics. Columns (2) and (6) show the mean differences between characteristics of LT and FT, and control groups, respectively. Column (10) shows mean differences in baseline characteristics between LT and FT groups. The average child development raw score based on the ASQ is 40 at baseline (out of a maximum score of 60) and largely similar across the five dimensions.30p-values in columns (3) and (4) show that some child and parental characteristics in the LT group are not fully balanced with respect to the control group mean at baseline. The LT group also displays higher ASQ scores at baseline than the control group. Moreover, we observe that some variables (child age, household size, parents’ education, and marriage status) show statistically significant differences at baseline between the LT and FT groups (columns (10) and (11)). In Online Appendix Section C.4, we provide results from empirical checks that account for the observed imbalance in some of the baseline characteristics. First, we checked whether the source of imbalance in the LT group is driven by a specific group and ran a specification that excludes from the sample the group of children potentially driving the imbalance. Second, we added in the specification all control and outcome variables at baseline demeaned and interacted with the treatment terms. Third, we estimate two models using IPW that adjust for any difference in the pre-treatment variables if their distribution varies across treatment statuses. All results are robust to the tests performed, which reassures us that these imbalances are not likely to affect the final results. We calculated in addition randomization inference p-values that are largely consistent with the main estimates (results discussed in Online Appendix Section C.4).
3.3.2. Program Participation
In Online Appendix Table B.2, we report participants’ reported attendance by treatment arm and provide tests of equality across groups.31 Panel A shows that on average parents reported having attended 12 sessions out of a total of 17 sessions. On average, 86% of mothers attended the sessions alone. Ten percent of mothers participated in First Steps jointly with their husband. Only 1.2% of fathers participated alone. Panels B and C show descriptive evidence on the recall of sessions’ main topics covered and key messages delivered during the training. In Panel B, we observe that around 70% of parents recall information about child development and around 50% recall nutrition, responsive caring, and play as the main topics covered during the sessions. A larger proportion of participants in the FT recall the topics covered during the sessions relative to the LT group. Descriptive statistics in Panel C show that most respondents remember at least one message. Talking, singing, showing books, playing, and providing love and affection are the most recalled messages by participants. With respect to correlates of take-up, as expected, the data show that program’s attendance intensity is positively correlated with mothers’ education and household wealth (Online Appendix Table B.3).
4. Empirical Strategy
The randomized nature of the First Steps intervention allows us to identify the causal impact of the program on child development, parenting, and home environment outcomes. To that purpose, we estimated the following model for each survey round:
where |$y_{ijt}$| is the outcome for individual i, in sector j surveyed at time t. t is equal to 0 for baseline, to 1 for end-line, and to 2 for follow-up observations. We estimated equation (2) for each round separately. The terms |$T^{L}_{j}$| and |$T^{F}_{j}$| are binary indicators for LT and FT sector-level interventions. |$y_{ij0}$| is the baseline level of the outcome for individual i in sector j and |$X_{ij0}$| are baseline characteristics. In order to increase precision and account further for any imbalance at baseline, the regressions control for child age and gender, number of children in the household, the primary caregiver age, binary indicators about whether the mother and the father completed at least primary education, whether the respondent is married, and a household asset index.32 Detailed definitions of these variables are provided in Online Appendix Section A.4.
The parameter of interest is |$\beta$|, the average difference between treatment and control observations in end-line and/or follow-up surveys. Under the assumption that the control observations constitute a valid counterfactual for the treatment sample, this measure is the intent to treat (ITT) estimate, which identifies the causal effect of the program on parents who attended the parenting sessions and on their child.
Since the randomization was implemented at the sector level and observations might be correlated within clusters, we clustered the standard-errors at this level. However, as the number of clusters is small (nine clusters), our standard errors might be biased downward (Bertrand, Duflo, and Mullainathan 2004). Therefore, our statistical inference is based on a bootstrap t-test using the wild-cluster bootstrap procedure, which allows us to estimate precise estimations of p-values with less than ten clusters, as in our case (Cameron, Gelbach, and Miller 2008; Roodman et al. 2019). In Online Appendix C.4, we report tests on the sensitivity of our results by estimating standard errors using three additional different procedures proposed by MacKinnon and Webb (2018) and Tyszler, Pustejovsky, and Tipton (2017) to account for this concern. All results are robust to the different procedures.
We note too that, given the small number of clusters, our study may not have been powered enough to detect effects for some of the outcomes. Therefore, for each domain, we calculated ex-post minimum detectable effect size (MDE) using realized sample size and estimated standard errors (Haushofer and Shapiro 2016; McKenzie and Ozier 2019). We discuss power calculations and ex-post MDEs in Online Appendix Section C.5, and calculate randomization inference p-values to further address these concerns in Online Appendix Section C.4.
The presence of multiple outcomes in this study creates the potential problem of cherry-picking significant estimates and the need to correct for multiple hypothesis testing. We use the Romano and Wolf (2005) correction to address the possibility of arbitrarily selecting statistically significant treatment effects and to reduce the likelihood of family wise type-I error (FWER). Online Appendix Section C.6 provides a detailed description and discussion of this correction.
Finally, we follow the literature (Cunha, Heckman, and Schennach 2010; Attanasio et al. 2020a; Sylvia et al. 2021) to deal with the concern that all sets of (observed) measures described in Section 3.2 may be measured with some error and not reflect underlying latent factors. We formalize below the measurement system and provide a detailed description in Online Appendix C.8.
We estimate the following measurement system linking observed measures to latent factors33 at baseline, end-line, and follow-up:
where |$y_{im}^{\theta }$|, |$y_{im}^{I}$|, |$y_{im}^{S}$|, and |$y_{im}^{B}$| denote the mth observed measure for child i of, respectively, child skills |$\theta$|, parental time investment I, parental attitudes and beliefs S, and material resources in the home environment B. |$\mu ^{\theta }_m$|, |$\mu ^{I}_m$|, |$\mu ^{S}_m$|, and |$\mu ^{B}_m$| are intercepts. The terms |$\lambda _{m}^{\theta }$|, |$\lambda _{m}^{I}$|, |$\lambda _{m}^{S}$|, and |$\lambda _{m}^{B}$| are factor loadings and the terms |$\delta _{im}^{\theta }$|, |$\delta _{im}^{I}$|, |$\delta _{im}^{S}$|, and |$\delta _{im}^{B}$| are measurement errors, that is, the remaining proportion of the variance of the mth observed measure that is not explained by the factor and assumed to have zero mean and independent of the latent factors and of each other (Attanasio et al. 2020a). To implement the measurement system, we first perform an exploratory factor analysis and then estimate the dedicated measurement system at baseline, end-line, and follow-up.
Overall these estimates indicate that this analysis is useful to account for potential measurement error. We report estimates that account for this measurement error in Online Appendix Table C.25. Results look qualitatively similar although the magnitudes of most coefficients are larger (see Online Appendix C.8 for detailed explanations and reported estimates).
5. Findings
In this section, we document the impacts of First Steps on child development outcomes and on parental and home environment outcomes at end-line (12 months after baseline) and follow-up (33 months after baseline). Estimated impacts on parental and home environment inputs will inform the mediation analysis discussed in Section 7.
5.1. Short-Term Impact (12 months)
5.1.1. Child Development
Table 1 reports the estimated coefficients of the impact of First Steps on child development outcomes 12 months after baseline. Both LT and FT interventions show a positive impact, with the effect size ranging between 0.25 and 0.5 standard deviations. Column (6) shows that the program increased the aggregate index of child development by 0.3 and 0.4 standard deviations, respectively, for LT and FT interventions. To give a sense of the magnitude of the effect, we estimate the impact of the program on the non-standardized child development outcomes. This calculation shows that the LT and FT increased the average child development index by, respectively, 9 and 12% in relation to the control group. The FT intervention arm has a stronger and significantly different effect from the LT arm in all five child development dimensions, with the exception of the gross motor skills outcome where the FT effect is not significant.34 The overall effects are in line with and in the upper range reported in other studies that use ASQ to assess child development outcomes (Doyle et al. 2017).
Child development—short term.
| (1) | (2) | (3) | (4) | (5) | (6) | |
|---|---|---|---|---|---|---|
| Communication | Gross motor | Fine motor | Problem solving | Personal social | Child development | |
| index | ||||||
| Control group—base | ||||||
| Light treatment (LT) | 0.319|$^{*}$| | 0.246|$^{**}$| | 0.306|$^{**}$| | 0.354|$^{**}$| | 0.374|$^{***}$| | 0.297|$^{**}$| |
| (0.153) | (0.084) | (0.098) | (0.124) | (0.070) | (0.094) | |
| Full treatment (FT) | 0.449|$^{**}$| | 0.150 | 0.413|$^{***}$| | 0.487|$^{***}$| | 0.493|$^{***}$| | 0.383|$^{***}$| |
| (0.151) | (0.127) | (0.093) | (0.133) | (0.064) | (0.098) | |
| WILD p-values LT | 0.062 | 0.040 | 0.038 | 0.057 | 0.014 | 0.019 |
| WILD p-values FT | 0.024 | 0.330 | 0.011 | 0.028 | 0.011 | 0.014 |
| Romano–Wolf p-values LT | 0.051 | 0.015 | 0.011 | 0.015 | 0.000 | |
| Romano–Wolf p-values FT | 0.002 | 0.235 | 0.000 | 0.000 | 0.000 | |
| t-test LT = FT | ||||||
| p-value | 0.009 | 0.361 | 0.032 | 0.023 | 0.030 | 0.059 |
| Observations | 1,299 | 1,299 | 1,299 | 1,299 | 1,299 | 1,299 |
| |$R^{2}$| | 0.200 | 0.084 | 0.096 | 0.083 | 0.109 | 0.172 |
Notes: The table presents the treatment effects on child development outcomes. The sample includes children surveyed in the end-line survey (2016). All estimates show results from OLS regressions based on equation (2). All regressions include the following controls: baseline values of the outcomes variables, child gender, child age, the total number of children in the household, the caregiver’s age, the caregiver’s education level (defined as a binary variable equal to 1 if the caregiver has at least primary education and 0 otherwise), the caregiver’s marital status (defined as a binary variable equal to 1 if the caregiver is married or cohabitating and 0 otherwise), and the asset index. This is equal to the first principal component of the following variables: floor materials of the house, roof materials of the house, main source of drinking water, and whether the house of the respondent is owned or rented, as described in Online Appendix Section A.4. All regressions include sampling weights. The dependent variables in columns (1–5) include standardized z-scores of the five ASQ dimensions calculated by subtracting the control group mean and dividing by the control group standard deviation in each survey wave. The dependent variable in column (6) is the child development index calculated by taking the average of the five ASQ z-scores. A full description of the construction of the outcomes is in Section 3 and in Online Appendix A.3. Light treatment is a dummy variable equal to 1 if the respondent (the caregiver) participated to the LT group. Full treatment is a dummy variable equal to 1 if the respondent (the caregiver) participated to the FT group.
p < 10%, **p < 5%, ***p < 1%. Robust standard errors in parentheses are clustered at the sector level. WILD cluster bootstrap with 9,999 replications and residuals drawn from Webb’s 6-point distribution are reported below the estimates (Cameron, Gelbach, and Miller 2008; Roodman et al. 2019). Two tailed p-values from a 5,000 replications Romano–Wolf step-down procedure (Romano and Wolf 2005; Clarke, Romano, and Wolf 2020) are shown below the estimates. A t-test of LT = FT is presented with the statistical significance of the test expressed in p-value. Observations and the R squared are presented at the bottom of the table.
The largest effects are concentrated in communication, problem solving, and personal social skills. This is not surprising since the First Steps curriculum strongly highlighted these areas, with a particular emphasis, given the low-literacy context in which it was implemented, on early communication skills such as talking, singing, playing, reading, story-telling, bonding, and touching. This finding is also consistent with parents reporting mostly their participation in sessions focusing on these topics (see Online Appendix Table B.2).35
To assess if the program had any heterogeneous effect across the distribution of the child development outcomes, we estimated quantile treatment effects (QTE). Online Appendix Figure B.1 reveals some heterogeneity in the effect of First Steps both in the LT and FT groups, showing larger coefficients at the lower end of the distribution of the child development index relative to the control group. This result further underscores the importance of early child development interventions among disadvantaged children.
5.1.2. Parental Time Investment
The results in Table 2 show a positive and significant effect of the program on maternal time investment in the short term, with the effect mostly driven by caregiver–child learning activities. The effect sizes of the average aggregate index are large, ranging between 0.47 SD (LT group) and 0.62 SD (FT group). These effects represent, respectively, a 15 and 20% increase over the control group. Similarly to the results on child development, the effect of the FT intervention is stronger and statistically different from the LT arm.36
Mother time investment—short term.
| (1) | (2) | (3) | (4) | |
|---|---|---|---|---|
| Learning | Positive | Negative | Mother time | |
| discipline | discipline | investment index | ||
| Control group - base | ||||
| Light treatment (LT) | 0.597|$^{***}$| | 0.358|$^{***}$| | 0.218|$^{*}$| | 0.473|$^{***}$| |
| (0.029) | (0.021) | (0.095) | (0.022) | |
| Full treatment (FT) | 0.766|$^{***}$| | 0.522|$^{***}$| | 0.250|$^{**}$| | 0.623|$^{***}$| |
| (0.051) | (0.020) | (0.107) | (0.038) | |
| WILD p-values LT | 0.002 | 0.003 | 0.132 | 0.001 |
| WILD p-values FT | 0.005 | 0.001 | 0.101 | 0.004 |
| Romano–Wolf p-values LT | 0.000 | 0.000 | 0.011 | |
| Romano–Wolf p-values FT | 0.000 | 0.000 | 0.010 | |
| t-test LT = FT | ||||
| p-value | 0.006 | 0.000 | 0.688 | 0.002 |
| Observations | 1,299 | 1,299 | 1,299 | 1,299 |
| |$R^{2}$| | 0.278 | 0.119 | 0.031 | 0.269 |
Notes: The table presents the treatment effects on parenting outcomes. The sample includes mothers surveyed in the end-line survey (2016). All estimates show results from OLS regressions based on equation (2). All regressions include control variables as defined in Table 1 and sampling weights. The dependent variables in columns (1)–(3) include standardized z-scores of the three HOME-SF parents time investment dimensions self-reported by the mother of the child, calculated by subtracting the control group mean and dividing by the control group standard deviation in each survey wave. The dependent variable in column (4) is the Mother Time Investment Index calculated by taking the average of the three HOME-SF z-scores.
p < 10%, **p < 5%, ***p < 1%. Robust standard errors in parentheses are clustered at the sector level. WILD cluster bootstrap with 9,999 replications and residuals drawn from Webb’s 6-point distribution are reported below the estimates (Cameron, Gelbach, and Miller 2008; Roodman et al. 2019). Two tailed p-values from a 5,000 replications Romano–Wolf step-down procedure (Romano and Wolf 2005; Clarke, Romano, and Wolf 2020) are shown below the estimates. A t-test of LT = FT is presented with the statistical significance of the test expressed in p-value. Observations and the R-squared are presented at the bottom of the table.
We also present estimates related to each individual activity performed by mothers. These results are reported in Online Appendix Table B.5. The program’s largest impact on maternal time investment is related to activities such as singing, telling a story, playing with toys, reading, and counting. This is consistent with the focus of the key contents of the parent group-meeting sessions.37
Consistent with the results on child development outcomes, estimates of QTE show a larger impact of the FT at the lower end of the mother time investment index distribution (see Online Appendix Figure B.2). This can be interpreted as a compensatory effect of the FT (Bitler, Hoynes, and Domina 2014), whereby the additional inputs provided through the home visit and the additional material are particularly effective at the lower end of the maternal time investment distribution. This compensatory effect does not persist in the medium term, as we discuss in the next section.
5.1.3. Parental Influence
We investigated the impact of First Steps on perceived parental influence over children’s (i) learning, (ii) development, (iii) nutrition, (iv) care, (v) discipline or child guidance, and (vi) health care. Results in Table 3 show that both the LT and FT intervention arms led to increases in how mothers perceived their influence over their children’s development by 0.4 SD and 0.6 SD, respectively. These are large effects and, similarly to the results above, are more pronounced for families in the FT arm. These effects in turn may have reinforced the impact of the program on child development outcomes. We return to this issue later in the paper.
Mother influence—short term.
| (1) | (2) | (3) | (4) | (5) | (6) | (7) | |
|---|---|---|---|---|---|---|---|
| Learning | Development | Nutrition | Care | Discipline | Health | Mother influence | |
| index | |||||||
| Control group—base | |||||||
| Light treatment (LT) | 0.536|$^{***}$| | 0.459|$^{***}$| | 0.434|$^{***}$| | 0.430|$^{***}$| | 0.386|$^{***}$| | 0.246|$^{***}$| | 0.417|$^{***}$| |
| (0.058) | (0.060) | (0.047) | (0.034) | (0.068) | (0.067) | (0.048) | |
| Full treatment (FT) | 0.719|$^{***}$| | 0.645|$^{***}$| | 0.536|$^{***}$| | 0.620|$^{***}$| | 0.560|$^{***}$| | 0.495|$^{***}$| | 0.596|$^{***}$| |
| (0.055) | (0.070) | (0.083) | (0.071) | (0.070) | (0.069) | (0.061) | |
| WILD p-values LT | 0.011 | 0.009 | 0.008 | 0.008 | 0.012 | 0.021 | 0.009 |
| WILD p-values FT | 0.008 | 0.006 | 0.011 | 0.010 | 0.011 | 0.009 | 0.009 |
| Romano–Wolf p-values LT | 0.000 | 0.000 | 0.000 | 0.000 | 0.000 | 0.020 | |
| Romano–Wolf p-values FT | 0.000 | 0.000 | 0.000 | 0.000 | 0.000 | 0.000 | |
| t-test LT = FT | |||||||
| p-value | 0.001 | 0.008 | 0.216 | 0.022 | 0.004 | 0.020 | 0.009 |
| Observations | 1,300 | 1,300 | 1,300 | 1,300 | 1,300 | 1,300 | 1,300 |
| |$R^{2}$| | 0.122 | 0.082 | 0.070 | 0.081 | 0.062 | 0.056 | 0.105 |
Notes: The table presents the treatment effects on parenting outcomes. The sample includes mothers surveyed in the end-line survey (2016). All estimates show results from OLS regressions based on equation (2). All regressions include control variables as defined in Table 1 and sampling weights. All regressions include sampling weights. The dependent variables in columns (1)–(6) include standardized z-scores of the six HOME-SF parental influence dimensions self-reported by the mother of the child, calculated by subtracting the control group mean and dividing by the control group standard deviation in each survey wave. The dependent variable in column (7) is the mother influence index calculated by taking the average of the six HOME-SF z-scores.
p < 10%, **p < 5%, ***p < 1%. Robust standard errors in parentheses are clustered at the sector level. WILD cluster bootstrap with 9,999 replications and residuals drawn from Webb’s 6-point distribution are reported below the estimates (Cameron, Gelbach, and Miller 2008; Roodman et al. 2019). Two tailed p-values from a 5,000 replications Romano–Wolf step-down procedure (Romano and Wolf 2005; Clarke, Romano, and Wolf 2020) are shown below the estimates. A t-test of LT = FT is presented with the statistical significance of the test expressed in p-value. Observations and the R squared are presented at the bottom of the table.
5.2. Medium-Term Impact (33 months)
5.2.1. Child Development
Table 4 shows the estimated coefficients of the program’s impact after almost 3 years after the baseline survey (33 months). The results show that the effect of the FT intervention on child development outcomes, despite smaller (between 0.15 and 0.3 SD) than the results at short-term, persists in the longer-term. The strongest results are in communication and personal social skills. The estimated coefficient on the LT arm on the aggregate child development index is smaller and not significant. This fade-out seems to be due mostly to a fade-out of the effect on gross motor and problem solving skills. We discuss in Online Appendix Section C.5 whether this LT null effect might be due to low statistical power. We calculated ex-post MDEs using the realized sample size at follow-up and estimated standard errors. The MDEs for the medium-term impact on the child development index are about 0.24 SD for both groups. These results are suggestive that we have enough power to detect only relatively large effects in the medium term. It is possible that a more powered study would observe a significant and persistent impact of both treatments in the medium term. We also advance the hypothesis to test in a future study that the effect of the LT on child development might have faded out in the medium term but could reappear in the long term (Chetty et al. 2011; Wang et al. 2021). This is plausible given that the effect of both the LT and FT on parental time investments persist in the medium term, as will be shown below. Alternatively, it is possible that the FT induced unobserved (and possibly unmeasurable) quality improvements in parent-child interactions given the additional components it included in relation to the LT (the extra facilitator, the home visit, and the book gift). Although we are not able to disentangle and estimate the causal impact of each additional component of the FT intervention, these results are in line with studies reporting advantages of home visits and book provision elsewhere in the world (Grantham-McGregor et al. 1991; Attanasio et al. 2020a).38
Child development—medium term.
| (1) | (2) | (3) | (4) | (5) | (6) | |
|---|---|---|---|---|---|---|
| Communication | Gross motor | Fine motor | Problem solving | Personal social | Child development | |
| index | ||||||
| Control group—base | ||||||
| Light treatment (LT) | 0.148 | |$-$|0.015 | 0.158 | 0.012 | 0.223 | 0.084 |
| (0.105) | (0.093) | (0.131) | (0.067) | (0.122) | (0.087) | |
| Full treatment (FT) | 0.269|$^{**}$| | 0.244|$^{**}$| | 0.156 | 0.166|$^{**}$| | 0.299|$^{**}$| | 0.212|$^{**}$| |
| (0.104) | (0.103) | (0.120) | (0.069) | (0.110) | (0.085) | |
| WILD p-values LT | 0.253 | 0.879 | 0.439 | 0.883 | 0.155 | 0.422 |
| WILD p-values FT | 0.080 | 0.099 | 0.278 | 0.118 | 0.074 | 0.087 |
| Romano–Wolf p-values LT | 0.317 | 0.949 | 0.406 | 0.949 | 0.183 | |
| Romano–Wolf p-values FT | 0.005 | 0.019 | 0.184 | 0.016 | 0.005 | |
| t-test LT = FT | ||||||
| p-values | 0.124 | 0.003 | 0.978 | 0.101 | 0.576 | 0.136 |
| Observations | 1,090 | 1,090 | 1,090 | 1,090 | 1,090 | 1,090 |
| |$R^{2}$| | 0.037 | 0.038 | 0.079 | 0.147 | 0.053 | 0.077 |
Notes: The table presents the treatment effects on child development outcomes. The sample includes children surveyed in follow-up survey (2018). All estimates show results from OLS regressions based on equation (2). All regressions include control variables as defined in Table 1 and sampling weights. The dependent variables in columns (1)–(5) include standardized z-scores of the five ASQ dimensions calculated by subtracting the control group mean and dividing by the control group standard deviation in each survey wave. The dependent variable in column (6) is the child development index calculated by taking the average of the five ASQ z-scores.
p < 10%, **p < 5%, ***p < 1%. Robust standard errors in parentheses are clustered at the sector level. WILD cluster bootstrap with 9,999 replications and residuals drawn from Webb’s 6-point distribution are reported below the estimates (Cameron, Gelbach, and Miller 2008; Roodman et al. 2019). Two tailed p-values from a 5,000 replications Romano–Wolf step-down procedure (Romano and Wolf 2005; Clarke, Romano, and Wolf 2020) are shown below the estimates. A t-test of LT = FT is presented with the statistical significance of the test expressed in p-values. Observations and the R squared are presented at the bottom of the table.
Estimates of QTE for the LT group are not statistically different from zero in any part of the child development index distribution. The estimates of QTE for the FT groups are statistically different from zero for most of the distribution (see Panel B in Online Appendix Figure B.1) and the effects are mostly similar across all quantiles. Taken together, we interpret these results as suggestive of the comparative advantage of the FT arm of First Steps in the longer term, in relation to the more modest LT version.
5.2.2. Parental Time Investment
Table 5 shows the effects of the program on maternal time investment outcomes in the medium term. Although the effect sizes are smaller than in the 12-month evaluation, we find that the impact of First Steps on maternal time investment is robust and persists 33 months later. Both the LT and FT groups observe a positive and significant impact of the program on maternal time investment (0.2 SD). The activities that show the largest impact are learning activities, a result that mirrors the shorter-term results analyzed above. We also estimate the distributional impact of First Steps on parental time investment in the medium term. Panel B in Online Appendix Figure B.2 shows larger QTE at the lower end of the distribution of maternal time investment index, although the confidence intervals mostly overlap throughout the distribution. Online Appendix Table B.6 shows the effects of the program in the longer term on each activity conducted by the mother. Playing, singing, counting, reading, and teaching something new still show the largest impacts for mothers, in line with the shorter-term estimates.39
Mother time investment—medium term.
| (1) | (2) | (3) | (4) | |
|---|---|---|---|---|
| Learning | Positive discipline | Negative discipline | Mother time | |
| investment index | ||||
| Control group—base | ||||
| Light treatment (LT) | 0.264|$^{***}$| | 0.181|$^{***}$| | 0.105 | 0.211|$^{***}$| |
| (0.035) | (0.021) | (0.075) | (0.010) | |
| Full treatment (FT) | 0.309|$^{***}$| | 0.126|$^{***}$| | 0.080|$^{*}$| | 0.210|$^{***}$| |
| (0.055) | (0.036) | (0.041) | (0.030) | |
| WILD p-values LT | 0.009 | 0.007 | 0.287 | 0.001 |
| WILD p-values FT | 0.012 | 0.039 | 0.134 | 0.013 |
| Romano–Wolf p-values LT | 0.000 | 0.000 | 0.170 | |
| Romano–Wolf p-values FT | 0.000 | 0.014 | 0.029 | |
| t-test LT = FT | ||||
| p-value | 0.482 | 0.139 | 0.773 | 0.975 |
| Observations | 1,103 | 1,103 | 1,103 | 1,103 |
| |$R^{2}$| | 0.080 | 0.032 | 0.019 | 0.079 |
Notes: The table presents the treatment effects on parenting outcomes. The sample includes mothers surveyed in the follow-up survey (2018). All estimates show results from OLS regressions based on equation (2). All regressions include control variables as defined in Table 1 and sampling weights. The dependent variables in columns (1)–(3) include standardized z-scores of the three HOME-SF parents time investment dimensions self-reported by the mother of the child, calculated by subtracting the control group mean and dividing by the control group standard deviation in each survey wave. The dependent variable in column (4) is the mother time investment Index calculated by taking the average of the three HOME-SF z-scores.
p < 10%, **p < 5%, ***p < 1%. Robust standard errors in parentheses are clustered at the sector level. WILD cluster bootstrap with 9,999 replications and residuals drawn from Webb’s 6-point distribution are reported below the estimates (Cameron, Gelbach, and Miller 2008; Roodman et al. 2019). Two tailed p-values from a 5,000 replications Romano–Wolf step-down procedure (Romano and Wolf 2005; Clarke, Romano, and Wolf 2020) are shown below the estimates. A t-test of LT = FT is presented with the statistical significance of the test expressed in p-value. Observations and the R-squared are presented at the bottom of the table.
5.2.3. Parental Self-efficacy, Attitudes, Locus of Control, and Aspirations
Results in Table 6 show that the FT intervention arm has resulted in increases in the aggregate mean index of maternal self-efficacy by 0.13 SD (column 9).40 The table shows that the FT intervention had positive impacts (although only weakly significant) on most dimensions of self-efficacy.41 The effect of the LT on the aggregate index of PSE is instead small and mostly not significant across the different domains. Results in Panel B of Table 6 show that both the LT and FT had a positive impact on the aggregate index of maternal attitudes, locus of control and aspirations (0.10 SD and 0.12 SD, respectively). The effect is mostly driven by the component related to attitudes over gender roles in the household, for both LT and FT groups (0.10 SD and 0.17 SD, respectively), internal locus of control, and aspirations. We further disentangle the effects of the program on each component of attitudes toward gender roles. The strongest impact is related to gender attitudes toward child care and household chores (see Online Appendix Table B.7). Taken together, these results suggest that First Steps had a sustained effect not only on child development and parental time investments in rural, remote and poor communities, but also on dimensions (i.e., parental attitudes and beliefs) that may plausibly sustain part of the effects of the program over the longer term.
Maternal attitudes and beliefs—medium term.
| (1) | (2) | (3) | (4) | (5) | (6) | (7) | (8) | (9) | (10) | |
|---|---|---|---|---|---|---|---|---|---|---|
| LT | Unadj. | WILD | Romano–Wolf | FT | Unadj. | WILD | Romano–Wolf | LT = FT | Obs | |
| |$\beta$|/SE | p-value | p-value | p-value | |$\beta$|/SE | p-value | p-value | p-value | p-value | ||
| Panel A: self-efficacy | ||||||||||
| Aggregate index | 0.064 | 0.281 | 0.388 | . | 0.133* | 0.057 | 0.088 | . | 0.108 | 1105 |
| (0.055) | (0.060) | |||||||||
| Emotions | 0.149 | 0.136 | 0.214 | 0.251 | 0.169* | 0.096 | 0.132 | 0.125 | 0.713 | 1105 |
| (0.090) | (0.090) | |||||||||
| Play | 0.183* | 0.067 | 0.059 | 0.115 | 0.166* | 0.065 | 0.092 | 0.067 | 0.741 | 1105 |
| (0.086) | (0.078) | |||||||||
| Empathy | 0.172* | 0.066 | 0.094 | 0.123 | 0.201* | 0.094 | 0.135 | 0.125 | 0.704 | 1105 |
| (0.081) | (0.106) | |||||||||
| Control | 0.089 | 0.260 | 0.397 | 0.381 | 0.151** | 0.039 | 0.047 | 0.019 | 0.162 | 1105 |
| (0.073) | (0.061) | |||||||||
| Discipline | |$-$|0.009 | 0.888 | 0.907 | 0.885 | 0.139** | 0.041 | 0.103 | 0.022 | 0.047 | 1105 |
| (0.065) | (0.057) | |||||||||
| Pressure | |$-$|0.100* | 0.061 | 0.056 | 0.112 | 0.102|$^{***}$| | 0.001 | 0.010 | 0.000 | 0.001 | 1105 |
| (0.046) | (0.020) | |||||||||
| Self acceptance | 0.054 | 0.127 | 0.176 | 0.251 | 0.023 | 0.797 | 0.782 | 0.765 | 0.659 | 1105 |
| (0.031) | (0.086) | |||||||||
| Learning | |$-$|0.025 | 0.707 | 0.737 | 0.843 | 0.113* | 0.063 | 0.100 | 0.067 | 0.031 | 1105 |
| (0.063) | (0.052) | |||||||||
| Panel B: attitudes, locus and aspirations | ||||||||||
| Aggregate index | 0.101** | 0.030 | 0.034 | . | 0.119|$^{***}$| | 0.007 | 0.024 | . | 0.642 | 1105 |
| (0.038) | (0.033) | |||||||||
| Attitudes: child health | 0.058 | 0.172 | 0.269 | 0.301 | 0.009 | 0.858 | 0.864 | 0.872 | 0.113 | 1105 |
| (0.039) | (0.048) | |||||||||
| Attitudes: child behaviour | 0.111* | 0.061 | 0.105 | 0.128 | 0.043 | 0.580 | 0.652 | 0.787 | 0.352 | 1105 |
| (0.051) | (0.075) | |||||||||
| Attitudes: gender roles in the household | 0.105** | 0.038 | 0.018 | 0.053 | 0.168** | 0.011 | 0.037 | 0.003 | 0.223 | 1105 |
| (0.042) | (0.051) | |||||||||
| Attitudes: child development | 0.018 | 0.265 | 0.320 | 0.460 | |$-$|0.066 | 0.271 | 0.426 | 0.553 | 0.142 | 1105 |
| (0.015) | (0.056) | |||||||||
| Internal locus of control | 0.257** | 0.011 | 0.039 | 0.023 | 0.227** | 0.029 | 0.070 | 0.014 | 0.776 | 1105 |
| (0.078) | (0.085) | |||||||||
| Aspiration gap: become like role model | 0.118* | 0.077 | 0.117 | 0.152 | 0.178|$^{***}$| | 0.000 | 0.007 | 0.000 | 0.304 | 1093 |
| (0.058) | (0.020) | |||||||||
| Aspiration gap: change job | 0.027 | 0.766 | 0.703 | 0.697 | 0.188|$^{***}$| | 0.002 | 0.012 | 0.000 | 0.117 | 1105 |
| (0.086) | (0.041) | |||||||||
| Aspiration for child: university degree | 0.108 | 0.109 | 0.143 | 0.220 | 0.148** | 0.030 | 0.098 | 0.014 | 0.648 | 1105 |
| (0.060) | (0.056) | |||||||||
| Aspiration for child: marrying |$\ge$| 22 | 0.095 | 0.396 | 0.508 | 0.614 | 0.165 | 0.154 | 0.245 | 0.362 | 0.243 | 1105 |
| (0.106) | (0.105) |
Notes: The table presents the treatment effects on maternal attitudes and beliefs. The sample includes mothers surveyed in the follow-up survey (2018). All estimates show results from OLS regressions based on equation (2). All regressions include control variables as defined in Table 1 and sampling weights. The dependent variables are presented in the rows. Each row is a regression. In Panel A, the dependent variables are the standardized scores of mother self-efficacy from the TOPSE questionnaire, calculated by subtracting the control group mean and dividing by the control group standard deviation at follow-up. The aggregate index is calculated by taking the average of the eight TOPSE z-scores. In Panel B, the dependent variables are the standardized scores of mother attitudes, locus, and aspirations from the HOME-SF questionnaire, calculated by subtracting the control group mean and dividing by the control group standard deviation at follow-up. The aggregate index is calculated by taking the average of the z-scores.
p < 10%, **p < 5%, ***p < 1%. Robust standard errors in parentheses are clustered at the sector level. In columns (2) and (6) the unadjusted p-values are shown. In columns (3) and (7) p-values from a WILD cluster bootstrap with 9,999 replications and residuals drawn from Webb’s 6-point distribution are shown (Cameron, Gelbach, and Miller 2008; Roodman et al. 2019). In columns (4) and (8), two tailed p-values from a 5,000 replications Romano–Wolf step-down procedure (Romano and Wolf 2005; Clarke, Romano, and Wolf 2020) are presented. A t-test of LT = FT is presented with the statistical significance of the test expressed in p-value. Observations and the R squared are presented in the last column of the table.
5.2.4. Play Material in the Home Environment
Table 7 show results on the effect of First Steps on material a child plays with in the home environment. We find a large impact of both the LT and FT on the average aggregate index (0.29 SD and 0.28 SD, respectively). We note that the largest effect of both treatments is on homemade toys, suggesting that parents may have invested time in producing these toys for their children using existing materials in their home. First Steps also had a positive impact on other dimensions, which may suggest further time and material investments from the parents (i.e., on toys, objects in the household, drawing material, and puzzles).
Play materials in the household—medium term.
| (1) | (2) | (3) | (4) | (5) | (6) | (7) | (8) | (9) | |
|---|---|---|---|---|---|---|---|---|---|
| Types of toys | Homemade | From shop | Objects in HH | Objects outside HH | Drawing material | Puzzles | Colour/size | Counting | Play material index |
| Control group—base | |||||||||
| Light treatment (LT) | 0.349|$^{***}$| | 0.360|$^{**}$| | 0.035 | 0.076 | |$-$|0.011 | 0.186|$^{**}$| | 0.107 | 0.199 | 0.293|$^{**}$| |
| (0.091) | (0.142) | (0.062) | (0.051) | (0.056) | (0.062) | (0.081) | (0.139) | (0.118) | |
| Full treatment (FT) | 0.329|$^{**}$| | 0.097 | 0.120|$^{*}$| | |$-$|0.084 | 0.201|$^{**}$| | 0.182|$^{**}$| | 0.180 | 0.153 | 0.285|$^{**}$| |
| (0.106) | (0.096) | (0.055) | (0.063) | (0.070) | (0.063) | (0.136) | (0.117) | (0.109) | |
| WILD p-values LT | 0.013 | 0.084 | 0.617 | 0.273 | 0.854 | 0.041 | 0.343 | 0.249 | 0.020 |
| WILD p-values FT | 0.019 | 0.414 | 0.114 | 0.293 | 0.047 | 0.033 | 0.318 | 0.342 | 0.078 |
| Romano–Wolf p-values LT | 0.005 | 0.048 | 0.755 | 0.340 | 0.798 | 0.021 | 0.374 | 0.340 | |
| Romano–Wolf p-values FT | 0.017 | 0.432 | 0.083 | 0.432 | 0.023 | 0.023 | 0.432 | 0.432 | |
| t-test LT = FT | |||||||||
| p-value | 0.811 | 0.050 | 0.296 | 0.022 | 0.046 | 0.965 | 0.592 | 0.653 | 0.945 |
| Observations | 1,105 | 1,105 | 1,105 | 1,105 | 1,105 | 1,104 | 1,104 | 1,105 | 1,105 |
| |$R^{2}$| | 0.044 | 0.041 | 0.008 | 0.011 | 0.018 | 0.024 | 0.010 | 0.013 | 0.030 |
Notes: The table presents the treatment effects on material investment. The sample includes mothers surveyed in the follow-up survey (2018). All estimates show results from OLS regressions based on equation (2). All regressions include control variables as defined in Table 1 and sampling weights. The dependent variables in columns (1)–(8) include standardized z-scores from the HOME-SF, calculated by subtracting the control group mean and dividing by the control group standard deviation at follow-up. The dependent variable in column (9) is the play material index calculated by taking the average of the eight HOME-SF z-scores.
p < 10%, **p < 5%, ***p < 1%. Robust standard errors in parentheses are clustered at the sector level. WILD cluster bootstrap with 9,999 replications and residuals drawn from Webb’s 6-point distribution are reported below the estimates (Cameron, Gelbach, and Miller 2008; Roodman et al. 2019). Two tailed p-values from a 5,000 replications Romano–Wolf step-down procedure (Romano and Wolf 2005; Clarke, Romano, and Wolf 2020) are shown below the estimates. A t-test of LT = FT is presented with the statistical significance of the test expressed in p-value. Observations and the R squared are presented at the bottom of the table.
6. Heterogeneous Treatment Effects
Existing studies have reported differences in early child development outcomes resulting from parenting interventions in terms of, for instance, gender (Heckman et al. 2010; Doyle et al. 2017), age (Heckman et al. 2010; Conti, Heckman, and Pinto 2016), and household socioeconomic characteristics (Doyle 2020). We analyze similar heterogeneous effects by testing whether the impact of First Steps differs across the gender and age of the child, assets held by the family, the level of education of the mother and father, and baseline levels in the child development aggregate index. We report results on heterogeneous effects estimated at 12 months and at 33 months from baseline (Online Appendix Tables B.8 and B.9). The results show that both in the short-term and the medium-term the effects of the program on the outcomes are largely the same regardless of the gender and the age of the child. We observe no differences either across household assets. Estimates across levels of education of the mother or the father show that the impact of the program on maternal influence is smaller in families, where the mother or the father are more educated. This result is consistent with other findings in the literature where either parents’ education in the short term is not a significant factor (Banerji, Berry, and Shotland 2017; Baranov et al. 2020) or the treatment effects is larger among less educated parents (Carneiro et al. 2019). The effects fade away in the follow-up survey (see Online Appendix Table B.9), suggesting a convergence of outcomes across household education levels.
The impact of the program changes also slightly across different levels in child development at baseline. Results (available upon request) show that the impact of First Steps on maternal time investment and maternal influence is smaller for children who were in the upper quartile in the child development index at baseline. This result is consistent with recent findings in the literature (Sylvia et al. 2021). Over time, this smaller impact among children who were better off at baseline disappears, suggesting again a convergence in child development outcomes over time (see also Carneiro et al. 2019).
7. Mechanisms and Mediation Analysis
The child production function in equation (1) illustrates key mechanisms through which the program may have affected child development. First, the intervention may have a direct impact on child development formation through the weekly interactions with the parenting facilitators (e.g., maternal investment from the treatment itself, T).42 Alternatively, the intervention may have indirect effects on child development by affecting either (i) parental time investment (I), (ii) parental material investment proxied in our survey with the presence of play materials in the home environment (B), or (iii) parental attitudes and beliefs that, in turn, may influence the quality and effectiveness of parental investments (|$S^{\tau }$|).
The direction of the mediating effect of parental investments is not a-priori obvious. The First Steps program aimed to strengthen child–parent interactions and encourage parents to invest more quality time and resources in their children. However, it is possible that such effects may not materialize if parents investment in the time and resources spent in their First Steps child decreases because they shift their attention and resources to other children in the household when they perceive the intervention itself as some form of investment in the First Steps child (i.e., crowding out effect).43
The direction of the mediating effect of parental attitudes and beliefs is also undetermined a-priori. First Steps, during the radio episodes and other activities, constantly reminded parents about the central role they played in the development of their child, hence possibly boosting their confidence and influence. Group meetings, such as those in First Steps, may also improve parental confidence by creating peer support effects and positive changes in group social norms (Doyle 2020). However, it is also possible that group settings may reduce parents’ confidence (and hence how they perceive their influence over the child’s development) if they feel less competent than other parents attending the group meetings (Andrew et al. 2018). A change in attitudes, locus of control and aspirations experimentally induced by the program may also indirectly influence child development (Carneiro et al. 2019).
In order to shed light on the role of the potential mechanisms at play, we perform a linear mediation analysis in line with Heckman, Pinto, and Savelyev (2013), and estimate an augmented version of equation (2), which regresses the child development outcomes on both the LT and FT and the potential mediators along with the usual controls, as follows:
where |$\theta _{ijt}$| refers to measures of child development skills. |$T^{L}_{j}$|, |$T^{F}_{j}$|, and |$X_{ij0}$| are defined as in equation (2). |$\theta _{ij0}$| measures child development skills at baseline. |$I_{ijt}$|, |$B_{ijt}$|, and |$S_{ijt}^{\tau }$| are indicators of potential mediators, measuring, respectively, maternal time investment, play material in the home environment, maternal attitudes and beliefs, as described in Section 3.2. Estimates from this equation allow us to identify both the direct and indirect (mediating) effects of First Steps.44
It is important to note that this mediation analysis cannot be interpreted as fully causal because the inclusion of the mediating factors in equation (4) can introduce bias if potential mediators are endogenous (Attanasio et al. 2020a). The randomized design of First Steps allows us to identify the causal effect of the program on child development skills and on parental and home environment inputs, but it does not directly allow us to identify the casual effect of changes in measured parental and home environment inputs on child development outcomes (Heckman, Pinto, and Savelyev 2013). Hence, in the absence of any suitable instrumental variable, we cannot fully attribute causal interpretation to this simple mediation analysis.
Table 8 reports results of the estimated equation. For ease of comparison, columns (1) and (3) reports respectively the short-term and medium-term ITT effects of First Steps on the child development aggregate index.45 The models in column 2 include maternal time investment and self-efficacy beliefs as mediators. The model estimated in column 4 includes measures for attitudes, locus of control and aspirations, and a measure for play materials as mediators.46 Columns 2 and 4 present results where potential mediators are assumed to be conditionally exogenous. Short-term results in column 2 show relatively large direct effects of both the LT and FT, albeit smaller than those in the main estimates in column 1. The coefficients for maternal time investment and maternal influence are both statistically significant, suggesting the two variables play an important mediating role, with the former playing a larger role than the latter.
Mediation effects on child development.
| Child development index | ||||
|---|---|---|---|---|
| Short-term | Medium-term | |||
| (1) | (2) | (3) | (4) | |
| Control group—base | ||||
| Light treatment (LT) | 0.297|$^{**}$| | 0.184|$^{*}$| | 0.084 | |$-$|0.008 |
| (0.094) | (0.092) | (0.087) | (0.069) | |
| Full treatment (FT) | 0.383|$^{***}$| | 0.225|$^{**}$| | 0.212|$^{**}$| | 0.100 |
| (0.098) | (0.095) | (0.085) | (0.070) | |
| Mother time investment | 0.181|$^{***}$| | 0.255|$^{***}$| | ||
| (0.040) | (0.030) | |||
| Mother influence/self-efficacy | 0.079|$^{**}$| | 0.038 | ||
| (0.032) | (0.022) | |||
| Mother attitudes, locus and aspirations | 0.198|$^{***}$| | |||
| (0.043) | ||||
| Play material | 0.105|$^{***}$| | |||
| (0.019) | ||||
| Child development at baseline | 0.216|$^{***}$| | 0.129|$^{***}$| | ||
| (0.021) | (0.029) | |||
| Number of children in the household at baseline | 0.000 | 0.013 | ||
| (0.019) | (0.020) | |||
| Observations | 1,299 | 1,299 | 1,090 | 1,073 |
Notes: The table presents the mediation analysis for child development. The sample includes children surveyed in the end-line survey (2016) and follow-up survey (2018). In columns (1) and (3), all estimates show results from OLS regressions based on equation (2): the overall ITT effect on the child development index. In columns (2) and (4), all estimates show results from OLS regressions based on equation (4), which include the Light treatment dummy, the Full treatment dummy, and the mediators. In column (2), the mediators are mother time investment and mother influence. In column (4), the mediators are mother time investment, mother self-efficacy, mother attitudes, locus of control and aspirations, and play materials in the household.
p < 10%, **p < 5%, ***p < 1%. Robust standard errors in parentheses are clustered at the sector level.
Medium-term results in column 4 show a smaller direct role of the treatments since the magnitudes of both LT and FT coefficients are smaller than those in column 3. The coefficients on maternal time investment in column 4 are large and significant suggesting a larger indirect role of this mediator in the medium than in the shorter term.47 The coefficient on play material is also significant, suggesting that material investments have a mediating role too. The coefficients for maternal self-efficacy are not statistically significant, but the coefficients on maternal attitudes, locus of control, and aspirations are large and significant.48
Following the approach and notation in Heckman, Pinto, and Savelyev (2013), we decompose the effect of First Steps on child development into experimentally induced changes in measured and unmeasured inputs.49 The treatment effect can be decomposed as follows:
where |$E(\theta _1 - \theta _0)$| is the estimated change in the child development outcomes; |$P^j$| denotes the set of parental and home environment observed inputs described in equation (4) and |$E[P_{1}^{j}-P_{0}^{j}]$| are the treatment-induced contribution of the observed parental and home environment inputs to the change in child development skills. |$\tau _1-\tau _0$| is the contribution of the unmeasured inputs. This decomposition holds under two main assumptions. First, the impact of the mediators on child development is the same in both the treatment and the control groups.50 Second, the decomposition holds under the assumption that program-induced changes in measured and unmeasured inputs are statistically independent.
Figure 2 displays the estimated decomposition of the overall effect of First Steps into experimentally induced changes in parenting and home environment inputs and other unobserved inputs. Panel A of Figure 2 shows the estimates of the mediation analysis in the short-term (12 months). The results show that the increase in maternal time investment explains more than the 20% of the impact of the intervention on the child development index. When decomposing the child development index across its components, we observe that maternal time investment contributes to a large proportion of the increase in gross motor, communication, personal–social, and problem-solving skills. Changes in maternal’s perceived influence explain a smaller proportion (around 5%) of the overall child development effect at 12 months.51 Panel B of Figure 2 shows that results at 33 months are mostly consistent with those at 12 months. The main difference is that now the increase in maternal time investment explains more than 30% of the treatment effect on child development outcomes. The largest contribution of the increase in maternal time investment is on gross-motor skills. The play material measure also explains a large proportion of the overall effect of the program, mostly on communication, fine-motor, and problem-solving skills. Maternal self-efficacy explains only a small proportion of the program effect across all five domains, whereas maternal attitudes, locus of control, and aspirations explain a relatively larger proportion, mostly of the gross-motor skills.52
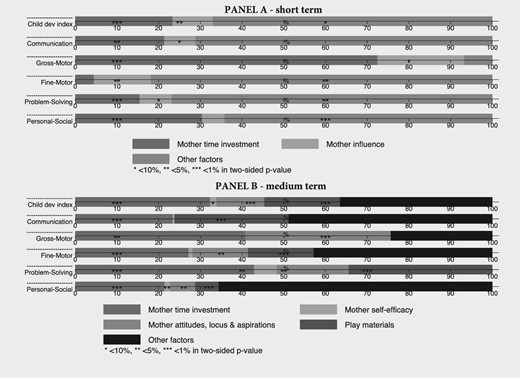
Mediation analysis—short and medium term. The figure shows results from a linear mediation analysis. The data used are from the end-line (Panel A) and the follow-up survey (Panel B). The equation and the estimation process is described in Online Appendix C.9. Each bar represents the total treatment effect normalized to 100%. The mediators displayed in each bar are: mother time investment, mother influence, mother self-efficacy, mother attitudes, locus of control and aspirations, play materials in the household, and other unobserved factors that include any change that is not captured by the measured parenting outcomes changes. To simplify the exposition, for the figures in the main text, contributions opposite in sign to those of the total treatment effect are set to zero. These contributions are small and statistically insignificant.
As a final exercise, we decompose the effect of each of the LT and FT effects following the same approach described above. Panels A and B of Figure 3 show the decomposition of the two treatment effects in the short term and medium term, respectively. In the short-term, and consistent with results in Table 8, both mediators play an important role, with maternal time investment playing a larger role.53 Panel B also mirrors the results in Table 8 and in Figure 2. All mediators play a larger role in the medium term, but the LT effect is mediated entirely by observed inputs. This analysis indicates that, despite the mediating effects of the observed inputs being large, these do not translate into a persistent effect of the LT in the medium term.54 One possible interpretation for this is that changes induced in the inputs by the LT may take more time to manifest their impacts on child development outcomes. Alternatively, and plausibly, the additional components of the FT arm of First Steps (the extra facilitator, the home visits and the book gift) may generate better quality interactions between parents and children, which ensure the persistence of improvements in child development outcomes over the longer term in the full but not the LT group.
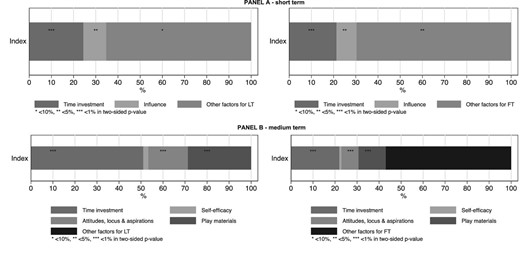
Mediation analysis for LT and FT—short- and medium-term. The figure shows results from a linear mediation analysis. The data used are from the end-line (Panel A) and the follow up survey (Panel B). The equation and the estimation process is described in Online Appendix C.9. Each bar represents the total treatment effect normalized to 100%. The mediators displayed in each bar are: mother time investment, mother influence, mother self-efficacy, mother attitudes, locus of control and aspirations, play materials in the household, and other unobserved factors that include any change that is not captured by the measured parenting outcomes changes. To simplify the exposition, for the figures in the main text, contributions opposite in sign to those of the total treatment effect are set to zero. These contributions are small and statistically insignificant.
While we cannot attribute a full causal interpretation to this simple mediation analysis, results suggest that maternal time and material investments have an important mediating effect on the impact of First Steps on child development outcomes, particularly in the medium term. While maternal self-efficacy does not have a mediating role, maternal attitudes, locus of control, and aspirations appear to have an indirect role in explaining the effect of the program on child development. Since these measures are still fairly unexplored in the literature, these results offers interesting new insights and inputs for further research on these psychological-grounded outcomes.
8. Discussion and Conclusions
This paper analyzed the impact of First Steps, a low-intensity, low-cost, and group based early child development program. First Steps aimed to improve parenting skills among families of children aged 6–24 months in a remote, rural, and poor district in Rwanda. This analysis addresses an important gap in the literature because, to date, there have been few studies in low-income rural contexts where families face serious financial, social, emotional, and physical constraints that may crowd out any attempts to improve parenting skills and early child development outcomes. First Steps aimed to explicitly tackle these constraints by using a mix of methods and delivery tools that specifically targeted the needs of these remote, rural families.
The evaluation results show that First Steps had large positive effects on child development outcomes and parental outcomes. These effects were stronger for families in the FT group and persisted in the longer term, albeit with smaller effects. This impact is largely explained by the mediating effect of maternal time and material investments.
A coarse comparison with the cost and impact of other early childhood development programs implemented in low- and middle-income countries, show that First Steps produced similar impacts in terms of magnitude but at a lower cost, making it extremely cost-effective.
These findings offer important new insights into what early child development interventions can be feasibly scaled-up in contexts of weak institutional reach and extremely low levels of human capital. First Steps was designed with a combination of different components, some of which are quite novel and may overcome challenges observed in other programs. First, First Steps is, to our knowledge, the first program in which group meetings included a live radio listening component seamlessly weaved into core group meeting activities and built around the curriculum. Although we are unable to isolate the effect of the radio program on its own, the mounting positive effects on the effectiveness of radio and other media to promote social change and development (Paluck 2009; La Ferrara 2016; Glennerster, Murray, and Pouliquen 2021) suggest that the radio component may have contributed significantly to the large program impact we observe, as it may have appealed to parents with low levels of literacy who may potentially be intimidated by other methods of delivering information. This opens the possibility that early child development programs being delivered through the use of media (e.g., radio, TV, or social media), and taking advantage of existing community-level resources and relationships, might be a viable way forward for scaling-up.
Second, there is an active discussion in the literature with respect to the advantages and disadvantages of group sessions in relation to (more expensive) home visits. Results are somewhat mixed. In general, group-based interventions have been shown to change parental knowledge and promote positive parenting behaviors, but not all interventions systematically improve child development outcomes (Black et al. 2017; Britto et al. 2017). However, group-based programs are often less expensive than home visits, encourage peer-to-peer learning and support, and have the potential to modify group norms with respect to child raising and education (Aboud and Yousafzai 2015; Carneiro et al. 2019). In poor, remote, and low-literacy settings, these programs may have advantages over other more targeted interventions that may be more difficult to implement and scale-up. Our study strongly suggests that parenting group interventions (delivered with the support of the radio) can be a useful tool to improving early child development outcomes and parenting practices in these settings with sustained effects over time. The fact that the FT arm of First Steps yields stronger and longer lasting effects on child development outcomes suggests that modest home visits (there was only one in First Steps) if affordable may also yield important benefits since they may help reinforcing the information conveyed during the group discussions. The use of community-based facilitators may have provided useful advantages too (i.e., potential increase in trust and lower costs).
Third, First Steps focused on improving the quality of daily interactions between parents and their child based on activities that could be conducted alongside daily routines. For instance, parents were taught to talk to children while cooking and working in the fields. Parents in the villages covered by First Steps were also incentivized to coordinate in turns the daycare of children and were taught how to utilize household resources as learning tools. This emphasis on improving engagement between parents and child alongside daily routines seems to have enhanced parenting skills without adding to the daily stresses of coping with low incomes in very remote, rural areas where family survival is dependent on time spent on farm activities and food production. These small nudges may well be applicable to many other similar low-income contexts where parents are not able to take time from subsistence activities to engage more productively with their children. In addition to the other unique features of First Steps, these nudges may also offer useful entry points to implementing early child development interventions at scale in low-income settings.
If the Ngororero results generalize to other similar settings, interventions such as First Steps may well represent a valuable means to breaking the persistence of poverty traps across generations of parents and children deprived of adequate parenting knowledge and confidence.
Conflict of Interest
We certify that we have no affiliations with or involvement in any organization or entity with any financial interest or non-financial interest in the subject matter or materials discussed in this manuscript.
Acknowledgements
Acknowledgments: We acknowledge funding from the British Academy Early Childhood Development Programme (grant number: EC170194), supported under the UK Government's Global Challenges Research Fund and by the UK Foreign, Commonwealth and Development Office. Save the Children Rwanda also acknowledges funding from Grand Challenges Canada (Saving Brains grant – no. 0724-03), Save the Children UK (Education Breakthrough grant) and Neil Wright Foundation grant. We thank the participants in the ECD workshop in Kigali in June 2019 as part of the National Early Childhood Development Program Conference. We are also grateful for useful comments from participants in several seminars and conferences (CEPR Development Economics conference, SEHO conference, Essen Health conference, Briq ECBE, NEUDC, UKFEIT, CIES, Bocconi, and UNICEF Innocenti Office of Research). We thank all Save the Children Rwanda staff for the logistical support. We are particularly grateful to all families who participated in the study, the facilitators that ran the parenting sessions, and the enumerators that collected the data. Data were collected after ethical clearance by the Institute of Development Studies Ethics Committee and the Rwandan National Ethics Committee. Approval number: N0. 173/RNEC/2015 on July 27, 2015. We are indebted to these institutions for inputs and corrections. We have no affiliations with or involvement in any organization or entity with financial or non-financial interests in the subject matter, or materials discussed in this manuscript. All mistakes are our own. The views expressed herein are our own and do not necessarily reflect the views of the donors.
Notes
The editor in charge of this paper was Imran Rasul.
Footnotes
In recent years, early child development programs, including some in low-income countries, have been integrated into existing large national programs, such as cash transfers or nutrition programs, to take advantage of existing infrastructure, while offering the potential for scaling up (Levere, Acharya, and Bharadwaj 2016; Fernald et al. 2017; Chandra et al. 2021). While these approaches have several advantages, knowledge gaps remain as to whether these delivery modalities will work when such institutional capacity is not available.
According to the 2014–2015 DHS national representative survey, in Rwanda, 55% of women and 53% of men aged between 15 and 49 years old have not completed primary education (DHS 2015a, p.38). Many children in Rwanda are subjected to violent forms of discipline, and one-third receive inadequate care, being left either alone or in the care of another child under the age of 10 (DHS 2015a).
One comparable setting to ours is that of Carneiro et al. (2021), albeit focusing on a different intervention in the form of a cash transfer program to pregnant mothers, combined with parenting information on best practices related to pregnancy and early life nutrition in Northern Nigeria.
The cost analysis of First Steps and its comparison with other programs is discussed in detail in Online Appendix A.1.1. For more background on First Steps, see Abimpaye et al. (2019). This paper reports a simple, descriptive analysis of the immediate short-term effects of First Steps. The paper outlines also how First Steps contributes to national planning on early child development by the Government of Rwanda.
Examples included ideas about how parents could spend quality time with children while conducting their daily productive activities and the use of local and easily available materials in the community.
The design of two treatment arms was done in order to offer the Government of Rwanda options about potential scaling-up of First Steps. The lighter version of the program was intentionally designed to assess whether a less costly and less complex intervention would still yield persistent effects in the long term. The FT involved slightly more costly and logistically complex activities, expected to reinforce further the information learned during the group discussions in a follow-up home visit, as well as reduce educational supply-side constraints by providing reading materials (including a book).
For some of these measures, we are only able to estimate their impact at medium-term, as discussed later in the paper.
All results are robust to tests accounting for multiple hypothesis testing, baseline differences, selection bias due to attrition, social desirability biases, and to alternative constructions of the main outcomes.
The closest paper to our study is Carneiro et al. (2019), who analyze the medium-term impact of a large-scale early child development program implemented in Chile, but is not able to compare these with shorter term effects as we do. This intervention is also implemented in an upper middle-income country with a well-run bureaucracy. Other programs in low income settings that provide parenting education integrated with other components do not find sustained impact on child development in the longer term (Levere, Acharya, and Bharadwaj 2016; Ozler et al. 2018).
This result mirrors recent successes reported in the literature with the use of radio to improve contraception uptake in low-income settings (Glennerster, Murray, and Pouliquen 2021).
Families in very poor and deprived communities have almost no children’s books in the house and very limited literacy materials. According to estimates in DHS Rwanda, on average only 1% of families with children under 5 years have books at home (DHS 2015a).
Both parents are invited to participate to the weekly meetings. The presence of the principal caregiver of the child is required, but the other parent is also encouraged to attend. The only exclusion criteria for the purposes of the research project were children with disabilities as none of the intervention arms was specifically designed to target children with disabilities. The term “parent” refers to the person who is most involved in raising the child (i.e., the “principal caregiver” of the child). Further background on First Steps is provided in Abimpaye et al. (2019).
For instance, the parents are shown how to make toys and books using available materials in their homes and villages.
Online Appendix A.1.2 lists the specific sessions covered under each main topic. It is to note that even though First Steps covered nutrition and health topics, the focus of First Steps is primarily on child cognitive, language and motor development, and on transforming the home learning environment, including interactions between children and parents. The questionnaire did include questions about vitamin A intake and breastfeeding, which received a particular focus in the sessions on health and nutrition. It turned out that around 97% of all children had adequate intake and 94% of mothers were currently breastfeeding at baseline. Results available upon request do not show any effect of the program on these specific dimensions.
We estimated whether the gender of the facilitator (not randomized) affects the impact of the program in the short- and medium-term. Overall, we find no substantial differences in outcomes across the gender of the facilitator. These results are available upon request.
Indeed, the difference in costs between the LT and FT (where the most expensive additional component should be the home visits) is very low. This is due to arrangements with these facilitators that did not require large extra payments for the home visits. Moreover, the radio component facilitates the delivery of uniform messages, which, in turn, requires a more limited competence of the facilitators. For instance, the facilitators received an incentive, which was one-tenth of the stipend given to the workers in the renowned Lady Health Workers program in Pakistan (Yousafzai et al. 2014), and yet the positive effects of First Steps are large and sustained over time. Online Appendix A.1.3 provides more details about the recruitment and the main characteristics of facilitators.
The control group was supposed to receive the program in October 2016 after the end-line data were collected in September 2016. However, due to implementation challenges, the program was partially and poorly implemented in only 13 villages of the control group. The other 14 villages in the control group never received the intervention. The failure to implement First Steps in the control group villages was due to logistics and communication challenges (see Online Appendix C.1). We believe these challenges do not affect the possibility of scaling-up the program since they can be easily addressed. However, these challenges also ensure that the 33-month results are not contaminated by the roll out of the intervention to the control group. To confirm, we investigate whether the 33-month effects change by excluding from the control group the 13 villages that received the intervention (even if only partially) after the end-line. Results remain largely unchanged. Online Appendix C.1 provides a detailed discussion of this analysis.
The difference between the children and parents sample size is due to the fact that, during the follow-up survey, we were unable to interview 42 children who were away from home at the time of the interview, and were only able to interview their parents. The reported estimates use only the sample of mothers because there were too few observations on fathers and other caregivers. For this reason, the number of observations in the reported estimates is smaller than the actual sample size.
Our empirical analysis includes only parental inputs related to mothers and not to the fathers or other primary caregivers. This is due to the very few observations we have on fathers and other caregivers as mentioned above. However, from a conceptual point of view, all parental inputs should determine the child development production function.
This framework is useful to inform the mediation analysis discussed later that will allow us to understand the pathways through which First Steps may have affected child development outcomes.
For instance, in one example among many, in the ASQ questionnaire for children of 6 months in the Gross Motor section (Question 1), the enumerator asks: “When you put your baby on the floor, does she lean on her hands while sitting?” The caregiver implements the activity, while the enumerator observes from a distance and reports the answers.
This index is defined to be the equally weighted average of z-scores of its components, with the sign of each measure oriented so that more beneficial outcomes have a higher score. We calculated the index by averaging the z-scores of the five child development dimensions, following Kling, Liebman, and Katz (2007). In Online Appendix Section C.7, we show that results are robust to an alternative construction of the index by using a weighted index (Anderson 2008).
If, for example, the principal caregiver is the grandmother, she was asked to report also about the activities performed by herself and by her spouse (the grandfather).
We have a similar measure for paternal time investment that corresponds to observations related to the father when he is the respondent. As the number of respondents corresponding to fathers is very small, we report in the main text estimates based on answers about maternal investments. Each respondent was also asked to report about their partner time investment. Results using these additional responses are similar to those reported and are available upon request.
As above, we calculated standardized scores with respect to the control group in the relevant survey wave, and constructed an aggregate index for each standardized outcome variable. We report below results for the different domains and the average aggregate index. We modified the tool from the one administered at baseline and end-line as we wanted to have a more comprehensive measure of PSE beliefs.
PSE beliefs have been studied in the social psychology literature as additional inputs determining parental investments in early child development (Spoth et al. 1995; Miller-Heyl, MacPhee, and Fritz 1998). This literature, which builds on the social learning and cognitive theory developed by Albert Bandura (Bandura 1977), focuses on the idea that individual’s behaviors can be driven substantially by one’s beliefs about oneself. Empirical studies in the social psychology literature have largely confirmed this hypothesis (Mondell and Tyler 1981; Bandura et al. 1996; Dumka et al. 2010). In a separate paper (Justino et al. 2022), we study the causal impact of an intervention that aims at boosting these skills and investigate its effects on parental investments.
We collected also data on the presence of children related reading material at home. We asked whether story, pictures, or colored books were present in the household. However, we decided not to include these measures in the analysis because a book was gifted as part of the FT, and we are unable to disentangle the material provided through the intervention and the material parents might have bought as an effect of the treatment.
The table reports standardized indicators.
Administrative records of attendance were not collected.
We also estimate a specification that does not include control variables but only the treatment indicators. Results are similar to those reported in the main text and discussed in Online Appendix Section C.4.
One possible interpretation of the lack of an effect of the FT might be that gross motor skills may take a longer time to develop in children in these age groups. A similar result was found in other early child development program evaluations (see, e.g., Martinez, Naudeau, and Pereira 2017). To note though that the t-test of the difference between the LT and FT coefficients is not statistically significant. We will note below that the FT effect on gross motor skills is positive and significant in the medium term.
Online Appendix Table B.4 shows, in addition, that child development outcomes, maternal time investment, and maternal influence are positively correlated with the number of sessions attended.
Estimates (available upon request) of the impact of First Steps on paternal time investment are consistent with results on maternal time investment and show a positive impact, in particular on learning and positive discipline activities. As discussed before, however, observations about fathers are small, and, hence, results for paternal time investment need to be interpreted with caution.
The read and show book activities have a strikingly large effect. This might be due to the fact that, as part of the First Step program, in the FT group, one book was gifted to parents. The aggregate mean index we constructed does not include the read and show book activities. Results remain consistent if we include these activities, but the magnitudes of the effects become larger. Results are available upon request. Other early child development programs where sessions were built around a similar curriculum found equally positive results (Engle et al. 2011; Knauer et al. 2016).
This is in line with previous studies. For example, Knauer et al. (2016) in a group-based program in Mexico finds that after the program—in the medium term—parents were more likely to engage in playing, storybook reading, and singing. Similar results are discussed in the systematic review conducted by Engle et al. (2011).
To note that we do not have information at baseline on these sets of outcomes as we collected this data only at follow-up and therefore cannot control for baseline values in the estimated model.
To note that the time investments of parents into the First Steps program was of moderate duration (2 hours, once a week for 17 weeks). The weekly sessions can be considered as a new input into the child production function or, alternatively, the training might improve the quality of parental investments in ways that we cannot measure (Attanasio et al. 2020a). We are unable to disentangle these two channels.
We tested for a potential crowding out effect following Attanasio et al. (2020a), by including in our specification an interaction between a variable that reports the number of children below 3 years old in the household and the treatment variables. The results (available upon request) show that the coefficients of the interaction terms are not significant at short-term, and are small and weakly significant at medium-term, both for child development and mother self-efficacy outcomes. These results are suggestive that crowding out may not be a key mechanism at play in our study.
The direct effects are indicated by the coefficients on the treatment terms, which also inform on the role of unmeasured inputs. The indirect effects can be calculated as the product of the coefficients on |$I_{ijt}$|, |$S_{ijt}^{\tau }$|, and |$B_{ijt}$| in equation (4) and the coefficients on the treatment terms in the corresponding models estimated from equation (2).
We estimated the same model with only maternal time investment and maternal self-efficacy as mediators for consistency with the short-term analysis. Results are largely unchanged and are available upon request.
To note that in all models the results show a high level of persistence of child development skills both in the short- and medium-terms, consistent with similar findings in the literature (Attanasio et al. 2020a). We also note that the number of children in the household at baseline does not seem to have an impact on child development further confirming the presence of no crowding out effect, as previously noted.
In Online Appendix Table C.24, we report the same specification as in Table 8 but with all measures adjusted for potential measurement error. The results are all qualitatively consistent.
Although we measure several inputs, many aspects of parental behaviors and inputs are not observed and measured, some of which may respond directly to the program. These could include, for example, an experimentally induced improvement in maternal mental health, which we do not measure.
See Online Appendix Section C.9 for more details on the derivation of equation (5) and on how we tested for this assumption.
To note that over 60% of the change in child development skills is due to the direct effect of the program and of unmeasured inputs.
To simplify the exposition of Figure 2, contributions opposite in sign to those of the total treatment effect are set to zero. These contributions are small and statistically insignificant.
As before, note that there is a large proportion of both the LT and FT effects that is due to a direct impact of the program and of unmeasured inputs.
As discussed in Section 5, recall that the LT effect on child development is smaller and not significant in the medium-term.
