


Abstract
We relate terrorist attacks to media signal coverage and schooling in Kenya to examine how terrorism alters the demand for education through perceived risks and returns. Exploiting variation in wireless signal coverage and attacks across space and time, we establish that media access reinforces negative effects of terrorism on schooling. Our results are robust to instrumenting both media signal and attacks. We also find that attacks raise self-reported fears for households with media access. Based on these insights, we estimate a simple structural model where heterogeneous households experiencing terrorism form beliefs about risks and returns to education. We allow these beliefs to be affected by media and find that households with media access significantly over-estimate fatality risks.
1. Introduction
Terrorists use violence strategically to spread fear and disruption beyond the violent act itself (Krueger and Malečková 2003). The media, with their wide reach and powerful effect on many different outcomes (see DellaVigna and La Ferrara 2015; for an overview), are the ideal vehicle to disseminate this disruption. In fact, terrorist organisations are aware of the crucial role of media: al-Qaeda leader Ayman al-Zawahiri, for instance, stated that “more than half of this battle is taking place in the battlefield of the media” (ICCT 2021b). As a result of the interplay between terrorism and media, terrorists can affect core pillars of economic development such as education, not only thorough infrastructure destruction or harm to personnel. Rather, terrorism can also affect the demand for schooling by changing the real and perceived risks associated with school attendance, or by altering expected returns to education. Along similar lines, Abadie and Gardeazabal (2003, 2008) argue that terrorism affects the economy not through its physical destruction but by diverting foreign direct investment as expected returns change. Yet, when analysing the effect of violence on other types of investments, such as in human capital, the role of information access and subjective risk assessment has remained largely unexplored.
This paper estimates how incidences of terrorism together with access to mass media affect human capital formation by changing the perceived risks and rewards associated with education. The setting for our analysis is Kenya, parts of which from the late 2000s have experienced a stark increase in terrorist activity by al-Shabaab, a Somali terrorist group with strong links to al-Qaeda. To explore the role of perceptions, we estimate whether the effect of attacks is amplified by access to mass media. As a UNESCO report puts it, “[a]ccusations of being the megaphone of terrorism to attract audiences weigh constantly on media, who are often operating on over-drive” (UNESCO 2017, p. 9). We measure exposure to media via wireless signal coverage for three separate and independent media sources: radio, mobile phones, and television, and complement this analysis with information on media content. Following a detailed reduced form analysis, we estimate a structural model of education and child labour choices for children in the face of terrorist attacks, where households form beliefs about risks and returns to education, and beliefs depend on media access. The model allows us to evaluate the effect of media exposure on subjective assessments of both fatality risks and returns to education, and to quantify longer-term costs of terrorism arising from education decisions.
We show that the well-documented negative effect of violent incidences on schooling is magnified by exposure to mass media. Our analysis exploits several margins of variation, the exogeneity of which we scrutinise in much detail (more on this below). First, we use geo-coded data on wireless signal strength for radio and television and the staggered rollout of mobile phone coverage as topographical and temporal variations in exposure to mass media. Second, we exploit the geographical concentration of terrorist attacks using information on their precise geographical location drawn from the Global Terrorism Database (GTD). Third, temporal variation in attacks over a long time period not only provides identifying variation, but also allows an examination of pre-trends in school enrolment. In addition, we instrument both the incidence of terrorist attacks and media signal coverage.
To examine the role of media, we overlay the geographical coordinates of individuals’ residences with geo-coded data on radio signal coverage from fmscan.org, the location of governmental TV broadcasting antennae, and with mobile network data collected by the Global System for Mobile Communications Association (GSMA). Using Demographic Health Surveys (DHS) data, we find that for households without media access, each attack suppresses school enrolment by 0.4–0.7 percentage points. For households with wireless signal coverage for radio, Global System for Mobile Communication (GSM) telephone, or television, the effect is a statistically significant 0.5–1.0 percentage points stronger. Whereas the effect of terrorism decays with distance for households outside the reach of wireless signal, it barely does so for households with signal coverage, for whom media can bridge the geographical distance to attacks. Data from the Hunger Safety Net Programme (HSNP) also suggest that decreases in schooling are almost completely offset by increases in children staying at home rather than working.1
To investigate the link to media more closely, we complement the analysis with detailed information on media content drawn from the Global Database of Events, Language and Tone (GDELT). For households with access to media, we find a negative relation between the number of media items referring to terrorism in a specific Kenyan region and school enrolment in that very region, conditional on attacks actually carried out. For households without wireless signal, the association is zero.
Our study explores the role of attitudes further using Afrobarometer data and finds that attacks increase self-reported safety concerns and fear of crime. This effect is, again, amplified by media access. In contrast, we show that the effects on schooling are not driven by teacher absences and school closures (highlighted as an important issue in Kenya by Glewwe, Ilias, and Kremer 2010; Duflo, Hanna, and Ryan 2012; Bold et al. 2017). Together with the fact that al-Shabaab barely targeted education facilities during the period we study, these results suggest that the effect is demand driven, and that awareness and the subjective risks associated with terrorism may be important. The amplification of effects through media may either be a response to better information or, alternatively, reflect an exacerbation of fears, leading to a sub-optimal over-response. We show that the latter dominates in our context.
We investigate whether the estimates are biased by omitted variables or reverse causality in several ways. First, we instrument both incidences of terrorist attacks and also media coverage. To predict attacks, we use three sources of variation arising from al-Shabaab’s revenue streams and position in the al-Qaeda network: al-Shabaab’s links to al-Qaeda in the Arabian Peninsula, al-Qaeda’s revenues from Yemen’s exports of hydrocarbons, and al-Shabaab’s revenues from charcoal export. To instrument media access, we use the fact that wireless transmission decreases with three factors: lightning strikes, terrain ruggedness, and wind speed. Second, we exploit the marked increase in terrorist activity in the northeastern parts of Kenya to scrutinise pre-trends. Before the stark increase in attacks, we find parallel trends. Thereafter, enrolment rates in affected areas decrease significantly more for households with than for those without media access. Third, we divide Kenya into a grid of 25×25 km cells and predict whether areas with better media access or higher school density are also more severely hit by terrorist attacks. We find—conditional on observable controls—no significant relation. Fourth, we use longitudinal data from some of the hardest hit areas to estimate our effects whilst controlling for household fixed effects. Finally, we carry out a number of robustness checks, including accounting for a number of confounding factors such as economic conditions (highlighted by Bazzi and Blattman 2014 and Crost and Felter 2019, for instance), investigating labour market and migration outcomes, and controlling for the potential endogeneity of media further by allowing the effect of attacks to vary by education of the household head, population density, and broader region.
Based on the findings of the reduced form analysis, we formulate and estimate a model of educational and labour supply choices for children. The model translates our reduced for estimates into interpretable structural parameters. In particular, it allows us to estimate subjective expectations about fatality risk and expected returns to schooling about which surveys rarely inquire directly. Our framework also enables us to evaluate the importance of expectations by simulating educational choices under different degrees of fatality risk and by estimating the longer-term cost of terrorism.
In our model, terrorist attacks change both the risk associated with children’s activities outside the house (such as attending school or working) and the returns to education. Crucially, individuals form expectations regarding both fatality risks and returns to education, which we estimate separately for households with and without media access. The importance of distinguishing perceptions of violence and of economic conditions has been documented by Fair et al. (2018), who investigate support for insurgents in Pakistan. By estimating perceived probabilities under uncertainty, our model also speaks to the growing literature analysing risk preferences and perceptions within a structural framework (see Delavande and Zafar 2019; Patnaik et al. 2022, for instance). We maintain a close link with the reduced form estimation by exploiting the same quasi-experimental variation in attacks, objective fatality risk, and media access for identification in the structural estimation. In the data, we use for the estimation of our model, no attack targets schools.2 Rather, the majority is aimed at security forces, private individuals, and businesses. We show, indeed, that school density is not a good predictor of terrorist attacks. Yet, activities outside the home expose children to the risk of violence. To disentangle different mechanisms, we note that any decrease in outside activities (i.e. school or work) indicates perceived fatality concerns, whereas a shift to non-schooling activities (i.e. work or staying at home) is informative about perceived educational returns. Our model allows for heterogeneity in the effect of attacks, both with media coverage and unobserved factors.
Our structural estimates show that the expected fatality risk for households without media coverage is very close to and for the median household statistically indistinguishable from the observed fatality rate. In contrast, the median household with media access over-estimates fatality risks by a factor of 11.8. Taken together, these two estimates suggest that media distort beliefs and exacerbate fears rather than providing more information on objective fatality risks. This tallies with recommendations laid out in a recent UNESCO 2017 report. Moreover, we find a negligible effect on expected returns to schooling for the median household. Our estimates imply that 72% of the estimated loss in adult life-time earnings that arise from the negative effect of terrorism on schooling can be attributed to the amplifying effect of media coverage alone. We also estimate a model in which terrorist attacks change agents’ risk aversion rather than their misperception of risk. While this is a valid alternative channel through which media amplify the effects of terrorism, we favour the more staightforward interpretation of the risk perception channel.
Our structural estimates suggest that radio access and terrorist attacks jointly decrease school enrolment by about |$8.5\%$|. This effect size tallies with estimates from previous studies such as DellaVigna and Kaplan (2007), who find that Fox News increased Republican votes by 3.4–28.3%, and DellaVigna et al. (2014), who find effects of 4.3% for radio reception on Croatian voting. Our model also relates to Besley, Fetzer, and Mueller (2021)’s study on terrorist attacks, media, and credit card spending.3
This is the first study documenting how media can amplify terrorism’s effect on child outcomes such as, for instance, schooling. Media itself has been shown to be a powerful influence on education (Jensen and Oster 2009; Keefer and Khemani 2014), violence, unrest, and resistance (Bhuller et al. 2013; Yanagizawa-Drott 2014; Adena et al. 2015; Shapiro and Weidmann 2015; Brodeur 2018; Boleslavsky, Shadmehr, and Sonin 2020; Gagliarducci et al. 2020; Manacorda and Tesei 2020), but also reconciliation (Paluck and Green 2009; Armand, Atwell, and Gomes 2020a).4 However, little is known about how media can function as a propagation mechanism for the effect of other social phenomena such as terrorism, which exploits fears and perceptions, on human capital investment. Different from the previous literature, our analysis thus demonstrates the complementary effect of media and violence.
We provide evidence on media’s so far scarcely documented effect on perceived fatality risk from terrorism by embedding the reduced form evidence in an estimable behavioural model of the effects of terrorism. Becker and Rubinstein (2011) examine the use of services that are exposed to heightened risk of being targeted, like buses or cafés. We use their insights, but go substantially beyond their analysis as we structurally estimate model parameters directly, which allows us to put numbers on crucial quantities and to simulate counterfactual predictions.
Our analysis also relates to the growing body of work on the economic effects of terrorism and mass shootings, which finds negative effects of exposure to violence on schooling achievements (Ang 2020; Bharadwaj et al. 2021). Furthermore, Brodeur and Yousaf (2019) draw a line between the economic impact of mass shooting and media.
By highlighting how media perpetuates effects of terrorism on the demand for schooling, our study documents a thus far unexplored mechanism, and also contributes to the broader literature on the consequences of violence for education (León 2012; Justino, Leone, and Salardi 2013; Lekfuangfu 2016; Brown and Velásquez 2017; Bertoni et al. 2018; Fransen, Vargas-Silva, and Siegel 2018; Brück, Di Maio, and Miaari 2019; Foureaux Koppensteiner and Menezes 2021).
Finally, our analysis also speaks to studies relating life expectancy to human capital investment, for instance, using variation in disease exposure (Oster, Shoulson, and Dorsey 2013; Burlando 2015; Fortson 2011) or by evaluating the impact of increased maternal life expectancy in India on girls’ schooling (Jayachandran and Lleras-Muney 2009). Hazan (2012) and Cervellati and Sunde (2013) use data over several decades to analyse the relation between life expectancy at different ages and educational attainment. Closer to our setting, Lekfuangfu (2016) investigates the impact of fatality risk from landmines in Cambodia and documents a negative effect on both schooling and health investments. We advance this literature by estimating whether these perceptions are affected by access to media.
After first describing the context and data sources used, we estimate in Section 3 how the effect of terrorist attacks on school enrolment is reinforced by media access and explore the role of media content. Section 4.1 presents the model together with its structural estimates and counterfactual analysis. Finally, Section 5 concludes.
2. Background and Data
The setting for our analysis is Kenya, which experienced a sharp increase in terrorist activity from the late 2000s onwards. The majority of attacks were carried out by al-Shabaab in Kenya’s northeastern region, bordering Somalia.
2.1. Terrorism in Kenya
Information on terrorist attacks is drawn from the GTD. The GTD defines a terrorist attack as the use of illegal force and violence by a non-state actor to attain a political, economic, religious, or social goal through fear, coercion, or intimidation.5 For each incident recorded, the GTD collects information on, among other things, the geographic coordinate, number of casualties, and groups responsible. The GTD singling out terrorist attacks serves our purpose6; see also the discussion on the value of information provided by different related datasets in Trebbi and Weese (2019).
Between the years 2001 and 2014, Kenya experienced a total of 367 terrorist attacks, 96% of which were carried out from 2007 onwards (see panel A of Table 1). Most attacks are attributed to al-Shabaab, an Islamist terror organisation based in Somalia and founded in the early 2000s with the aim of overthrowing governments in the Horn of Africa region and to install Islamic rule.7 As Figure 1(a) shows, most attacks are concentrated in the three northeastern counties Mandera, Wajir, and Garissa, which border Somalia. The two largest towns, Nairobi and Mombasa also experience a considerable number of attacks. Figure 1(b) shows the marked increase in terrorist activity after the mid-2000s (see Online Appendix B for the geo-temporal variation).
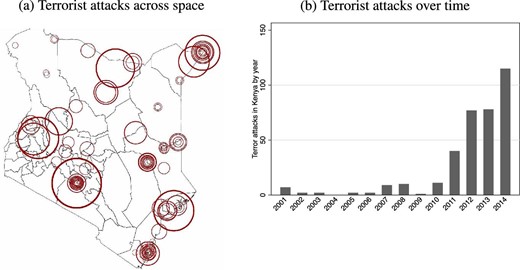
Terrorist attacks in Kenya. The figure reports the number of casualties and attacks in Kenya. Panel (a) shows the geographic distribution of attacks occurring during the years 2001–2014, with radii indicating the number of casualties per attack. Panel (b) shows the increase in the number of attacks over time. Source: GTD; own calculations.
Descriptives.
| Panel A: terrorist attacks in Kenya 2001–2014 | ||||
| Organisation | All | al-Shabaab | 2001–2006 | 2007–2014 |
| Attacks | 367 | 216 | 15 | 352 |
| Casualties | 931 | 523 | 106 | 825 |
| Panel A: terrorist attacks in Kenya 2001–2014 | ||||
| Organisation | All | al-Shabaab | 2001–2006 | 2007–2014 |
| Attacks | 367 | 216 | 15 | 352 |
| Casualties | 931 | 523 | 106 | 825 |
| Panel B: terrorist attacks in Kenya 2001–2014 by target | |||||||
| Target | All | Police | Citizens | Business | Military | Education | Other |
| Attacks | 367 | 96 | 74 | 53 | 22 | 5 | 117 |
| Casualties | 931 | 165 | 292 | 154 | 29 | 51 | 240 |
| Panel B: terrorist attacks in Kenya 2001–2014 by target | |||||||
| Target | All | Police | Citizens | Business | Military | Education | Other |
| Attacks | 367 | 96 | 74 | 53 | 22 | 5 | 117 |
| Casualties | 931 | 165 | 292 | 154 | 29 | 51 | 240 |
| Panel C: characteristics of individuals in Kenya | ||||
| Data source | DHS | DHS | DHS | HSNP |
| Sample | All | Northeast | HSNP counties | |
| Year | 2009 | 2009 | 2009 | 2010 |
| Children (6–14) currently at school | 93.1 | 62.2 | 53.4 | 55.8 |
| Girls (6–14) currently at school | 93.4 | 58.2 | 51.4 | 52.4 |
| Boys (6–14) currently at school | 92.9 | 65.6 | 55.1 | 58.7 |
| Members per household | 4.3 | 5.4 | 5.6 | 5.8 |
Notes: Panel A reports the total number and casualties of terrorist attacks by organisation and year in Kenya during 2001–2014. Source: GTD. Panel B reports the total number of terrorist attacks by target of attack in Kenya during 2001–2014. Source: GTD. Panel C reports the shares of children in school; first column is drawn from the 2009 DHS for the whole of Kenya; second column is drawn from the 2009 DHS for the northeast of Kenya (Mandera, Wajir, and Garissa) only; third column is drawn from the 2009 DHS for the counties Mandera, Marsabit, Turkana, and Wajir only; and fourth column is drawn from the 2010 HSNP baseline survey for the counties Mandera, Marsabit, Turkana, and Wajir.
During the period of our analysis, al-Shabaab rarely targeted schools (see panel B of Table 1). The most common targets instead were security forces (96 attacks against police, 22 against military targets), as well as private individuals and businesses. Between 2001 and 2014, education institutions were targeted only five times, corresponding to 1.4% of all attacks.8
2.2. Education in Kenya
Data on Education in Kenya.
We measure school enrolment in different ways using two distinct and independent data sources. First, we use individual level data drawn from two rounds of the Kenyan DHS, 2009 and 2014.9 These are nationally representative and interviewed all members of 9,057 and 36,430 households, respectively (Kenya National Bureau of Statistics 2009, 2014). In addition to many other subjects, the questionnaires collect extensive information on educational enrolment and years spent in school.
We complement these data with a panel dataset collected to evaluate the HSNP to examine children’s alternative activities, and also to condition on household fixed effects. In order to evaluate the HSNP, data were collected on 2,436 households in the counties Mandera, Marsabit, Turkana, and Wajir (see Online Appendix A for a map of these) over 3 years between August 2009 and November 2012. Although the HSNP was not designed as a representative sample of the counties it surveyed, the characteristics of its respondents are similar to the overall populations in those counties (see panel C of Table 1). This dataset records children’s major activity, and thus allows us to assess how other activities are affected by the presence of terrorist attacks. We also use information on teacher absenteeism and school closures from this dataset.
The Educational Situation in Kenya.
Primary school covers 8 years, and the school year runs from January to October. Children automatically advance to the next year.
As our main dependent variable, we use enrolment and define an indicator for each child taking the value 1 if they enrolled in school by the age of 7. The school entry age set by the government is 6. We include children aged 7 at the time of interview since these children may have turned 7 between enrolling in school and being interviewed.10
The advantage of this variable is that it provides us with a longitudinal dimension reaching back in time (since children reach school entry age in different years), which allows us to examine trends in educational outcomes before the stark increase in terrorist attacks. Although we also estimate effects on current school attendance, our overall focus on enrolment better reflects parents’ choice, and is unlikely to be affected by, for instance, teacher absenteeism, a channel that we examine in Section 3.5 in more detail. For the years 2010 to 2014, 81.2% enrolled by the age of 7, which tallies with World Bank net primary school enrolment rate of 80% in 2012 (the last year available).11
2.3. Access to Media: Radio, Mobile Phones, and Television
With over 100 radio stations and more than 20 television channels broadcasting in many local languages, there is a large and diverse media landscape in Kenya. The 2010 constitution guarantees freedom of speech and of the press. Whilst there have been reports of pressure applied to some media outlets, Kenya ranks relatively highly in terms of press freedom when compared to other African countries. In 2014, for instance, Kenya scores 11 out of 16 on the “Freedom of Expression and Belief” index by Freedom House, which makes it the thirteenth highest ranked country in Africa (out of 54).12
We measure exposure to mass media via access to three types of wireless signal coverage: radio, mobile phone, and television. Overlaying geo-coded information from three separate and independent sources, we classify an individual to be exposed to mass media if her residence falls within an area covered by wireless signal. We complement these data with information on media content in Section 3.2. An advantage of focusing on media access rather than the consumption of particular channels is that we are less concerned about selection issues (Durante and Knight 2012).
Radio.
Radio is a medium that has recently received increased attention as a significant factor for armed conflict in different historical settings (Yanagizawa-Drott 2014; Armand, Atwell, and Gomes 2020a; Gagliarducci et al. 2020). According to the DHS (2009, 2014), around two-thirds of households report to own a radio. We use information on areas with signal reception provided by fmscan.org, which supplies worldwide radio frequencies and transmitter maps, likely being the most complete worldwide database on radio signal coverage. fmscan.org identifies areas with radio signal coverage by estimating radio signal strength at thousands of different geographical points around a radio transmitter. The algorithm combines the transmission strength and height of the antenna with information on the terrain surface area, similar to measurements used, for instance, in Olken (2009) or Yanagizawa-Drott (2014). We distinguish areas at signal level 45 |$\text{dB}\mu \text{V}$|, which is generally regarded as providing good reception in and outside of buildings for different types of terrain, see Figure 2(a).13
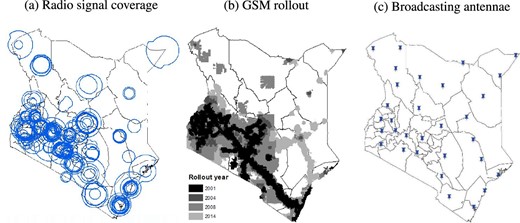
Radio signal coverage, mobile network rollout, and governmental TV antennae. Map (a) shows radio signal coverage across Kenya (source: fmscan.org); map (b) shows the rollout of GSM mobile phone signal (source: Collins Bartholomew); and map (c) shows the geographical distribution of governmental television antennae (source: Communication Authority of Kenya).
To corroborate our results, we also use self-reported information on wireless receiver ownership provided by the DHS to distinguish households with and without a radio. While this last variable is likely endogenous, it provides variation across households beyond mere geographical variation.
Wireless Telephone.
A common way to keep up with news in Kenya is via short messaging services (SMS). Most providers, such as, for instance, Safaricom, offer SMS services where news are sent via text message as part of their tariffs. We obtained data on mobile phone coverage from the GSMA . Digital maps are provided by Collins Bartholomew, who use submissions from mobile operators throughout the world to construct maps of GSM networks, which as the dominant standard in Africa has a near 100% market share. The fine geographical disaggregation of the data allows us to overlay these maps with the geographical coordinates of survey respondents to determine exactly which respondents are covered by GSM signal. Moreover, the staggered rollout of GSM coverage provides temporal variation in access to media. The Collins Bartholomew data are described in Figure 2(b).
Television.
To capture access to television, we employ information on the geographical location of governmental television broadcasting antennae from the Communication Authority of Kenya and calculate the distance between each household and the closest antenna (see Figure 2(c)). The average reach of antennae in Kenya is around 45 km, which we use as a cut-off. Results are robust to a variety of similar values.
Schooling and Media Access over Time.
To illustrate the relationship between attacks and school enrolment, we plot the proportion of children enrolling in school by age 7, for two regions of Kenya the northeast—where most terrorist attacks occur—and the remainder of the country. As Figure 3(a) shows, enrolment rates before the beginning of terrorist activity exhibit very parallel trends, with statistically indistinguishable slopes across both areas (p-value of .42). Note that these trends are parallel even unconditionally, so that the critique by Callaway and Sant’Anna (2021) does not apply. After terrorist activity starts in the northeast, the trends begin to diverge.14
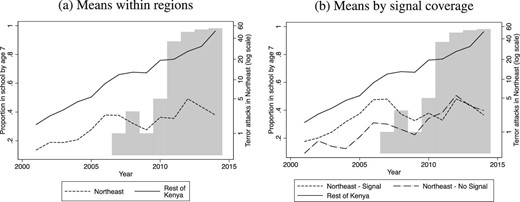
Terrorist attacks and schooling over time by access to media. Panel (a) reports the proportion of children enrolling in school by age 7 for northeastern Kenya (Mandera, Wajir, and Garissa) and the rest of the country by year; and panel (b) reports the proportion of children enrolling in school by age 7 for northeastern Kenya (Mandera, Wajir, and Garissa) with and without wireless signal and the rest of the country by year; bars in both panels denote attacks in northeast in logarithmic scale. Sources: DHS, fmscan.org, Collins Bartholomew, Communication Authority of Kenya, and Global Terrorism Database.
To explore the role of media access, we use information on radio signal coverage, GSM rollout and governmental television antennae to divide households in regions most affected by terrorism (the northeastern counties) into two groups: households with and without access to any of these three media sources. Figure 3(b) suggests that within northeastern Kenya the divergence in enrolment is driven by and more stark in areas covered by wireless signal. Again, this sub-region exhibits a very parallel pre-trend to other Kenyan regions.
3. The Importance of Media Access and Content
Terrorism differs from other types of violence, such as civil war or gun crime, in as much as its direct effect on infrastructure and casualties is relatively low. Yet, its economic impact can be severe. In a commentary for the Wall Street Journal, Becker and Murphy (2001) predicted terrorism to only have a limited economic impact, due to the small share of capital stock it destroys. Abadie and Gardeazabal (2008) instead provide evidence for a more substantial effect. They contend that terrorism reduces expected returns, which in turn may lower foreign direct investment and hamper economic growth. We extend this logic to human capital investment and explore the effects of awareness about terrorism on households’ schooling decisions by considering access to media. We deepen this analysis further by using information on media content as well as on self-reported fears and concerns. In Section 4.1, we use a structural model to disentangle the effect of media exposure on risk perception from that on expected returns to schooling.
3.1. The Effect of Terrorist Attacks and Signal Coverage
The negative impact of violent incidences on schooling is well-established in the literature (see e.g. León 2012; Justino, Leone, and Salardi 2013; Bertoni et al. 2018; Foureaux Koppensteiner and Menezes 2021). In Alfano and Görlach (2021), we use various measures for schooling and exposure to conflict to show that terrorism is no exception.
We address various identification concerns in Section 3.4. Among other things, we instrument both incidences of terrorist attacks and also media coverage, focus on the most affected regions using detailed longitudinal data along with household fixed effects, and also examine whether media coverage or school density predict terrorist attacks.
Panel A of Table 2 confirms the pattern of Figure 3(b). For all four measures for wireless access, the effect of terrorist attacks is about twice as strong for households with signal coverage than for those without, and more so for the three more exogenous measures in columns (1)–(3).16 An advantage of the household-level variation in radio ownership instead is that it can provide insight into the importance of spillovers between households within the same location. Online Appendix E provides suggestive evidence for the presence of such local spillovers.
Media exposure, media coverage of terrorism, and school enrolment.
| (1) | (2) | (3) | (4) | |
| Dependent variable | =100 if child in school by age 7 (mean: 67.5) | |||
| Panel A: actual terrorist attacks | ||||
| # terrorist attacks | |$-$|0.417 | |$-$|0.444 | |$-$|0.358 | |$-$|0.570 |
| (0.301) | (0.303) | (0.184) | (0.155) | |
| # terrorist attacks | |$-$|0.545 | |$-$|0.525 | |$-$|0.634 | |$-$|0.402 |
| × Media access | (0.174) | (0.197) | (0.101) | (0.138) |
| c and t effects and covariates | YES | YES | YES | YES |
| Panel B: reporting on terrorism | ||||
| Mentions of terrorism (in 100s) | 0.179 | 0.226 | 0.138 | |$-$|0.044 |
| (0.318) | (0.288) | (0.276) | (0.198) | |
| Mentions of terrorism (in 100s) | |$-$| 0.517 | |$-$|0.589 | |$-$|0.543 | |$-$|0.385 |
| × media access | (0.296) | (0.273) | (0.287) | (0.138) |
| c and t effects and covariates | YES | YES | YES | YES |
| # terrorist attacks | YES | YES | YES | YES |
| Type of media access | Radio | GSM | Close to | Owns |
| Signal | Signal | Antenna | Radio | |
| Observations | 40,724 | 40,724 | 40,724 | 40,724 |
Notes: The table reports the relation between media access, media items on attacks, and education enrolment in Kenya; dependent variable in all regressions takes value 100 if child enrolled in school by age 7; data are drawn from 2009 and 2014 rounds of DHS, and GTD; # terrorist attacks is the number of attacks classified as terrorist per county and year; Mentions of terrorism (in 100s) is the number of media mentions for each Kenyan region and year that cover terrorism, adjusted by the total number of media items referring to that particular region; Media Access=1 if household has media access through (i) radio signal (at least 45 |$\text{dB} \mu \text{V}$| according to fmscan.org); (ii) GSM mobile phone signal (source: GSMA); (iii) television (within 45 km of a governmental broadcasting antenna; source: Communication Authority of Kenya); and (iv) radio ownership (source: DHS); covariates include a child’s gender, rural location, distance to closest primary school, latitude and longitude of the location, household having electricity, radio, and TV and for whether household head has secondary education; regressions in panel B further control for the number of actual attacks carried out per county and year; standard errors are clustered at the county level and reported in parentheses.
To illustrate how media access can perpetuate the effect of terrorist attacks across space, we document how the distance to attacks increases enrolment rates differentially for households with and without wireless signal, using our preferred measure, radio signal.17 Households plausibly can learn about close-by attacks without resorting to mass media. The role of the latter increases, however, for further away incidences. Overlaying the geographical coordinates of households and terrorist attacks, we calculate—for each year—the distance between each child and the closest terrorist attack occurring in each of the years 2001–2014. We then estimate how enrolment rates change with distance to attacks semi-parametrically by regressing school enrolment in a given year on four dummies dividing the distance to the closest attack into four bins: 0–24 (the base category), 25–49, 50–99, and 100 km or more. The triangles in Figure 4(a) show how for households without radio signal school enrolment for children living further away from the closest attack increases drastically with distance. For households with radio signal, in contrast, school enrolment does not increase with distance to the closest attack (squares in Figure 4(a)). For more than 100 km distance, the difference between the effects for households with and without radio signal is statistically significant.
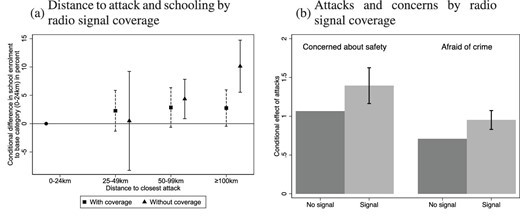
Distance from attacks, radio signal coverage, and safety concerns. The figure shows the effect of attacks on enrolment rates, safety concerns and on fear of crime. Panel (a) shows how enrolment rates change with distance to attacks for households with radio signal (triangles) and those without (squares), on intervals of 0–24, 25–49, 50–99, and |$\ge$|100 km of distance; triangles and squares denote point estimates from regressions of school enrolment on distance to closest attack in each year, conditional on a child’s gender, rural location, household having electricity, radio, and TV, household head having secondary education and latitude and longitude of the respondent’s residence; estimates are normalized to the base category (0–24 km); sources: DHS 2009 and 2014, Global Terrorism Database and fmscan.org. Panel (b) shows coefficient estimates for the effect of terrorist attacks on concerns regarding safety and fear of crime by signal coverage; dependent variable for left bars takes value 100 if respondent answers question In your opinion, what are the most important problems facing this country that government should address? with either Crime and security, Political violence or Civil War (out of 3 options); dependent variable for right bars takes value 100 if respondent answers question Over the past year, how often, if ever, have you or anyone in your family: Feared crime in your own home? with many times or always; radio signal coverage is defined as having at least 45 dBμV by fmscan.org; estimation conditions on age, dummies for respondent being female, having no education, living in rural area, being Muslim, latitude, longitude, year, and county indicators; sources: 2005, 2008, 2011, and 2014 rounds of the Kenyan Afrobarometer, Global Terrorism Database and fmscan.org.
3.2. Media Content Relating to Terrorist Attacks
After having shown that the effect of terrorist attacks varies with access to media, here we use data on media content to further tie down the crucial role of media. We find a negative relation between media content on terrorism and school enrolment, which is robust to the inclusion of the number of attacks actually carried out. Importantly, we find large and significant correlations only for households with access to media, as measured by signal coverage.
The data for this analysis are drawn from the GDELT project, which monitors media outlets such as print, broadcast, and web news worldwide, and provides information on organisations, people, themes, quotes, and images in almost real time. GDELT data have recently been used for instance by Armand et al. (2020b) in a study of the effects of natural resource discoveries in Mozambique or by Manacorda and Tesei (2020) when analysing protests in Africa.18 For Kenya, the GDELT records to which of the country’s eight regions an event refers (see map b in Online Appendix A). We define the following events as occurrences of terrorism: bombing (whether suicide, car or other non-military), abductions (including hijacking and taking of hostages), and assassinations of a known person (whether successful or not). For each region and year, we sum media mentions across all of GDELT’s source documents.19Figure F.1 in Online Appendix F shows the evolution of media mentions relating to terrorism over time.
To examine the relation between media mentions and educational enrolment empirically, we match the region/year panel of media mentions to the enrolment information and data on terrorist attacks in the 47 counties used so far, which are sub-strata of the 8 regions. Since we expect the effects of media items on terrorism to increase with individuals’ media access, we interact our four measures for media access with the total number of terrorism related media items in each region. We then regress education on media mentions whilst controlling for attacks carried out per county and year. The parameter estimates in panel B of Table 2 show a negative correlation of terrorist mentions with enrolment only for households with likely better access to media. The estimation suggests a significant relation between media items about terrorism and educational outcomes while conditioning on the number of attacks actually carried out in a given region, much in line with effects on tourism spending documented by Besley, Fetzer, and Mueller (2021).
3.3. Effect of Terrorist Attacks on Concerns and Fears
Given the nature of terrorism, fear in a broader sense likely is an important factor in explaining the observed effects much of the literature has investigated (such as Becker and Rubinstein 2011; Manelici 2017; Bertoni et al. 2018; Brodeur 2018). In fact, media are routinely suspected of “contributing to the amplification of the terrorist impact, and even its exaggeration” (UNESCO 2017, p. 49).
To illustrate the link between media, terrorism, and attitudes, we estimate the effect of terrorist attacks on self-reported safety concerns and on fear of crime. We pool four rounds of the Afrobarometer surveys (2005, 2008, 2011, and 2014) and overlay the geographical coordinates of respondents with radio signal coverage to distinguish individuals with and without access to media. Subsequently we re-estimate equation (1) for two dependent variables: (i) whether the respondent is concerned about safety, and (ii) whether the respondent is afraid of crime.20 The results in Figure 4(b) show not only that exposure to terrorist attacks increases self-reported concerns and fears but that this effect is significantly larger if respondents have access to radio signal coverage.
The reinforcement of the effects of terrorism through media coverage shown in Sections 3.1 and 3.2 may arise due to two mechanisms. On the one hand, any effect of media access or media content may be a rational response to better information. On the other hand, differing responses to attacks may reflect an exacerbation of fears, and lead to a sub-optimal over-response in important decisions like school attendance. In Section 4.1, we use a more structural framework to pin down alternative channels, and find evidence for the second interpretation. This lines up both with our own finding of strong emotional responses due to media access, and with the common argument in policy analyses, such as the assessment by UNESCO that we cite above. The exacerbation of fears we document in this paper is a consequence of increasing media penetration. Previous studies have pointed out that countries actively manipulate media content (Yanagizawa-Drott 2014, for instance). Our findings show that even without active intervention, media can magnify violence’s effect on education. This constitutes an ethical dilemma for journalists, who, while providing an information service, may inadvertently amplify terrorists’ messages (ICCT 2021a).
3.4. Identification and Robustness
In this section, we address a number of identification and robustness concerns. Specifically, we instrument both the occurrence of terrorist attacks and media access. We also zoom into the most heavily affected region of Kenya, condition on household fixed effects, and examine whether areas with signal coverage or higher school density attract terrorist attacks.
3.4.1. Instrumenting both Terrorist Attacks and Media Coverage
In Figure 3, we do not find evidence for a violation of the parallel trend assumption. Nevertheless, our estimators would be biased if either al-Shabaab targeted areas that experience shocks (which are correlated with enrolment) or if families with media access differ in unobserved, time varying characteristics. In other contexts, for instance, economic or natural disaster shocks have been argued to affect terrorist activity (Montalvo and Reynal-Querol 2019), and likely correlate with school enrolment. We address these two concerns by instrumenting both terrorist attacks and media access. Either way, we estimate very similar effects.
Instrumenting Terrorist Attacks. We predict terrorist attacks by leveraging plausibly exogenous variation arising from al-Shabaab’s revenue streams and links to the al-Qaeda network. See Alfano and Görlach (2021) for a detailed discussion and Online Appendix G.1 for more details. To predict the timing of attacks, we use three margins of variation. First, we note that al-Shabaab receives support and strategic guidance from the Yemeni branch of al-Qaeda, al-Qaeda in the Arabian Peninsula (AQAP). In Alfano and Görlach (2021), we document not only that al-Shabaab closely follows AQAP in its timing of attacks, but also that it chooses similar targets. Second, we exploit the fact that revenue streams for al-Qaeda derived from Yemen’s exports of hydrocarbons increase the intensity of attacks by both AQAP and al-Shabaab. Finally, we look at al-Shabaab’s main source of income directly: the export of charcoal.21 A major trading partner for Somalia’s charcoal are the United Arab Emirates (UAE), where it is mainly used to smoke water pipe. Accordingly, we use tobacco imports into the UAE as a third exogenous shifter of its demand for charcoal and thus al-Shabaab’s revenues.
We interact these time varying determinants of terrorist activity with distance to the Somali border, a strong predictor for the location of attacks. Estimation then uses only the interaction between predictors for the timing and for the location as an instrument for terrorist attacks, and separately controls for time and location effects. Aggregate developments, such as changes in international fuel prices, as well as fixed location characteristics are thus accounted for.
Instrumenting Media Access. We predict media access using three climatic and topographical variations, which affect wireless signal transmission. We focus on our preferred measure, radio, and use the pre-period to evaluate the validity of our instruments.
First, following Manacorda and Tesei (2020), we instrument media access using lightning strikes. These electronic discharges decrease the supply of wireless signal by causing electrical blackouts and also by damaging infrastructure, such as antennae. These interferences may also discourage radio adoption, thus decreasing demand for the medium. We use NASA Global Hydrology Resource Center data (Blakeslee 2010) (see map f in Online Appendix A).
Second, following previous studies (e.g. Yanagizawa-Drott 2014), we use terrain surface as an additional instrument. Unequal terrain blocks radio waves, thus worsening radio reception. We measure terrain surface via the ruggedness index as used by Nunn and Puga (2012) (see map g in Online Appendix A).
Third, we use wind speed as an instrument. Wind causes structural and electrical damage to transmitting antennae, and also refracts radio waves thus decreasing the quality of radio signal reception. We measure wind at 100 m altitudes, where most of radio transmission occurs using data from the Wind Atlas.22 See map h in Online Appendix A, and Online Appendix G.2 for further details.
Results. We start by instrumenting terrorist attacks only. As column (1) of Table 3 shows, the IV estimates are slightly larger (in absolute size) yet similar to the OLS estimates. In column (2), we instrument both terrorist attacks and media access and again find very similar results. Given the similarity between our OLS and IV estimates, we use terminology implying causality also for our non-instrumented estimates in this section. See Online Appendix G for further details and for first stage estimations.
Instrumental variable estimates and mechanisms.
| (1) | (2) | (3) | (4) | (5) | (6) | (7) | (8) | (9) | (10) | |
| =100 if child is currently | =100 if | =100 if child is | =100 if | |||||||
| =100 if child | Enrolled in | Staying | Enrolled in school | Adult | currently enrolled | child in | ||||
| Dependent variable | school by age 7 | school | Working | at home | (13–14 years old) | works | in school | school by 7 | ||
| Mean | 67.5 | 59.0 | 18.3 | 22.8 | 59.4 | 54.5 | 59.0 | 67.5 | ||
| Instrumental variables | ||||||||||
| Instruments for attacks | YES | YES | ||||||||
| Instruments for media coverage | YES | |||||||||
| # terrorist attacks | |$-$|0.705 | |$-$|0.692 | 0.060 | 0.195 | |$-$|0.255 | 0.118 | 0.170 | 0.060 | 0.199 | -0.326 |
| (0.248) | (0.267) | (0.350) | (0.231) | (0.422) | (0.623) | (0.215) | (0.351) | (0.286) | (0.292) | |
| # terrorist attacks | |$-$|0.871 | |$-$|0.969 | |$-$|0.962 | |$-$|0.055 | 1.017 | |$-$|1.108 | |$-$|0.219 | |$-$|0.952 | |$-$|0.867 | -0.648 |
| × Media Access | (0.253) | (0.484) | (0.262) | (0.217) | (0.375) | (0.611) | (0.246) | (0.261) | (0.237) | (0.192) |
| Kleibergen–Paap F–statistic | 33.4 | 40.0 | ||||||||
| Type of media access | Radio Signal | |||||||||
| Data source | DHS | DHS | HSNP | HSNP | HSNP | HSNP | HSNP | HSNP | HSNP | DHS |
| t effects and covariates | YES | YES | YES | YES | YES | YES | YES | YES | YES | YES |
| c effects | YES | YES | YES | |||||||
| Household effects | YES | YES | YES | YES | YES | YES | YES | |||
| Dropping if | Teacher | School | School | |||||||
| absent | closed | closed | ||||||||
| Observations | 40,724 | 40,276 | 12,603 | 12,603 | 12,603 | 2,687 | 19,056 | 12,590 | 12,417 | 38,495 |
Notes: The table instruments both terrorist attacks and media coverage, and examines mechanism; # terrorist attacks is the number of attacks classified as terrorist per county and year; Media Access=1 if household has media access through radio signal (at least 45 dBμV according to fmscan.org); dependent variable takes value 100 if child enrolled in school by age 7 based on DHS data (columns (1), (2), and (10)), and if child is currently attending school (columns (3), (6), (8), and (9)), working outside of the house (column (4)) or staying at home (column (5)); and if adults are in work (column (7)) based on HSNP data. Column (1) instruments terrorist attacks using three instruments: attacks by AQAP, Yemen’s exports of natural gas or tobacco imports by the UAE, each divided by distance to the Somali border (see Online Appendix G.1); column (2) instruments terrorist attacks and also media coverage using lightning strikes, terrain surface and wind (see Online Appendix G.2); column (8) drops any children not attending school due to teacher absence (based on HSNP); column (9) drops any children not attending school due to school closure (based on HSNP); column (10) drops any children whose closest school is closed (based on DHS); covariates include a child’s gender, rural location, distance to closest primary school, latitude and longitude of the location, household having electricity, radio, and TV and for whether household head has secondary education; standard errors are clustered at county level and reported in parentheses.
How Credible Is the Exclusion Restriction for Media? One concern regarding the three instruments for wireless signal coverage is that lightning strikes, terrain surface and wind can have a direct effect on schooling rather than operating through coverage. It is possible, for instance, that lightning strikes discourage children to leave the house thus decreasing school enrolment. To address this concern, we exploit the fact that terrorist attacks increase markedly from around 2010 onwards. If our three instruments had a direct effect on enrolment, we would expect differences in enrolment before the stark increase in attacks. In Figure 5, we compare enrolment rates for children with high and low predicted probabilities of wireless signal coverage.23 The fact that we do not find any differences before 2010 suggests that our three instruments do not have a direct impact on schooling.
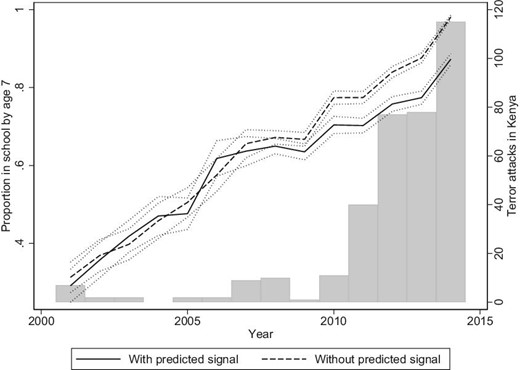
Predicted media coverage and schooling over time. Figure reports the proportion of children enrolling in school by age 7 for households with high predicted probabilities of radio signal coverage (where the first principal component of lightning strikes, ruggedness and wind at 100 m is below the mean) as solid line, and households with low predicted radio signal coverage (where the first principal component of lightning strikes, ruggedness, and wind at 100 metres is above the mean) as dashed line; 95% confidence intervals are indicated by dotted lines; bars denote total number of terrorist attacks in Kenya per year. Sources: DHS, NASA, Nunn and Puga (2012), Global Wind Atlas, and Global Terrorism Database.
3.4.2. Does Unobserved Heterogeneity Cause a Bias? Another possible concern is that unobserved household heterogeneity within counties is related to both enrolment and the exposure to attacks. For instance, it is possible that ethnic cleavages lingering from the Shifta War back in the 1960s or the colonial division of Somali homelands might still influence both terrorist attacks and school enrolment.24 Whilst this concern is partly addressed by the parallel trends shown in Figure 3 and by our instrumental variables estimates, we provide further evidence against it here.
Specifically, we re-estimate the effect of terrorist attacks using a household panel dataset covering the most affected regions. The HSNP household panel was implemented in four counties in the northern part of the country (Mandera, Marsabit, Turkana, and Wajir). Two of these counties are among the hardest hit by terrorist attacks (Mandera and Wajir). These estimations allow a comparison of children within a more homogeneous environment whilst controlling for household fixed effects. For the sake of consistency, we use the same definition of attacks, that is, attacks occurring per county and year.25 Map d in Online Appendix A shows the location of sampling clusters. Column (3) of Table 3 confirms that the negative effect of terrorist attacks on school attendance is driven by areas with radio coverage.
We use the same data to examine whether the stronger effects for households with media coverage can be explained by heterogeneous responses which are, in turn, correlated with households’ income. In Online Appendix H, we exploit the longitudinal dimension of the HSNP data to construct a household-level measure of responses to terrorist attacks. We show that the change in a household’s share of children going to school per change in attacks in the household’s county is uncorrelated with household income. Thus, stronger responses to terrorist attacks of households with media access are unlikely to be driven by differential responses to attacks by income. We explore the possible confounding role of household income further in Section 3.4.4.
3.4.3. Do Terrorists Target Areas with Media Coverage or Schools? To address the concern that unobserved heterogeneity may bias the results by simultaneously affecting media coverage and terrorist attacks, or that areas with better signal coverage or more schools attract more severe attacks, we examine the predictive power of media coverage and school density for incidences and severity of attacks. For this, we divide the whole of Kenya into 856 squares of 25 km×25 km size—see map e in Online Appendix A. For each cell, we record the total number of attacks as well as the fatalities resulting from these attacks and regress these two dependent variables on our three wireless signals: the percentage of each cell covered by radio signal or by GSM mobile network, and the distance of the cell’s centroid to the closest government antenna. Due to the temporal variation provided by the staggered rollout of GSM telephone coverage, we measure attacks and fatalities per cell and year. For the other two measures, we sum all attacks and fatalities between 2001 and 2014. Columns (1) and (4) of Table 4 show that GSM rollout is not a good predictor for attacks and fatalities. The same holds for radio signal coverage in columns (2) and (5) and distance to governmental television broadcasting antennae in columns (3) and (6). Moreover, all three measures of media access only make up a small percentage of the R-squared once we condition on cell and year or alternatively on county effects.
Attacks, media coverage, and school density.
| (1) | (2) | (3) | (4) | (5) | (6) | (7) | (8) | |
| Dependent variables | # terrorist attacks | # fatalities of terrorist attacks | ||||||
| Percentage of cell with GSM signal | 0.0009 | 0.0013 | ||||||
| (0.0006) | (0.0011) | |||||||
| Percentage of cell with radio signal | 0.0050 | 0.0008 | ||||||
| (0.0057) | (0.0091) | |||||||
| Distance to closest antenna | |$-$|0.0013 | 0.0023 | ||||||
| (0.0072) | (0.0152) | |||||||
| Schools per 1,000 inhabitants | |$-$|0.0003 | 0.0086 | ||||||
| (0.0083) | (0.0236) | |||||||
| % |$R^2$| explained by predictor | 0.7% | 2.6% | 1.2% | 0.6% | 0.7% | 1.3% | 1.2% | 0.1% |
| Total |$R^2$| | 0.318 | 0.291 | 0.289 | 0.060 | 0.191 | 0.395 | 0.395 | 0.087 |
| |$cell$| effects | YES | YES | ||||||
| c effects | YES | YES | YES | YES | YES | YES | ||
| t effects | YES | YES | ||||||
| Cell controls | YES | YES | YES | YES | YES | YES | ||
| Observations | 9,845 | 856 | 856 | 856 | 9,845 | 856 | 856 | 856 |
Notes: The table shows the predictive power of wireless signal coverage for the number and scale of terrorist attacks. For a grid of 856 squares of 25 km × 25 km size, column (1) shows the correlation between annual number of attacks and the percentage of the cell with GSM coverage; column (2) shows the correlation between total number of attacks during 2001–2014 and the percentage of the cell with radio signal; column (3) shows the correlation with distance between each cell’s centroid and the closest antenna; column (4) shows the correlation between annual number of attacks and the total number of primary schools per 1,000 inhabitants; columns (5)–(8) show the corresponding correlations with the number of fatalities from terrorist attacks; columns (1) and (5) control for cell and year effects, columns (2), (3), (6), and (7) control for average population density, latitude, longitude, distance to Somali border, and county effects; columns (4) and (8) control for latitude, longitude, distance to Somali border, and county effects; Total |$R^2$| is the |$R^2$| of all regressors, % |$R^2$| explained by predictor is the percentage of total |$R^2$| explained by each predictor alone; spatial HAC Conley (1999) standard errors with 70 km radius in parentheses (70 km allows for correlation between one cell and its eight neighbouring cells).
We repeat this exercise using school density as a predictor. To this end, we use data from the universe of Kenyan primary schools, count the number of schools within each cell, and divide it by population. As columns (4) and (8) show, the resulting measure is not a good predictor of attacks or fatalities.
3.4.4. Other Robustness Checks
In Table 5, we carry out additional robustness checks. We do not find any effect of terrorist attacks on migration of mothers. Using migration histories reported in the DHS, we create a panel for each respondent for the years 2001–2014 and define an indicator variable for whether the respondent migrated in a given year. Column (1) of Table 5 shows a parameter estimate close to zero yet precisely estimated.
Robustness.
| (2) | (3) | (4) | (5) | (6) | (7) | (8) | (9) | ||
| (1) | |||||||||
| Dependent variables | =100 if migrated | =100 if child in school by age 7 | |||||||
| # terrorist attacks | 0.018 | |$-$|0.402 | |$-$|0.358 | 0.014 | |$-$|0.399 | |$-$|0.400 | |$-$|0.647 | |$-$|0.369 | |$-$|0.414 |
| (0.057) | (0.300) | (0.313) | (0.383) | (0.301) | (0.309) | (0.109) | (0.305) | (0.301) | |
| # terrorist attacks | |$-$|0.508 | |$-$|0.556 | |$-$|0.651 | |$-$|0.478 | |$-$|0.504 | |$-$|0.490 | |$-$|0.517 | |$-$|0.409 | |
| × Radio signal | (0.187) | (0.177) | (0.197) | (0.163) | (0.158) | (0.119) | (0.167) | (0.168) | |
| c and t effects | YES | YES | YES | YES | YES | YES | YES | YES | YES |
| Distance to closest attack | YES | ||||||||
| Security spending × NE | YES | ||||||||
| GDP per capita × NE | YES | ||||||||
| attacks × population density | YES | ||||||||
| attacks × educated hhh | YES | ||||||||
| attacks × far from school | YES | ||||||||
| attacks × many rooms | YES | ||||||||
| attacks × rich | YES | ||||||||
| Data source | DHS | ||||||||
| Observations | 206,234 | 40,724 | 40,724 | 40,724 | 40,724 | 40,724 | 40,724 | 40,724 | 40,724 |
Notes: The dependent variable in column (1) takes value 100 if respondent has migrated in a given year (from DHS); columns (2–(9) show the specification in equation (1), but controlling for distance to the closest attack (column (2)), an interaction of an indicator for the northeast with Kenyan security expenditure (column (3)) or GDP per capita (column (4)), or controlling for an interaction of attacks with population density in the same 25 ×25 km cell as the respondent (column (5)), for the interaction between attacks and a dummy for the household head having primary education (column (6)), for the interaction between attacks and a dummy for the closest school being farther than 0.5 km (column (7)), for the interaction between attacks and a dummy for the residence containing more than 1 room for sleeping (column (8)), for the interaction between attacks and a dummy for the household belonging to the highest wealth quintile (column (9)); covariates include a child’s gender, rural location, latitude and longitude of the location, household having electricity, radio and TV and for whether household head has secondary education; standard errors are clustered at the county level and reported in parentheses; data are drawn from the DHS and GTD.
In columns (2)–(4), we re-estimate how the effect of attacks on schooling varies with radio signal coverage controlling for additional, potentially important factors. Across the board, the results remain very stable.26 First, we include the distance between each child and the closest terrorist attack. If the larger response to attacks in areas with signal is due to terrorists targeting these areas, the mechanism should be picked up by this additional covariate. Second, we control for public safety spending27 interacted with a northeastern dummy. We also add the interaction between GDP per capita and the northeastern dummy to account for unequal growth in those areas experiencing high terror incidences.
In columns (5)–(7), we address the potential endogeneity of media coverage further. Since more densely populated areas are more likely to have signal coverage, we interact the number of attacks with the average population density in the respondent’s 25 km cell. This specification allows for the effect of attacks to vary by population density. Similarly, we also allow for attacks to have a different effect if the head of household is highly educated (column (6)), and if the household is located more than 0.5 km from the closest school (column (7)). Throughout, the estimates remain unchanged.
A further concern is that wealthier households are both more likely to have access to media and also react stronger to attacks. Note that our IV estimates address this problem at the locational level. Here we provide further household-level evidence against this concern. In columns (8) and (9) of Table 5, we interact |${\textit{attacks}}_{it}$| in equation (1) with two proxies for household wealth: whether the family’s dwelling has more than one room for sleeping and a household wealth indicator created by the DHS, respectively. These specifications allow for attacks to affect poor and rich households differently, thus absorbing confounding variation based on differing responses. Our estimates remain stable to these changes. This finding tallies with two others we have already presented: the results in column (6), since more educated households are likely to be wealthier, and the results on heterogeneity by income presented in Online Appendix H.
3.5. Children’s Activity and Schooling Provision
To provide more evidence on the mechanisms through which terrorist attacks affect enrolment, we use detailed information on children’s activity and schooling provision from the HSNP. We also will use this data source for the structural estimation in Section 4.1.
Children’s Time Allocation.
In addition to the schooling information mentioned in Section 3.4.2, the HSNP records the major activities of household members. We use this information to classify the activities of children aged 6–14 into three groups: (i) currently attending school, (ii) working outside the house, and (iii) staying at home.28 In Section 4.1, we explicitly model how the choice between these alternatives varies with exposure to terrorist attacks and media coverage.
We find that the decrease in school attendance described in Section 3.4.2 is not accompanied by an increase in child labour, see column (4) of Table 3. Rather, we observe an almost identical increase in the likelihood of children staying at home (column (5)). To investigate potential long term effects of attacks on education, we re-estimate our effects for children about to enter secondary school (i.e. aged between 13 and 14). The fact that in column (6) we find similar effects for this sub-sample suggests that our effects have the potential of being long lasting. We also test whether terrorist attacks affect the adult labour market in column (7) and find no effect on the probability that adults are working.
Supply of Education.
Two sets of results show that the supply of education is not a significant mechanism of impact. First, we use information on school closures and teacher absences contained in the HSNP. When collecting information in 2010 and 2012 about the reasons for children not attending school, the survey asks about teacher absenteeism and school closures. Columns (8) and (9) of Table 3 re-estimate the effect of attacks on schooling whilst dropping children, who did not attend school due to teacher absences or school closures, respectively. In both cases, the results remain robust. Second, we repeat this exercise using Kenya-wide DHS data. To this end, we overlay the geo-spatial coordinates of children in the DHS with the location of all primary schools in Kenya (taken from the Kenyan Ministry for Education and shown in map i of Online Appendix A) and match each child to its closest primary school.29 Thereafter, we re-estimate the effect of terrorist attacks on schooling whilst dropping any children whose closest primary school is closed. Column (10) shows that the results remain robust to this change as well. In Online Appendix D, we also re-estimate the same specification using the three other media access measures (GSM, television, and self-reported radio ownership) and find very similar results.
4. A Model of Expectations and School Attendance
Building on the evidence for the importance of media access from the previous section, we estimate a structural model in which parents choose an activity for their children subject to their perceived risk and expected returns to schooling in the presence of terrorism. In our model, children can either attend school, work, or stay at home. The presence of terrorist attacks affects the fatality risk of any activity that involves leaving the house (i.e. attending school or working) as well as future returns to having attended school. Subjective expectations of both risks and returns, in turn, are a function of media exposure. To keep the structural estimation both credible and close to the reduced form estimates above, we exploit some of the same identifying variation as before.
Our model has three main purposes. First, by estimating the perceived risk of dying in a terrorist attack separately for individuals with and without media coverage, our model sheds light on the question whether agents with media access over-estimate fatality risk. Our finding that agents without media coverage accurately estimate fatality risks from terrorist attacks, whereas agents with coverage significantly over-estimate these suggests that media access magnifies fears rather than providing information. We also compare this to an alternative model that allows media exposure to change agents’ risk aversion. Second, the model allows us to simulate outcomes under different counterfactual degrees of fatality risk, and to obtain an estimate of the longer-term cost of terrorism.30 Finally, the model is informative about the importance of different mechanisms. In particular, we compare the effect of perceived fatality risk and of risk aversion to an expected decrease in the future returns to schooling.
4.1. Model
In line with the analysis in Section 3.5, we distinguish choices made by parents of child i in the four counties covered by the HSNP data, within which we distinguish locations with and without radio signal coverage |$l_i\in \lbrace C,NC\rbrace$|. Two of these counties (Mandera and Wajir) have seen a substantial increase in terrorist attacks since 2010. Besides county-coverage-specific effects, which ensure that our results are not driven by regional heterogeneity, the model also allows for unobserved heterogeneity in the responses to terrorism.
Childhood.
When children are of age 6, parents decide whether to enroll them in school. If children do attend school, households face a location-specific monetary cost |${\textit{cost}}_{l_i,t}$|. If not in school, children either work to earn a wage |$w^{\textit{child}}_{l_i,t}$| or stay at home. We label the three activities as S(chool), W(ork), and H(ome). Household income net of a child’s earnings is |$y_{l_i,t}$|, and the household derives utility |$u(x_i)=(x_i)^{\phi }/\phi$|, where |$1-\phi$|, with |$\phi \le 1$|, measures risk aversion. The function’s argument |$x_i$| denotes total disposable household income (including child wages and net of school costs) divided by the number of household members. In addition to the monetary payoffs associated with each activity, parents are heterogeneous in terms of their preference |$v^i_S$|, |$v^i_W$|, and |$v^i_H$| for each choice.
In the presence of terrorist attacks, children are exposed to an objective fatality risk |$\tilde{p}_{c_i,t}$| in county |$c_i$| and year t if not staying at home. Given that in the data we use for our model (Mandera, Marsabit, Turkana, and Wajir in the years 2010–2012) no attacks were targeted at schools and that school density does not predict attacks, we assume that fatality risks outside the house are independent of children’s activity.31 While we observe objective fatality rates, factors like media reporting may affect the risk perceived by parents. To explore this possibility, our model allows the fatality risk |$p_{i,t}$| as perceived by agents to vary from its objective value by a factor |$\pi _i$|, which multiplies observed fatality risk as |$p_{i,t}=\pi _i \times \tilde{p}_{c_i,t}$|. We estimate the distribution of |$\pi _i$|, which may vary for households with and without media coverage. Moreover, the model allows |$\pi _i$| to differ across households within the same locations to account for heterogeneity in responses to terror. In Section 4.4, we consider an alternative model, in which observed changes in activity choices reflect an effect of terrorism and media exposure on risk aversion. For now, we treat risk aversion (|$1-\phi$|) as an invariant “deep” parameter.
Adult Life.Positive returns to education imply that the schooling decision during childhood determines expected continuation values during adult life. Besides affecting agents’ risk perception, the rise in terrorist attacks may be seen as an indication of a longer-term deterioration of security and stability of the region, and parents may expect a decline in the future returns to education. On the other hand, a decrease in the supply of educated workers could raise the returns to schooling. The overall effect via this channel thus is theoretically ambiguous. As with perceived fatality risk, our model allows for heterogeneity also in parents’ optimism or pessimism regarding returns to education. Specifically, each attack changes the future expected wage for an educated adult by a factor |$\rho _{i}$|.
4.2. Identification and Estimation
We estimate the model using data from the HSNP evaluation (see Sections 2.2 and 3.5). In these data, we directly observe household sizes, wages for adults with and without schooling, wages earned by children, as well as the cost of schooling, which includes fees and expenses for supplies, transport, and uniform (see Table I.1 in Online Appendix I). The level of these costs is similar to that reported by Haushofer and Shapiro (2016) for the control group of their cash transfer intervention in Kenya. Regional differences within the subset of counties largely reflect rural-urban gaps in wages, schooling costs and household sizes, all of which are modeled explicitly. To absorb any other spatial differences in factors that determine activity choices for children before the ascent of terrorist attacks, we include full sets of county-coverage-specific (|$\kappa ^S_{c_i,l_i}$| and |$\kappa ^W_{c_i,l_i}$|), as well as year (|$\tau ^S_t$| and |$\tau ^W_t$|) effects in the payoff functions specified in equations (2). These parameters are estimated jointly with all other parameters. They shift the payoff for schooling and work relative to staying at home, which serves as a base category. In addition, we allow for a differential impact of terrorist attacks by media access through perceived fatality risk (|$p_{i,t}$|) and expected returns to schooling (|$\rho _i$|).32 Perceived fatality risk |$p_{i,t}=\pi _i \cdot \tilde{p}_{c_i,t}$| is a function of the heterogeneous parameter |$\pi _i$|. We call the last term the fear factor. Moreover, our model accounts for heterogeneity in these channels across individuals, conditional on media coverage.33 We implement this through a finite mixture with ten unobserved types, five of which with and five without media access. We estimate all parameters using a minimum distance estimator, exploiting for identification amongst others the variation induced by radio signal and terrorist attacks across space and time, and the effects on school attendance and child labour. The model is over-identified, and—as we show below—able to replicate the differential impact very well.
To identify |$\kappa ^S_{c_i,l_i}$|, |$\kappa ^W_{c_i,l_i}$|, |$\tau ^S_t$|, and |$\tau ^W_t$|, we target the fractions of children in school and the fractions of children working by county and year, as reported in the HSNP data. We further do this separately for children who live in locations (within county) with radio signal coverage and for those without. In the model, the incentive to invest in children’s education may be reduced for two reasons following terrorist attacks: the risk of children being hit in an attack and an expected deterioration in the returns to education. To separately identify these two channels (model parameters |$\pi _i$| and |$\rho _i$|), we draw on the estimation in Section 3.5, where we have established that terrorist attacks have a negative effect on school enrollment in Kenya, that this effect is reinforced for households with media access, and that children in affected locations more often stay at home rather that work outside the home. We use the coefficient estimates of columns (3) and (4) of Table 3 as moments for which the model predicts direct counterparts. Recall that in our data schools are not directly targeted by terrorists but that any activity outside the home exposes children to the risk. Hence, if we observe a negative effect on activities that require some traveling outside the home (work and school attendance), it implies that fatality risk is a major concern. A shift towards non-school activities (work and staying at home), on the other hand, would be informative about a decrease in the expected returns to schooling in regions affected by terrorist attacks.
By targeting heterogeneity in the effects of terrorist attacks, we can identify the distributions of the fear factor |$\pi _i$|, as well as that of expected changes |$\rho _i$| in the returns to schooling. We furthermore can distinguish these distributions for households in locations with radio signal coverage (|$l_i=C$|) in those without (|$l_i=NC$|). We implement this heterogeneity in parameters through a finite mixture of types of households, each of which is characterised by a combination |$(\pi _i,\rho _i)$|. To identify heterogeneity in |$(\pi _i,\rho _i)$|, we use the same proxy for household-level responses to attacks as referred to in Section 3.4.2. Online Appendix H describes a measure for the response |$q^S_i$| in the fraction of household i’s share of children going to school, as well as for responses |$q^W_i$| in the share of children working outside the house. Our estimation then targets quantiles of |$q^S_i$| and |$q^W_i$|.34Online Appendix Figure I.1 shows the model’s fit to these distributions. The correlation between |$\pi _i$| and |$\rho _i$| is pinned down by the joint density function of crossed quantiles of |$q^S_i$| and |$q^W_i$|. Panel (d) of Figure H.1 visualises this joint density. Online Appendix I provides further details on the estimation, including the fit for all remaining moments in Figure I.3. In particular, it provides the exact estimation criterion, and, to indicate for each parameter which moments contribute to its identification, Online Appendix Figure I.4 displays the gradient matrix of moments with respect to the parameters.
4.3. Results and Interpretation
Parameter Estimates.
The distributions of the scaling factor are reported in Figure 6, where dots indicate the estimated |$\pi _i$| for each of the 10 unobserved types, 5 in locations with (rectangles) and 5 in locations without (dots) coverage. The vertical lines denote bootstrapped 99% confidence intervals.35 For four-fifths of households in non-coverage locations, |$\pi _i$| hovers around 1. The one-fifth of households denoted by the left-most point, in contrast, barely responds to variation in attacks in their county. This finding implies that the activity choices for children for the vast majority of households without media access align with a model in which these households estimate the fatality risk correctly.
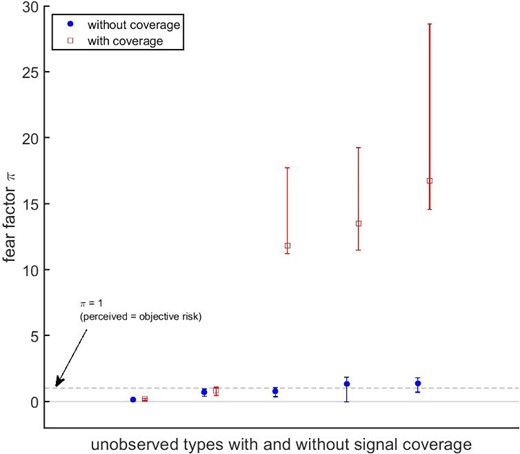
Estimates of the fear factor. The figure shows estimates of the heterogeneous fear factor |$\pi _i$|. Specifically, dots indicate the points of support for |$\pi _i$| for the finite mixture used to approximate unobserved heterogeneity in locations without signal coverage and rectangles in locations with signal coverage. Whiskers show the 99% confidence intervals obtained from 1,000 bootstrap replications.
In contrast, the estimates of |$\pi _i$| for the majority of households with media access exceed 1 by a large factor with a median of |$\pi _{{\textit{med}},C}=11.8$|. The finding that |$\pi _i$| exceeds 1 for households with radio coverage, whereas it does not for households without, suggests that media access leads to an over-estimation of fatality risks from terrorist attacks. Similar to households without radio coverage, one-fifth barely react to terrorist attacks. The estimates show a strong heterogeneity in risk perception conditional on observables. Note that our model flexibly controls county-by-coverage and time level differences through |$\kappa ^S_{c_i,l_i}$|, |$\kappa ^W_{c_i,l_i}$|, |$\tau ^S_t$|, and |$\tau ^W_t$| in equations (2).
Our findings for media’s magnifying effect on perceived fatality risks tallies with the anecdotal evidence provided in the policy reports cited earlier, and is related to other studies on media and beliefs. Becker and Rubinstein (2011) argue that fear and media coverage exacerbate subjective beliefs. Yet, the authors do not estimate their model and consequently cannot put a number on this factor. In a different context, Besley, Fetzer, and Mueller (2021) formulate a model of belief formation and estimate a media multiplier of 2.5 for the effect of terrorist violence on tourists’ credit card spending. DellaVigna and Kaplan (2007) examine the persuasion effect of Fox News on Republican votes and depending on the specification and data source estimate that the programme convinced between 3.4 and 28.3% of its audience who were not already voting Republican to do so. Using a similar model, DellaVigna et al. (2014) estimate a persuasion effect of 4.3% of Serbian radio reception on Croatian nationalist votes. For comparison, at a mean of five attacks per county and year in the most affected areas, our estimate for the fear factor rationalizes that radio access and terrorist attacks jointly decrease school enrolment by |$(5 \times 1.0)/59.0\approx 8.5\%$| (see column 3 of Table 3).
In our model, terrorist attacks further affect agents’ expectation about future returns to schooling. Online Appendix Table I.2 shows that the median household in non-coverage and in coverage locations, respectively, expects each attack in its county to decrease the wages for schooled adults by |$\rho _{{\textit{med}},NC}=1.5\%$| and |$\rho _{{\textit{med}},C}=1.1\%$|.
The Fear Factor.
With these estimates at hand, the model can be used for out-of-sample predictions and to quantify the importance of radio signal coverage for individuals’ risk perceptions. Figure 7(a) shows the effect of fatality risk by plotting the fraction of children attending school as a function of the risk as perceived by agents. The objective risk of dying in a terrorist attack in the northern counties covered by the HSNP during the years 2010–2012 ranges between 0 and 0.0057%, with an average of 0.0007%. Figure 7(a) contrasts this to the risk perceived by the median type of households, each within locations without signal coverage (in blue) and among those with coverage (in red). Fatality risk perception in areas without wireless signal coverage (blue line) is indistinguishable from the objective fatality risk (grey line). In contrast, the median household in locations with radio signal perceives a fatality risk, which exceeds these small objective probabilities by a factor |$\pi _{{\textit{med}},C}=11.8$|.
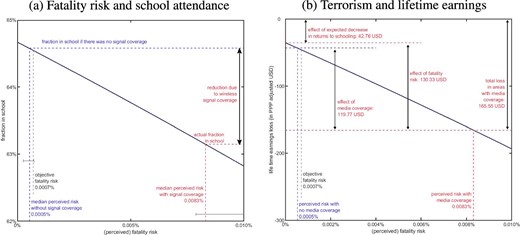
Counterfactual simulations. Simulations based on minimum distance estimates for the model parameters detailed in Section 4.1, using HSNP (2010–2012) data. Panel (a) shows counterfactual school attendance in locations with signal coverage for varying fatality risks, indicating perceptions by the median household with and without coverage. Panel (b) shows the implied loss in adults’ life-time earnings.
The Costs of Terrorism.
The threat of terrorism complemented with media coverage induces a sizable reduction in school attendance, as Section 3.1 has shown—with lasting consequences for individuals’ earnings potential. The estimated model can be used for a back of the envelope calculation of the longer-term cost of terrorism in terms of earnings forgone. Figure 7(b) shows how the expected discounted loss in earnings during an individual’s adult lifetime varies for different levels of (real or perceived) fatality risk. Expected decreases in the returns to education by individuals with radio signal lower school enrolment leading to an earnings loss of about 43 USD (PPP adjusted), even with zero expected fatality risk. Perceived fatality risk raises this loss to 166 USD, corresponding to about one quarter of a year’s average earnings of an adult who has not attended school. The largest part, 72%, of this decrease, corresponding to 120 USD, can be attributed to the higher perceived fatality risk by households living within radio signal coverage compared to those without coverage.
4.4. An Alternative Model: Change in Risk Aversion
The above model (henceforth “Model A”) rationalizes the stronger effect of terrorist attacks on school attendance in areas with wireless signal via agents’ perception of fatality risk and expected returns to schooling. In doing so, it treats risk aversion as an invariant “deep” structural parameter. Following the studies by Callen et al. (2014) and Jakiela and Ozier (2019), we also consider an alternative model (“Model B”) in which agents in all areas assess fatality risk correctly, but in which the exposure to media coverage changes risk aversion. In this model, we set |$\pi =1$| and instead allow terrorist attacks together with media access to affect the curvature of the utility function as |$u(x_i)=(x_i)^{\phi _i}/\phi _i$|. As in model A, we allow for heterogenous effects, this time on the utility function’s curvature.
We maintain the same data moments, and the only difference between the two models relates to the source of heterogeneity and hence the channel through which signal coverage may affect choices. Yet, whereas |$\pi _i$| in Model A enters only the choices of going to school and going to work, the curvature |$\phi _i$| enters utility derived for any choice made by households. It follows, that other parameter estimates may be affected by this change. In line with the studies cited above, Model B predicts a slightly higher risk aversion for agents in locations with signal coverage. Specifically, we estimate a median risk aversion |$1-\phi _{{\textit{med}},NC}=0.92$| for households in non-coverage locations, and |$1-\phi _{{\textit{med}},C}=0.95$| in locations with signal coverage (see Online Appendix Table I.3). Other estimates are only mildly affected.
These are two behavioural models rationalizing the differential effect of terrorist attacks on children’s school attendance by media access, and the choice ultimately is with the researcher. In Model A, matching observed activity choices implies an increase in fatality risk by 0.0076 percentage points, and in Model B, an increase in risk aversion by 0.03. In weighing between the two models, we note that Model B follows the spirit of the excellent research by Callen et al. (2014) and Jakiela and Ozier (2019). On the other hand, we believe that Model A is aligned more closely with the reading of anecdotal evidence, such as the UNESCO report cited in the introduction, as well as with studies documenting the difficulty of assessing low probability events with a high impact (Fischhoff et al. 2000). Finally, we also appreciate the ease of interpretation of the parameter |$\pi _i$| scaling fatality risk to its subjective level.
5. Conclusion
The findings presented in this paper show that media exacerbate the widely documented negative effect of conflict on schooling. Media reporting on terrorist acts, in particular, reduces school enrolment even after controlling for attacks carried out, a relation that is observed only for households with access to this information. Media exposure further heightens self-reported fears and safety concerns; media also prevents the effects of terrorism from decaying with distance from an attack. For the specific case of education choices, this is a channel that may well have lasting effects on longer-term economic development (Rocha, Ferraz, and Soares 2017). Based on the evidence for the importance of media, we estimate a model in which media access alters the effect of terrorist attacks on expected risks and returns of schooling. Our estimation results suggest that media may substantially raise agents’ perceived fatality risk, resulting in an inefficiently low level of school attendance. Besides a potential direct physical impact on school infrastructure or personnel that terrorism shares with other forms of violence, our results hence show that due to indirect mechanisms like fear, terrorism has a quantitatively important negative impact on the demand for education and hence the life-time earnings potential of Kenyan children. Taken together, our results show that the ever-increasing interconnectedness through media can lead to inefficient over-responses, which, in turn, decrease educational attainments. As such, our results can be considered as a caution against sensationalism and in favour of moderate and facts-oriented reporting of terrorist events.
Acknowledgements
For helpful comments, we would like to thank Jerome Adda, Vittorio Bassi, Samuel Bazzi, Sascha Becker, Eli Berman, Alfredo Burlando, Christian Dustmann, Thiemo Fetzer, Javier Gardeazabal, Markus Gehrsitz, Pamela Giustinelli, Selim Gulesci, Johannes Haushofer, Hyejin Ku, Marinella Leone, Attila Lindner, Eliana La Ferrara, Thomas LeBarbanchon, Edwin Leuven, Nicola Limodio, Stuart McIntyre, Stelios Michalopoulos, Sebastian Otten, Uta Schönberg, Guido Tabellini, Diego Ubfal, Christopher Udry, Fernando Vega-Redondo, and participants at the NBER Summer Institute, and various seminars and workshops. We would also like to thank Günter Lorenz and Peer-Axel Kroeske for assisting us with radio coverage areas. Also, we would like to thank Paolo Pinotti for help with obtaining the GSM network data, and Fred Merttens for advice on the HSNP data. Görlach is Research Fellow at CReAM, and Research Affiliate at BIDSA, CEPR, IGIER, IZA, and LEAP.
Notes
The editor in charge of this paper was Pierre Dubois.
Footnotes
Working here includes activities like herding the household’s own life stock.
Kenya-wide, only 1.4% of attacks targeted schools between 2001 and 2014.
Whilst this and other papers account for observable (typically spatial) heterogeneity, we believe that our model is the first in this literature to also allow for unobserved heterogeneity across agents.
For the importance of media in various other contexts, see Gentzkow, Shapiro, and Sinkinson (2011), Bassi and Rasul (2017), Qian and Yanagizawa-Drott (2017), Mastrorocco and Minale (2018), Besley, Fetzer, and Mueller (2021), Enikolopov, Makarin, and Petrova (2020), and Sequiera and Nardotto (2021), as well as the survey by DellaVigna and La Ferrara (2015).
The data are available under https://www.start.umd.edu/gtd/about/.
Other sources like the Armed Conflict Location & Event Data (ACLED) allow a classification of incidences as terrorist attacks only through the definition of perpetrators as terrorist organisations.
See, for instance, Anderson and McKnight (2015) for further background, and Online Appendix A for the geographical distribution of attacks across Kenya and Somalia attributed to al-Shabaab.
The most prominent attack on an educational institution was the 2015 assault on the University of Garissa. Our time frame is dictated by waves of the DHS and does not include this incident.
The data are publicly available at dhsprogram.com.
We consider children who at the time of the interview were below 14 years old. For each child, we use information on the number of years in school to construct this indicator. We drop the small percentage (6%) of children who either dropped out of school or repeated (despite it being banned), since for them we cannot correctly calculate the age at which they enrolled.
Source: https://data.worldbank.org/; accessed October 2019. Net enrolment is defined as the ratio of children of official school age, who are enrolled in school to the population of the same age.
See https://www.aerialsandtv.com/knowledge/decibels, for instance, accessed January 2021.
Whereas for GSM mobile phone coverage and radio ownership, |${\textit {signal}}$| varies across individuals and over time, radio and television coverage vary across individuals only.
If determinants of radio ownership which correlate with enrolment are not fully accounted for by our control variables, we would expect a positive bias in the estimate in column (4).
The data are freely available under https://www.gdeltproject.org/.
We follow GDELT’s suggested practice and adjust the mentions of terrorist attacks by taking out variation in the total coverage across all subjects. For easier interpretation, we report effects per 100s of mentions.
Since the Afrobarometer samples per county are smaller, we report Conley standard errors with 50 km radius.
Data are freely available under https://globalwindatlas.info/.
Since we have multiple instruments, we create the first principal component, and distinguish households in locations above and below the mean.
For a recent survey on historical legacies and African development, see Michalopoulos and Papaioannou (2020).
We have also estimated the effect of attacks within a narrow radius around respondents’ residency, and find similar effects; results are available upon request.
For the sake of conciseness, we present results for radio signal coverage, which is our preferred measure, only. Estimates for GSM and television are similar and available upon request.
In 2011–12, for instance, Kenyan forces entered southern Somalia (operation Linda Nchi), and following this also provided a contingent for the African Union Mission to Somalia (AMISOM) fighting al-Shabaab in Somalia.
We include activities related to household income generation, such as herding and helping on the family’s farm, in the category “working outside house”.
We use the universe of Kenyan primary schools provided by the Information and Communication Technology Authority to identify for each DHS respondent the closest primary school: http://www.opendata.go.ke/.
For a survey on measuring the cost of terrorism, see Gardeazabal (2012).
Even for the whole sample, as shown in Table1, only 1.4% of attacks are targeted at schools directly, while the majority is directed towards security forces, private individuals, and businesses. Columns (4) and (8) of Table 4 show that school density neither predicts the number nor the severity of terrorist attacks in our context.
We focus here on our preferred medium, radio, for which we identify signal coverage using the same data from fmscan.org as in the previous sections.
Primary school in Kenya covers ages 6–14, and so in the estimation, we set |$T_c=8$|. Life expectancy in Kenya in the middle of our sample period for the HSNP (2011) was 64 years. Correspondingly, we set |$T_a=64-14=50$|. We take risk aversion from experiment-based estimates by Gandelman and Hernández-Murillo (2015). While they do not provide estimates for Kenya, they estimate relative risk aversion to be, respectively, 0.67 and 1.26 for the neighbouring countries Uganda and Tanzania. We thus set risk aversion |$(1-\phi )=0.965$| as the mid-point between these two numbers. In Section 4.4, we consider an alternative model in which we estimate risk aversion directly. The discount factor is set to |$\beta =0.9$|. Finally, using population and fatality numbers from our Kenyan datasets, we calculate annual probabilities |$\tilde{p}_{c_i,t}$| of dying in a terrorist attack ranging between 0 and 0.0057%.
We approximate unobserved heterogeneity via 10 types of households, 5 in locations with and 5 in locations without signal coverage. Accordingly, we target the mid-points in quintiles of |$q^S_i$| and |$q^W_i$| in non-coverage and coverage locations.
These are based on 1,000 bootstrap replications. Note that asymptotic standard errors are not meaningful in this context, since parameters are defined only on |$\mathbb {R}_0^+$|, and confidence intervals are thus asymmetric.
