


Abstract
Who becomes a top politician in China? We focus on provincial leaders—a pool of candidates for top political office—and examine how their chances of promotion depend on their performance in office and connections with top politicians. Our empirical analysis, based on the curriculum vitae of Chinese politicians, shows that connections and performance are complements in the Chinese political selection process. This complementarity is stronger the younger provincial leaders are relative to their connected top leaders. To provide one plausible interpretation of these empirical findings, we propose a simple theory in which the complementarity arises because connections foster loyalty of junior officials to senior ones, thereby allowing incumbent top politicians to select competent provincial leaders without risking being ousted. Our findings shed some light on why a political system known for patronage can still select competent leaders.
1. Introduction
Who becomes a top politician in China? The spectacular economic performance of the Chinese economy in the past few decades suggests that the politicians selected to rule the country may have been conducive to growth, or at least not detrimental to economic development. What has made it possible for China to place such politicians in top government positions? The existing literature on political selection remains inconclusive as to what determines the selection of politicians in a nondemocratic country like China.1 In this paper, we contribute to this literature by examining factors determining the promotion of China's provincial leaders, a pool of candidates for top positions in the central government. In particular, we focus on two determinants of promotion often discussed by academics and observers of Chinese politics: performance and connections.
On the one hand, several empirical studies suggest that the political selection in China is based on meritocracy: provincial leaders are more likely to be promoted if they achieve higher economic growth in their province (Maskin, Qian, and Xu 2000; Bo 2002; Li and Zhou 2005; Chen, Li, and Zhou 2005). Xu (2011) provides a thorough survey of this literature. On the other hand, anecdotal evidence and a systematic empirical analysis by Shih, Adolph, and Liu (2012) imply that patronage is key: it is the social connections to top leaders that determine the chance of promotion.2 These two views also feature prominently in the mass-media coverage of Chinese politics.3 However, the debate over meritocracy versus patronage in political selection is puzzling. If China's political system is based on patronage, how has the system been successful at selecting leaders who have played a critical role in promoting growth? Conversely, if China's political selection is essentially a meritocracy, why do observers emphasize the roles of connections?
In this paper, we argue that considering either or both of these two aspects in isolation fails to take into account the possibility of important interaction effects between connections and performance in the promotion process. By using data on connections constructed from the curriculum vitae of Chinese politicians, we show empirically that connections and performance are complements in the Chinese political selection process. We also find that this complementarity is stronger the younger provincial leaders are relative to their connected top leaders in the central government.
To provide one plausible explanation for this empirical pattern, we propose a simple theory in which the complementarity arises because connections foster loyalty of junior officials to senior ones, allowing incumbent top politicians to select competent provincial leaders without risking being ousted. Since the interdependent roles of connections and performance in the promotion decision have been neglected in the previous literature, we start by presenting a simple model of promotion to illustrate a few theoretical mechanisms through which connections and performance may jointly affect the chance of promotion. In this model, promotion acts as a screening device.4 Connections play three possible roles: loyalty (increasing the survival probability of top politicians), learning (conveying information about the ability of candidates for promotion) and communication (conveying information about the provincial economy through close communication between top politicians and provincial leaders, making provincial economic performance a stronger signal of the ability of provincial leaders). When either the loyalty or communication role of connections dominates, connections and performance complement each other in increasing the chance of promotion. If the learning role dominates, on the other hand, the two determinants of promotion are substitutes. While other mechanisms may also explain the interdependence of connections and performance (see Section 3.3), we focus on these channels because we believe they are most relevant, and because data are available for testing their implications.
To investigate empirically whether connections and performance are complements or substitutes in the Chinese political selection process, we construct a sample of provincial leaders who held office between 1993 and 2009. Using the curriculum vitae of Communist Party officials, we measure connections between these provincial leaders and the top seven or nine party officials at the center based on whether they used to work in the same branch of the party or the government in the same period.5 To measure performance, we follow the literature and use the real GDP growth of the province that each leader rules.
We then estimate the correlation between promotion and the interaction of connections and performance, conditional on fixed effects for provinces, years, and the number of years in office. We find that connected provincial leaders are, on average, significantly more likely to be promoted than unconnected ones. However, this difference is driven by a stronger positive correlation between promotion and economic growth for connected officials. Quantitatively, the difference between the two groups is large. A one standard deviation increase in growth raises the probability of promotion by 5.3 percentage points more for connected officials than for unconnected ones, where the sample average promotion rate is 7%. Weakly performing provincial leaders are unlikely to be promoted irrespective of their connections, while connections increase the likelihood of promotion for strongly performing provincial leaders. In other words, connections and performance are complements in the promotion of provincial leaders in China.
Our connection measure may be correlated with other factors irrelevant of social connections. However, we find that a wide range of observable characteristics are comparable between connected and unconnected provincial leaders, including the provincial economic growth before assuming office and the central government's support (fiscal transfers, state-owned bank loans, and the Special Economic Zone policy).
Also, provincial economic growth may not reflect the performance of provincial leaders.6 We find no evidence of provincial economic growth correlated with other factors such as the strength of connections. We also provide evidence that provincial economic growth does change depending on who rules the province.
Even if connections and performance are properly measured, unobservable determinants of promotion may change with performance differentially between connected and unconnected provincial leaders. To show that our complementarity result is not driven by such “differential trends”, we check the robustness of our finding to controlling for a wide range of covariates and their interaction with growth. Our results are remarkably robust to these controls. In addition, we do not find a similar pattern of correlation with promotion for connections to other high-ranked politicians who are not in charge of promotion decisions. This finding suggests that having connections is not simply an indication of being on the elite career track. The documented correlation of connections and promotions is driven by whether the provincial leader's connections hold power in the highest decision-making body in the Communist Party, which is plausibly beyond the control of each provincial leader.
In light of our theoretical framework, the evidence relating to the complementarity of connections and performance is consistent with both the loyalty and the communication roles of connections. We further evaluate which role is likely to be dominant. First, we explore age differences of the connected pairs. Compared to peers of similar ages, who may politically compete with each other, a senior–junior connection is more likely to be the indicator of loyalty. We find that the complementarity is stronger for the connected pairs where provincial leaders are substantially younger than the PSC members. Second, we exploit the provincial leader's tenure. The degree of complementarity solely due to the communication role of connections should attenuate during the provincial leader's tenure, because the longer the tenure, the less noisy the provincial growth measure becomes as a signal of the ability. We do not find this to be the case, a result that the communication role alone cannot explain. Taken together, these two pieces of evidence support the loyalty role of connections.
Finally, we focus on a subset of provincial leaders who hold provincial leadership positions more than once so that we can measure their performance in terms of provincial economic growth after the promotion decision is made. We find a positive correlation of provincial economic growth between the first and second terms, suggesting that the ability of provincial leaders does appear to affect the economic performance of the province they rule. Also, we do not find that this positive correlation is weaker for connected provincial leaders, implying that the observed promotion pattern is not very inefficient.
Our findings contribute to several strands of the literature. To the best of our knowledge, we are the first to document that connections and performance complement each other in the political selection process in China or a nondemocratic country in general. We are also the first to suggest that social connections among politicians may be critical for selecting competent leaders in the absence of democratic elections. This finding provides a new perspective to the large literature on the impact of social connections to politicians. Fisman (2001), Khwaja and Mian (2005), and Blanes i Vidal, Draca, and Fons-Rosen (2012), among others, estimate the value of connections in different contexts.7
Our study also relates to the recent macroeconomic literature on high growth and misallocation in China. Hsieh and Klenow (2009), Song, Storesletten, and Zilibotti (2011), and Brandt, van Biesebroeck, and Zhang (2012) have shown the importance of resource reallocation in China's growth process. Our findings imply that top political leaders in China have an incentive to promote those provincial leaders who achieve high growth as long as they are connected. This incentive on the part of top leaders both ensures the competence of politicians in high office and encourages provincial leaders to achieve economic growth. We complement the existing macroeconomic studies by suggesting social connections forged among Chinese politicians as one of the microeconomic determinants of the growth process of China.
Finally, our study speaks to the role of connections and performance in the selection process beyond the political arena. Li (2013) studies the determinants of research grant approval and finds that the applicant's connections with reviewers complement the quality of research projects. She interprets this finding as reviewers being more informed about the quality of research of their connected applicants, a mechanism equivalent of the communication role of connections in our theoretical framework. In her context, reviewers are unlikely to be threatened by successful grant applicants. More generally, however, the complementarity between connections and performance may emerge due to the loyalty role of connections. Our theoretical framework encompasses both of these roles of connections that imply complementarity, and we suggest an empirical methodology that can disentangle these channels.
The next section briefly introduces relevant aspects of the Chinese political system. Section 3 then lays out a simple theoretical framework describing how connections and performance may interact with each other to affect the probability of promotion. Section 4 describes the data and the empirical strategy. Section 5 provides evidence that connections and performance are complements. Section 6 then offers further evidence that the complementarity is stronger the younger provincial leaders are relative to their connected top politicians in the central government. Section 7 discusses the performance of provincial leaders after the promotion decision is made. Section 8 concludes the paper.
2. Institutional Background
China's highest decision-making body is the Politburo Standing Committee (PSC) of the Communist Party of China. It consists of seven (or nine during 2002–2012) party officials including the General Secretary (the head of the Communist Party) and the Premier (the head of the Chinese government). Although the procedure of its decision making is not public information, it is commonly believed that members of the PSC meet once a week and make decisions by consensus (Shirk 1993; Miller 2004; McGregor 2010). Among other things, the committee decides on which provincial leaders to promote.
Each of the 31 provinces of China (including four municipalities with provincial status and five autonomous regions) has two political leaders: provincial secretary and provincial governor. The former is the head of the provincial branch of the Communist Party, and the latter is the head of the provincial government. Provincial secretaries are ranked equally to ministers in the central government, and ranked higher than provincial governors. By “provincial leaders”, we mean either of these two political leaders in each province.
Provincial leaders in China have a large discretion over economic policies at the provincial level while their career prospects are controlled by the central government.8 Provincial economic performance, specifically real GDP growth, is considered to be a performance measure highly relevant to the PSC's promotion decision (Maskin, Qian, and Xu 2000).
Promoted provincial leaders may join the Politburo of the Communist Party (the second most powerful decision-making body after the PSC) and/or become Vice-Premier or State Councilor, the highest positions in the central government after the Premier. In other words, promoted provincial leaders become close colleagues of the PSC members. Promoting political enemies may thus threaten the power of the PSC members.
3. A Simple Model
This section proposes a simple theoretical framework to illustrate three empirically testable mechanisms through which the interplay of connections and performance emerges in the promotion decision for Chinese provincial leaders. We employ a simplified version of the standard career concern model (Holmström 1982) to formalize the promotion process as a screening device with the PSC as the unitary decision maker. In this framework, we incorporate three potential roles of social connections discussed in the literature. First, connections may foster loyalty of provincial leaders to PSC members, implying that the probability of the PSC to survive in office is higher if the PSC promotes a connected provincial leader. The literature on Chinese politics (e.g. Dittmer 1995) argues that Chinese political leaders build a network of loyal followers to reduce the uncertainty of their political survival. We call this first role of connections loyalty.
The second and third roles of connections are both informational. Connections may provide PSC members with two types of information: the ability of provincial leaders and the economic conditions of the province they rule. The literature on social connections in labor markets (see Ioannides and Loury 2004 for a review) often assumes that connections mitigate asymmetric information on the ability of potential employees or that information flows through connections. It is plausible that PSC members know the ability of their connected provincial leaders better than that of those unconnected. We call this second role of connections learning. It is also likely that PSC members communicate more often with their connected provincial leaders and that such interactions transmit the information on the provincial economy over and above its GDP growth rate. We call this third role of connections communication.
Our model shows that complementarity between connections and performance arises when either the loyalty or communication role of connections dominates. Connections and performance are substitutes when connections mostly play the learning role. In Section 5, we report evidence for the complementarity of connections and performance. In Section 6, we then provide further evidence for the loyalty role of connections.
Other mechanisms may also explain complementarity or substitutability of connections and performance. We discuss these in Section 3.3.
3.1. Model
Consider a simplified version of the standard career-concern model, in which the PSC is the only strategic player and unitarily decides whether or not to promote a provincial leader. For simplicity, provincial leaders are assumed to be nonstrategic: we do not consider their effort-making to boost growth. As we show in the Online Appendix Section C, the theoretical results are mostly robust to a strategic provincial leader whose effort affects provincial growth as in the standard career-concern model.
We now introduce three roles of connections into this framework. Let |$C_i \in \{ 0,1\}$| be an indicator that takes the value of one if |$i$| is connected to the PSC and zero otherwise.
Loyalty.
The loyalty role of connections assumes that the probability for the PSC of staying in power depends on |$C_i$|, where this probability, denoted by |$p(C_i)$|, satisfies |$p(1) \gt p(0)$|. Unconnected officials are more likely to attempt to oust other PSC members than connected ones, if they are promoted.
Learning.
The first informational role of connections, learning, works through the variance of |$a_i$|. We assume that the ex-ante distribution of |$a_i$| is known to be normal with mean |${\bar a}$| and variance |$\sigma_a (C_i)$|.9 Moreover, connections equip the PSC with more precise information on the ability of provincial leader |$i$|, implied by |$\sigma_a (1) \lt \sigma_a (0)$|.
Communication.
The second informational role of connections, communication, works through the variance of |$\varepsilon_i$|. We assume that |$\varepsilon_i$| is known to be normally distributed with mean zero and variance |$\sigma_\varepsilon (0)$|. Connections allow the PSC to learn more about the economic conditions of |$i$|'s province, hence |$\sigma_\varepsilon (1) \lt \sigma_\varepsilon (0)$|.
If the PSC does not promote |$i$|, its payoff is given by |${\bar u}$|, which may represent the payoff of promoting the most able official in the central government or leaving the high-office position vacant. Provincial leader |$i$| is promoted if |$W_i^{C_i } \ge \bar u$|. Assuming that |${\bar u}$| is distributed by the cumulative density function |$F(\bar u)$|, the probability of promotion for |$i$| is |$F(W_i^{C_i })$|. For simplicity, we assume that |${\bar u}$| is uniformly distributed with the probability density |$\mu$|.10
Before we proceed to the analysis of this model, a few of its assumptions merit discussions here. First, the loyalty role of connections takes the form of increasing the PSC's probability of survival, instead of directly entering into the PSC's payoff. This assumption reflects not only the possibility of coup d'état but also that of pro-democracy political reforms advocated by party officials. The introduction of multiparty democracy, for example, will reduce the probability of staying in power for the Communist Party, and thus for the PSC. It is plausible that connected officials are unlikely to push ahead policies that threaten the power of their connected senior officials. In Online Appendix Section A, we discuss two cases during two critical moments in modern China's history that may shed light on how connections affect loyalty. The first case shows the loyalty of Li Zuopeng to his patron Lin Biao in the political struggle between Lin and Mao Zedong. The second case discusses how the disagreement between Zhao Ziyang and Deng Xiaoping in the Tiananmen Square protests might be related to the fact that Zhao was promoted on the basis of ability.
Second, we assume that the provincial leader's ability affects the economic growth of the province he rules. This assumption reflects the fact that provincial leaders have a large discretion over economic policies at their province, as mentioned in Section 2. In Section 7, we also provide supporting evidence that, among those officials who serve provincial leadership for more than one spell, the provincial economic growth during their second term is positively correlated with that during their first term. Furthermore, as discussed in Online Appendix Section B, we find that provincial leader fixed effects jointly affect annual provincial GDP growth at the 1% significance level.
Finally, we assume that the PSC cares about the ability of promoted officials only when the PSC remains in power. PSC members may prefer promoting more talented officials because working with able colleagues reduces the disutility from running the government. PSC members may also prefer promoting able officials because they expand the total amount of political rent to be shared by party cadres. Our model, however, does not assume that the PSC members benevolently prefer a higher quality of government. If so, they would care about the ability even after leaving office.
3.2. Analysis
Inspecting equation (5) yields the following proposition.
Proposition 1.
The effects of connections and growth on promotion are:
Independent if
(a)|$\eta = 0$|or|$h(C_i) = 0(i.e.\sigma_3 (C_i) = \infty)$|. In this case, provincial growth does not affect the promotion probability, and the PSC is more likely to promote connected officials as long as|$p(1) \gt p(0)$|.
(b)|$\eta \gt 0,h(C_i) \gt 0$|, but|$p(1)h(1) = p(0)h(0)$|. In this razors-edge case, the promotion probability increases with growth, but not with connections.
- Complementary if|$\eta \gt 0$|and(6)$$\frac{{p(1)}} {{p(0)}} \gt \frac{{h(0)}} {{h(1)}}.$$
- Substitutes if|$\eta \gt 0$|and(7)$$\frac{{p(1)}} {{p(0)}} \lt \frac{{h(0)}} {{h(1)}}.$$
Proof.
Substitution of parameter conditions into expression (5) and comparison between |$C_i = 1$| and |$C_i = 0$| trivially prove the statements in the proposition.
Proposition 1 shows that the interplay of connections and growth in affecting the promotion probability requires three conditions: (1) the PSC cares about the ability of promoted officials, (2) provincial growth contains a signal on the ability of provincial leaders, and (3) connections play at least one of the three roles specified in this model.11
The proposition also shows which type of roles of connections leads to complementarity or substitutability of connections and performance. If the loyalty role of connections (represented by |$p(1)/p(0)$|) is large enough, the complementarity arises. On the other hand, the informational roles of connections lead to the substitutability if the learning role dominates (i.e., |$h(0)/h(1)$| is large enough due to |$\sigma_a (1) \lt \sigma_a (0)$|), and to the complementarity if the communication role dominates (i.e., |$h(0)/h(1)$| is small enough due to |$\sigma_\varepsilon (1) \lt \sigma_\varepsilon (0)$|).
The Online Appendix Section C discusses several extensions of the previous model. First of all, the probability of staying in office, |$p(C_i)$|, may decrease in |$a_i$| if competent officials threaten the survival of top leaders.12 On the other hand, connections may mitigate this threat by fostering loyalty. In this case, a similar result to Proposition 1 holds as long as |$g_i$| does not take extreme values and, if |$h(0) \gt h(1),h(0)/h(1)$| is sufficiently smaller than |$p(1)/p(0)$|.
Second, provincial leader |$i$| may be able to boost the economic growth of his province by exerting effort (as in a standard career-concern model). As long as ability and effort affect growth additively, however, such strategic behavior of provincial leaders does not alter our result.
Finally, average ability, |${\bar a}$|, for example, may depend on |$C_i$|. Connected provincial leaders may have a higher |${\bar a}$| if the PSC can screen out less able candidates for provincial leadership positions among those connected. However, as expression (5) does not contain |${\bar a}$|, allowing connections to influence |${\bar a}$| does not change the previous result.13
In summary, the previous analysis shows that the effects of connections and growth on promotion can be intertwined, an insight that has been ignored in the previous literature. In the empirical analysis to follow, we investigate whether the promotion probability indeed responds to the interaction of connections and growth.
3.3. Discussion
Other mechanisms may also explain the complementarity (or substitutability) of connections and performance. First of all, while in our model promotion plays a role of screening, the literature on the career of Chinese provincial leaders often emphasizes the role of promotion as an incentive scheme for provincial leaders to boost economic growth (e.g., Maskin, Qian, and Xu 2000). In the Online Appendix Section D, we show that a model of promotion as an incentive scheme predicts the interdependence of connections and performance as long as the PSC can commit to the promotion scheme, which may be a strong assumption (Fairburn and Malcomson 2001).
Second, connections may play an informational role in a different sense. The PSC members may be too busy to spend a lot of time deciding who to promote. Consequently they may pay more attention to connected provincial leaders than unconnected ones. This attention-creating role of connections would also predict the complementarity of connections and growth. Although our empirical analysis cannot completely exclude this possibility, we believe that it is unlikely. Promoted provincial leaders will assume top positions in the central government. The PSC members should thus spend enough time to consider all the candidates for these top positions, including those not connected to them, to select the best officials. If the PSC ignores unconnected provincial leaders, it is likely to be because the lack of connections involves the lack of desirable qualities such as loyalty.
Third, the interplay of connections and performance can also emerge from a model in which the PSC's preference is additive in the ability of the promoted official and the direct benefit from having a connected colleague (altruism to connected people or the joy of working with friends, for example). If the threshold for promotion is high due to a small number of vacant positions, this model predicts complementarity because either high ability or connectedness alone is not enough to pass the threshold. If the threshold for promotion is low, on the other hand, the model predicts substitutability. Due to the lack of sufficient variation in the number of vacant positions in our data, we cannot empirically test this possibility.
Finally, in our model, the PSC is assumed to be the unitary actor. Bargaining among PSC members with conflicting interests may also yield complementarity or substitutability of connections and performance. Empirically, this mechanism is difficult to test. We know very little about the actual bargaining process of the PSC. In addition, during the sample period of our data (1993–2009), the membership composition of the PSC only changed three times, not enough to test the implications of a bargaining model. We leave the testing of this interesting hypothesis to future research.
4. Data and Empirical Strategy
Our main data source is China Vitae (2012), a website run by a nonprofit organization in the United States. It publishes curriculum vitae (CV) of Chinese Communist Party officials who have held important positions since late 1992. The CV includes the year of birth, the province of birth, colleges attended, and, most importantly, the list of positions held in the party or in the government (including state-owned enterprises) in the past, along with the period in which each position was held.
We first explain how our sample of provincial leaders is selected and then explain how we use their CV to measure promotion and connections. We also discuss the data on provincial economic growth and present summary statistics. After presenting the data, we explain our main empirical strategy.
4.1. Sample
We focus on provincial secretaries and governors, who held office for at least twelve months between June 1993 and June 2009.14 There are 275 provincial leadership spells (137 secretaries and 138 governors) that satisfy this criterion. From this set of spells, we drop 17 (seven secretaries and ten governors) whose CV is not available in China Vitae (2012). Since some officials assume a provincial leadership position more than once, the total number of officials in the sample is 187, less than the 258 observed leadership spells.
4.2. Promotion
We define the promotion of provincial leaders in the least controversial way. We regard a provincial secretary as promoted if he becomes a member of the Politburo (the second highest decision-making body in the Communist Party, consisting of 20 to 25 members that include all members of the PSC), a Vice-Premier or a State Councilor in the central government.15 A provincial governor is promoted if he becomes a secretary of the same or a different province. There is no instance where a provincial governor joins the Politburo or becomes a Vice-Premier or a State Councilor.
Assuming other positions in the central government such as vice-chairmanship of the Chinese parliaments (National People's Congress and Chinese People's Political Consultative Conference) and, for governors, the head of a ministry could perhaps also be seen as promotion (see Tao et al. 2010). In Online Appendix Section E, we find that our results are robust to these wider definitions of promotion, suggesting that our findings are not dependent on a particular way of measuring promotions.
4.3. Connections
We measure the connection between a pair of party officials by whether they used to work in the same branch of the Party or of the government at the same time. In particular, we focus on links between each provincial leader and any current member of the PSC, given that the PSC is in charge of the decisions on the promotion of provincial leaders.16 The connection indicator can thus change for the same provincial leader if his connected PSC member resigns or if his connected official joins the PSC. In our sample period, we find that connections between PSC members and provincial leaders are mostly formed at the provincial branches of the Party and of the government, but also at central bodies such as ministries, the National People's Congress, and the Communist Youth League.17
The number of connections is at most two in our data. In Section 6.3 we briefly look at how promotion patterns differ by the number of connections.
The focus on workplace-based connections among Chinese politicians is motivated by the anecdotes mentioned in footnote 2: General Secretaries promoted their former colleagues once they assumed power. However, the literature on informal politics in China (see Dittmer 1995, for example) also points out the importance of other sources of connections among politicians, such as graduating from the same college or hailing from the same province. In Section 5.5 we investigate whether these alternative sources of connections are also of importance.
An estimation of the effect of connections defined in this way should be seen as an “intention-to-treat” analysis, using the language of the program-evaluation literature. Having worked together in the past does not necessarily mean being loyal to each other, well informed about each other's ability, or frequently in touch. However, it is plausible that having worked together increases the probability of being loyal to, familiar with, and/or in close contact with each other. As a result, if we do not find connections significantly correlated with promotion, we should not interpret this to say that connections are unimportant.
4.4. Economic Growth
The data on provincial annual real GDP growth up to year 2009 are obtained from the National Bureau of Statistics of China (2012, 2011).
One may question the reliability of the provincial GDP growth data, given the possibility that higher growth increases the chance of promotion for top provincial politicians. The central government of China ensures the reliability of provincial GDP data in two ways.18 First, each provincial government is required to submit the figures for various subcomponents of GDP. The National Bureau of Statistics (NBS) in the central government then double-checks the total GDP figure by aggregating these subcomponents on its own. Second, the NBS conducts its own survey to obtain its own estimates of provincial GDP. Therefore, even though provincial leaders may have an incentive to over-report the growth of their provincial economy, the provincial GDP data should reflect the actual performance of the economy to a large extent.19
Our empirical analysis that follows controls for province and year fixed effects so that the difference in the extent of over-reporting across provinces and across years does not affect our results. More serious is the concern that the extent to which provincial leaders over-report provincial GDP growth differs by their connection status. Our analysis deals with this concern in three ways. First, connected provincial leaders do not necessarily report higher growth than unconnected ones, as shown in the bar graph of Figure 1. Second, among connected provincial leaders, growth is not significantly different by the observable strength of connections, as shown in Section 5.3. Thus, it is unlikely that only provincial leaders who are strongly connected can over-report growth. Finally, if connected provincial leaders report growth more accurately than unconnected ones, we would observe the complementarity of connections and performance due to the communication role of connections. In Section 6.2, we show that the communication role alone cannot explain our findings.
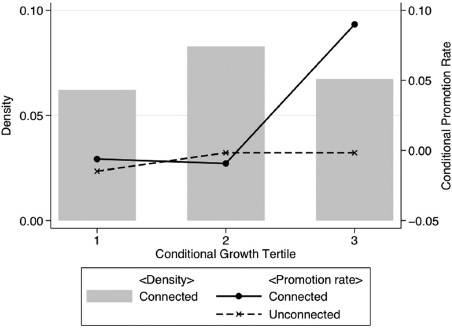
Promotion–growth relationship by connection. See the text for how this graph is constructed.
4.5. Summary Statistics
Column (1) of Table 1 reports summary statistics for the variables used in the following analysis at the level of 258 leadership spells. Columns (2) and (3) restrict the sample to provincial secretaries and governors, respectively. About a quarter of the provincial leadership spells end with promotion. The promotion rate is lower for secretaries, consistent with the fact that secretaries are more highly ranked than governors in the Communist Party hierarchy. The share of spells with the provincial leader connected to PSC members for at least one year is about a quarter, with a slightly higher share for secretaries. The mean of average annual provincial real GDP growth since assuming office is around eleven percentage points. Each leadership spell lasts 4.3 years on average, consistent with the fact that the Communist Party makes major personnel decisions every five years when the Party Congress is held.
Descriptive statistics
| (1) All spells | (2) Secretary spells | (3) Governor spells | (4) Leader years | |
|---|---|---|---|---|
| Measures of promotion | ||||
| Promoted | 0.26 | 0.18 | 0.34 | 0.07 |
| Minister | 0.29 | 0.18 | 0.40 | 0.08 |
| NPC | 0.31 | 0.19 | 0.42 | 0.08 |
| CPPCC | 0.33 | 0.22 | 0.45 | 0.09 |
| Measures of connections | ||||
| Connection | 0.25 | 0.27 | 0.23 | 0.21 |
| Class | 0.07 | 0.07 | 0.07 | 0.05 |
| Alumni | 0.12 | 0.13 | 0.11 | 0.10 |
| Birth province | 0.41 | 0.44 | 0.39 | 0.36 |
| Growth | 0.11 (0.02) | 0.11 (0.02) | 0.11 (0.02) | 0.11 (0.02) |
| Term length | 4.29 (2.27) | 4.39 (2.42) | 4.18 (2.12) | 3.23 (2.14) |
| Time-invariant covariates | ||||
| Age | 56.28 (3.93) | 57.18 (3.90) | 55.36 (3.75) | 56.24 (3.75) |
| Previous growth | 0.11 (0.02) | 0.11 (0.02) | 0.11 (0.03) | 0.11 (0.02) |
| College graduate | 0.82 | 0.82 | 0.82 | 0.82 |
| Served in center | 0.40 | 0.43 | 0.36 | 0.36 |
| Home | 0.23 | 0.15 | 0.31 | 0.26 |
| Princeling | 0.05 | 0.05 | 0.04 | 0.04 |
| Time-variant covariates | ||||
| PSC work province | 0.24 | 0.24 | 0.23 | 0.24 |
| PSC home province | 0.26 | 0.25 | 0.28 | 0.22 |
| Future/past connection | 0.21 | 0.22 | 0.21 | 0.18 |
| Workplace | 0.31 | 0.35 | 0.27 | 0.24 |
| Politburo connection | 0.27 | 0.27 | 0.27 | 0.21 |
| Observations | 258 | 130 | 128 | 966 |
Notes: Reported in each cell is the sample mean (and standard deviation in parentheses for continuous variables). The sample includes all leadership spells in column (1), provincial secretary spells in column (2), provincial governor spells in column (3) and leader–years in column (4). See Online Appendix Section G.2 for variable definitions. In columns (1)–(3), measures of promotion and Growth refer to the last year of the spell; measures of connections and time-variant covariates are the maximum value during the spell.
In the empirical analysis that follows, we construct a leader–year level sample in which each leadership spell is observed annually until the leader is transferred to another position, irrespective of whether it is a promotion or not. This process results in 966 observations. The summary statistics for this sample are reported in column (4) of Table 1.
Figure 2 shows the rate of promotion (the line graph) and the distribution of tenure length (the bar graph) by the number of years in office. It shows that the chance of promotion increases until the fifth year in office and declines thereafter. The peak at five years is expected, since many of the personnel decisions are made at the National Congress of the Communist Party which is held every five years. The figure also shows that the majority of leadership spells ends in five years or less.
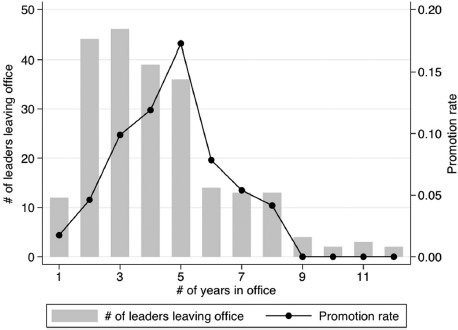
Distribution of term lengths and promotion rates by number of years in office. See the text for how this graph is constructed.
4.6. Empirical Strategy
The structure of the leader–year level data suggests using a competing risks model, in which observations exit from the data through more than one type of event (promotion and nonpromotional transfer in our case). However, in what follows we treat nonpromotional transfers as right-censoring by assuming that nonpromotional transfers occur randomly. Furthermore, we use a linear probability model of promotion, instead of a Cox proportional hazard model, by assuming that the duration of each leadership spell does not depend on connection status and growth. Although these assumptions are restrictive, the linear probability model allows us to control for unobservable heterogeneity across provinces and years that can differ between secretaries and governors, which we believe is important in our context to minimize the bias in the estimation.20
The dependent variable, |$P_{iopt}$|, is the indicator that takes the value of one if provincial leader |$i$| in office |$o$| (secretary or governor) in province |$p$| is promoted in the period from July of year |$t$| to June of year |$t + 1$|.21 We have three regressors of interest. The first is |$C_{it}$|, the indicator of leader |$i$| being connected to the members of the PSC in office in June of year |$t$|. The second is |$G_{iopt}$|, the average annual growth rate of province |$p$| since leader |$i$| assumed office |$o$| until year |$t$|, measured as the deviation from the sample mean, |${\bar G}$| (11.4%). The last is the interaction term of these two variables. To facilitate the interpretation of the coefficient on the connection indicator, |$\alpha$|, the growth variable is demeaned so that |$\alpha$| measures the difference in the probability of promotion between connected and unconnected officials displaying average growth performance.
Province and year fixed effects are allowed to differ between secretaries and governors (|$\mu_{op}$| and |$\eta_{ot}$|). Controlling for province fixed effects ensures that the coefficients of interest |$(\alpha,\beta,\gamma)$| do not pick up the possibilities that certain provinces which grow more quickly also have their leaders more likely promoted and connected. Controlling for year fixed effects incorporates the possibility of relative performance evaluation, often discussed in the literature on Chinese political selection (e.g., Maskin, Qian, and Xu 2000; Chen, Li, and Zhou 2002).22 It also allows for higher promotion rates in Party Congress years, in which many personnel decisions are made.
Since the promotion probability changes nonlinearly with the number of years in office, as suggested by Figure 2, we also control for a set of dummies for the number of years in office from two to twelve |$(T_{iopt}^\tau)$|.
The coefficient on the interaction term of connections and growth, |$\gamma$|, is negative if the two determinants of promotion are substitutes, and is positive if they are complements. To understand the possible sources of bias in the estimation of |$\gamma$|, it is helpful to use the analogy with the difference-in-differences estimation. We first compare the promotion rates between connected and unconnected provincial leaders. We then compare changes in this difference by achieving higher growth. If unobservable determinants of promotion differentially change by higher growth between connected and unconnected provincial leaders, the estimated |$\gamma$| is biased. In Section 5.4, we check this possibility by controlling for |$\boldsymbol {x}_{iopt}$|, a vector of characteristics of provincial leader |$i$| and province |$p$| in year |$t$|, and its interaction with |$(G_{iopt} - \bar G)$|.
Finally, standard errors are clustered at the province level given that both growth rates |$(G_{iopt})$| and the error term are likely to be serially correlated within each province, and |$C_{it}$| tends to take the same value for the same province for a certain number of years. As the low number of Chinese provinces (31) may cause an underestimation of even the clustered standard errors, we also report |$p$|-values on the significance of the estimated |$\gamma$| by using the wild cluster bootstrap-|$t$| procedure (Cameron, Gelbach, and Miller 2008).
5. Evidence for Complementarity between Connections and Performance
We present evidence for the complementarity of connections and performance in four steps. First, we show our baseline estimates. Second, we check whether the connection measure can be interpreted as social connections of provincial leaders with top politicians in Beijing. Third, we discuss whether provincial economic growth can be interpreted as a measure of the provincial leader's performance. Finally, we check the robustness of the baseline estimates to controlling for the interaction of growth performance with various variables potentially correlated with the connection status. We also briefly remark on other sources of connections.
5.1. Baseline Estimates
Table 2 shows our main results from estimating equation (8). The first three columns estimate the correlations of promotion with connections and growth without introducing their interaction term, thus making them directly comparable to the previous studies. Column (1) shows that connected provincial leaders are more likely to be promoted. The difference is estimated at 4.9 percentage points—nearly 60% of the average promotion rate—and statistically significant at the 5% level. This finding confirms anecdotal pieces of evidence mentioned in the Introduction. It is also in line with recent evidence by political scientists (Shih, Adolph, and Liu 2012). In column (2), we find that the promotion probability increases with the provincial economic growth during the tenure, although it is not significantly different from zero. The point estimate suggests that a one standard deviation increase in growth (by 2.4 percentage points) pushes up the probability of promotion by 1.7 percentage points. This magnitude is comparable to the one estimated by Li and Zhou (2005).23 Column (3) includes both the connection indicator and provincial GDP growth as regressors. The results are similar to those in the previous columns, suggesting that the connection status is largely orthogonal to provincial GDP growth once province and year fixed effects are controlled for.
Complementarity between connections and growth
| (Dependent variable: Promoted) | |||||||
|---|---|---|---|---|---|---|---|
| (1) | (2) | (3) | (4) | (5) | (6) | (7) | |
| Connection | 0.049** (0.023) | 0.048** (0.023) | 0.032 (0.023) | 0.011 (0.024) | 0.029 (0.024) | 0.043 (0.027) | |
| Growth | 0.702 (0.465) | 0.690 (0.447) | 0.356 (0.427) | 3.730 (5.865) | 0.210 (0.471) | 0.317 (0.430) | |
| Connection * Growth | 2.195** (0.889) [0.056]* | 2.025*** (0.733) [0.038]** | 1.983** (0.769) [0.058]* | 2.222** (1.004) [0.098]* | |||
| Age | −0.009*** (0.003) | ||||||
| Age * Growth | −0.061 (0.106) | ||||||
| Served in center | 0.026 (0.025) | ||||||
| Served in center * Growth | 0.607 (0.670) | ||||||
| PSC work province | −0.039 (0.034) | ||||||
| PSC work province * Growth | −0.400 (1.237) | ||||||
| Fixed Effects | Y | Y | Y | Y | Y | Y | Y |
| No. of provinces | 31 | 31 | 31 | 31 | 31 | 31 | 31 |
| No. of observations | 966 | 966 | 966 | 966 | 966 | 966 | 966 |
Notes: Standard errors clustered at the province level are reported in parentheses. Reported in brackets are the |$p$|-values for the significance of the coefficient on Connection * Growth by the wild cluster bootstrap-|$t$| (Cameron, Gelbach, and Miller 2008). See Online Appendix Section G.2 for variable definitions. However, the variable Growth is normalized by subtracting the sample mean. All columns control for dummies of the number of years in office (two to twelve), office-by-province fixed effects, and office-by-year fixed effects.
Significant at 10%
significant at 5%
significant at 1%.
Column (4) presents our key finding by including the interaction term of connections and growth as a regressor. The coefficient on the interaction term is positive and statistically significant at the 5% level (or at the 10% level if we use the |$p$|-value of Cameron, Gelbach, and Miller 2008), suggesting that the two determinants of promotion are complements rather than substitutes. The point estimate indicates that a one standard deviation increase in growth raises the promotion probability by 5.3 percentage points more for connected officials than for unconnected ones. The coefficient on the connection indicator suggests that the promotion rate for provincial leaders with the sample average growth is 3.2 percentage points higher for those connected than for those unconnected, although this difference is not statistically significant. The growth effect for unconnected officials is insignificant although the point estimate suggests that a one standard deviation increase in growth increases the probability of promotion by 0.8 percentage points, which is more than 10% of the sample mean promotion rate.
Since unobservable heterogeneity may differ between connected and unconnected provincial leaders, we also estimate equation (8) separately for those connected and unconnected, after dropping the connection indicator and its interaction term with growth from the right-hand side. Online Appendix Table G.2 reports the results. The correlation is clearly larger for connected provincial leaders than for unconnected ones.
Figure 1 shows our main result graphically. We first regress both the promotion dummy and provincial growth since assuming office on dummies of the numbers of years in office, province–office fixed effects, and year–office fixed effects, and obtain the residuals from these regressions. Then, we divide the observations into tertiles according to the residual growth, irrespective of connection status. Finally, for each tertile, we plot the average residual promotion rate by connection status. We also use the bar graph in the background to show the distribution of connected observations across growth tertiles.
The figure shows that the complementary result is entirely driven by a large difference in the promotion rates between connected and unconnected provincial leaders among the top third of growth performers. For unconnected provincial leaders, the worst third performers are slightly less likely to be promoted than the rest. In terms of the distribution of growth performances, connected officials are most likely to be in the middle tertile, but do not disproportionately perform better or worse than their unconnected peers.
Our key finding implies that the previous literature fails to recognize the importance of the interplay between connections and growth in determining the promotion of provincial leaders, and perhaps of Chinese Communist Party officials in general. Connected officials do have a higher likelihood of promotion on average, but this is solely due to their promotion probability being more responsive to performance. Put differently, officials with a better performance appear to be promoted more often, but this relationship mainly applies to those connected to top political leaders of China.
In terms of the theoretical framework introduced in Section 3, our results suggest that either the loyalty or the communication role of connections dominates the learning role, even though we cannot conclude that the learning role of connections is totally absent.
5.2. Discussions of the Connection Measure
To what extent can we interpret our measure of connections as the provincial leaders' true social connection with top politicians in Beijing? In this section, we investigate whether connected provincial leaders differ from unconnected ones in three sets of observable dimensions: individual characteristics, types of assigned provinces, and the support from the central government. We show that, conditional on province and year fixed effects, connected provincial leaders are similar to those unconnected in most observable dimensions.
5.2.1. Individual Characteristics.
Connected provincial leaders may be different from unconnected ones in terms of their individual characteristics. Besides basic demographic variables (age and education), we look at whether provincial leaders have served in the central government before assuming provincial leadership, and whether they rule their native province. Connected provincial leaders may be on the elite career track, which includes positions in the central government and various provinces, while unconnected ones may rule their native province only. We also look at whether they are princelings, the sons or sons-in-law of prominent Communist Party officials. Princelings are known to form a powerful faction within the Communist Party.24 Connections to the PSC members may simply reflect the political advantage of being a princeling.
Table 3 compares the means of observable characteristics of provincial leadership spells between the connected and unconnected, where connection status is measured at the first year of the spell (as changes in connection status during the tenure are due to membership reshuffling of the PSC and thus more likely to be exogenous). Columns (1)–(3) report unconditional mean differences while column (4) reports the estimated coefficient on the connection indicator from regressing each of these variables on the connection indicator, office-by-province fixed effects, and office-by-year (where the year refers to when each leader assumes office, ranging from 1983 to 2009) fixed effects. Panel A reports differences in individual characteristics. While having graduated from college and being a princeling do not differ significantly, connected officials are significantly younger, more likely to have served in the central government, and less likely to be serving the home province. Except for ruling the home province, these differences persist even after taking into account unobservable differences across province and time. In Section 5.4, we check whether our key finding is robust to controlling for the interaction of these variables with growth performance.
Do connected leadership spells differ from unconnected ones?
| (1) Connected | (2) Unconnected | (3)|$t$|-value | (4) Conditional difference | |
|---|---|---|---|---|
| Panel A: Provincial leader characteristics | ||||
| Age | 55.18 (4.25) | 56.54 (3.81) | −2.22** | −3.35***[0.88] |
| College graduate | 0.88 | 0.82 | 1.27 | 0.05 [0.07] |
| Served in center | 0.53 | 0.37 | 2.35** | 0.20*[0.12] |
| Home | 0.10 | 0.25 | −2.43** | −0.06 [0.07] |
| Princeling | 0.06 | 0.04 | 0.50 | 0.00 [0.07] |
| Observations | 50 | 208 | 258 | |
| Panel B: Types of provinces assigned | ||||
|---|---|---|---|---|
| Previous growth | 0.11 (0.02) | 0.11 (0.02) | 1.92* | 0.00 [0.00] |
| PSC work province | 0.50 | 0.13 | 6.12*** | 0.16**[0.08] |
| PSC home province | 0.28 | 0.22 | 0.88 | 0.07 [0.07] |
| Observations | 50 | 208 | 258 | |
| Panel B: Types of provinces assigned | ||||
|---|---|---|---|---|
| Previous growth | 0.11 (0.02) | 0.11 (0.02) | 1.92* | 0.00 [0.00] |
| PSC work province | 0.50 | 0.13 | 6.12*** | 0.16**[0.08] |
| PSC home province | 0.28 | 0.22 | 0.88 | 0.07 [0.07] |
| Observations | 50 | 208 | 258 | |
| Panel C: Central government support to provinces | ||||
|---|---|---|---|---|
| Transfer from center (in million RMB) | 4649.74 (3855.64) 49 | 3133.91 (3280.62) 198 | 2.79*** | 26.53 [507.86] 247 |
| Loan to deposit ratio | 0.72 (0.14) 50 | 0.90 (0.26) 207 | −4.79*** | 0.00 [0.03] 257 |
| Number of new SEZs | 0.14 (0.29) 34 | 0.37(0.62) 185 | −2.14** | −0.05 [0.12] 219 |
Notes: The unit of observations is the leadership spell. Columns (1) and (2) report the mean (and standard deviation for continuous variables) for those spells where the provincial leader is connected and unconnected, respectively, to the PSC in the first year of the spell. Column (3) reports |$t$|-statistics for the null that the means in columns (1) and (2) are the same. Column (4) reports the estimated coefficient on the connection status in the first year of the spell (and robust standard errors in brackets) from a regression of each variable on the connection indicator, office-by-province dummies, and office-by-year dummies. In panel C, the third row in each variable refers to the number of observations. See Online Appendix Section G.2 for variable definitions. To aggregate leader–year level data to the spell level, we take the first-year observation for PSC work province and PSC home province.
Significant at 10%
significant at 5%.
5.2.2. Assignment of Provinces.
Connected officials may be assigned to a particular set of provinces. First, they may systematically rule provinces growing faster or slower than the rest. If the growth performance of a province, either good or bad, indicates its importance for the central government, our connection measure may reflect ruling politically important provinces, rather than actual connections. Growth in such provinces may be more likely to be rewarded with promotion. If connected leaders are systematically assigned to slow-growing provinces, our connection measure simply reflects the difficulty in achieving high growth. The complementarity then arises because growth for such provinces is a stronger signal of the ability of the provincial leader.
To deal with this concern, we measure the provincial growth over the five-year period before each provincial leadership spell begins. Panel B of Table 3 shows that the provinces ruled by connected officials are more likely to have higher previous growth. However, this difference is insignificant once we control for province and time fixed effects.
Another concern is that connected provincial leaders may be assigned to provinces that PSC members have a great deal of knowledge about. If this is the case, growth is a stronger signal of the official's ability, thus explaining the stronger responsiveness of the promotion rate to growth.
To measure this feature, we use two variables: an indicator of provinces where current members of the PSC used to work, and an indicator of provinces where the current members of the PSC were born. Panel B of Table 3 shows that while the PSC home province indicator is not significantly different, connected officials are significantly more likely to rule the province where the PSC members used to work, even conditional on province and time fixed effects. In Section 5.4, we check whether our key finding is robust to controlling for the interaction of this variable with growth performance.
5.2.3. Support from the Central Government.
The third concern on our measure of connections is that it may reflect how much support provincial leaders obtain from the central government due to their connection status to the PSC members. PSC members may help connected provincial leaders achieve high growth so that they can promote them as if the decision were based on meritocracy. To deal with this concern, we consider three dimensions of the central government's support to provinces. First, as an explicit transfer to provinces, we look at fiscal transfers from the center to each provincial government annually since 1994 (China Financial and Economic Publishing House, various years). Second, as an implicit transfer to provinces, we follow Shih (2008) and use the annual data on the loan-to-deposit ratio (National Bureau of Statistics of China 2009) as a measure of credit market intervention by the central government (major banks in China are all state-owned). Third, as a policy measure of support to provinces, for each province we obtain an annual increase in the number of municipalities with the Special Economic Zone (SEZ) status from the municipality-level data complied by Wang (2013).25 For each of these three measures, we focus on the average over each leadership spell.
Panel C of Table 3 reports the difference in these averages between connected and unconnected provincial leaders. An unconditional comparison suggests that connected provincial leaders do obtain significantly more fiscal transfers from the central government, less bank loans, and less SEZ permissions. But, once we take into account province and year fixed effects, this difference is no longer significantly different from zero. These results suggest that the connection indicator does not reflect more support from the central government to boost provincial growth, conditional on differences across provinces and across years.
5.3. Is Growth a Performance Measure?
The provincial GDP growth data may not reflect the performance on basis of which the promotion decision is taken. For example, provincial growth may be higher for those who are promised promotion, because the central government offers support to them to boost economic growth of their province so that their promotion will look merit-based. If so, we should see a significant drop in economic growth in the province after its leader has been promoted. Columns (1) and (2) of Table 4 investigate this issue. With balanced panel data of provinces for 1993–2009, we regress annual real GDP growth on indicators for one, two, and three years after promotion as well as on province and year fixed effects. These indicators are defined based on the promotion of provincial secretaries in column (1) and governors in column (2). The estimated coefficients on these indicators are, however, small and insignificant.
Does provincial economic growth reflect the support from the central government?
| (Dependent variable: Annual real provincial GDP growth) | ||||||
|---|---|---|---|---|---|---|
| (1) Secretaries | (2) Governors | (3) Secretaries | (4) Secretaries | (5) Governors | (6) Governors | |
| 1 year after promotion | 0.006 (0.004) | 0.001 (0.004) | ||||
| 2 years after promotion | 0.003 (0.005) | 0.000 (0.004) | ||||
| 3 years after promotion | −0.003 (0.006) | −0.004 (0.003) | ||||
| Connected | −0.005 (0.005) | −0.004 (0.006) | −0.009 (0.005) | 0.002 (0.006) | ||
| Years of working together * Connected | 0.001 (0.001) | 0.003** (0.001) | ||||
| Age difference * Connected | 0.000 (0.001) | 0.000 (0.001) | ||||
| Province fixed effects | Y | Y | Y | Y | Y | Y |
| Year fixed effects | Y | Y | Y | Y | Y | Y |
| No. of provinces | 31 | 31 | 31 | 31 | 31 | 31 |
| No. of observations | 488 | 478 | 488 | 488 | 478 | 478 |
Notes: Standard errors clustered at the province level are reported in parentheses. The unit of observations is the province-by-year. The variable |$x$|year after promotion is a dummy for |$x$| years after the previous leader in the same province has been promoted. Connected is the indicator of the provincial leader having worked together in the past with any of the current members of the Politburo Standing Committee. Years of working together is the (average, if more than one connection) number of years that the provincial leader has worked together with the current member(s) of the Politburo Standing Committee. Age difference is the (maximum, if more than one connection) difference in age between the provincial leader and his connected member(s) of the Politburo Standing Committee, where the positive value indicates that provincial leaders are younger. In columns (1), (3) and (4), the provincial leaders to define these variables are provincial secretaries; in columns (2), (5), and (6), provincial governors. All columns control for province fixed effects and year fixed effects.
Significant at 5%.
Columns (3) and (5) measure the strength of connections by the number of years working together. While this interaction term is insignificant for provincial secretaries, growth is significantly higher for provincial governors whose connection is stronger by this measure. Plotting the data reveals one outlier (Fujian in 1993) where the governor has worked with a PSC member for 14 years (the maximum in the sample) and the provincial economy grew by 22.6%, almost twice the sample mean. If we drop this observation, the interaction term in column (5) becomes insignificant. Our main results in Table 2 are also immune to this outlier.28
Columns (4) and (6) use the age difference variable (which is positive if the provincial leader is younger than his connected PSC members) as a measure of the strength of connections. Its interaction term with the connection indicator is insignificant both for provincial secretaries and governors.29
These results suggest that provincial growth is not higher for those provincial leaders whose connections may be stronger in terms of observable dimensions, encouraging the interpretation of growth as a performance measure, rather than a measure of the strength of connections.
5.4. Robustness Checks
Sections 5.2 and 5.3 have shown that our connection measure and growth indeed reflect the provincial leaders' social connection with top politicians in Beijing and their performance. However, if unobservable promotion determinants change with growth performance in a different way by the connection status, the estimated coefficient on the interaction term of connections and growth in column (4) of Table 2 may be biased. We therefore check the robustness of our key finding to controlling for various variables and their interaction with growth performance.
5.4.1. Individual and Province Characteristics.
In columns (5)–(7) of Table 2, we estimate the full specification of equation (8) where the control variable vector, |$\boldsymbol {x}_{iopt}$|, includes the age when assuming office, the indicator of having served in the central government, and the PSC's former workplace province indicator, respectively. Remember that we show in Table 3 that these three variables significantly differ between connected and unconnected provincial leaders. In all these three columns, the estimated coefficients on the connection indicator and its interaction term with growth change little from the estimates in column (4).
In Online Appendix Section E, we also control for other characteristics of provincial leaders and of their assigned provinces as well as their interaction term with growth. The estimated complementarity of connections and growth, reported in Online Appendix Table G.4, is remarkably stable across all these different specifications.
These results suggest that our finding of the complementarity of connections and performance is not caused by differential changes of unobservable determinants of promotion over different performance levels by connection status.
5.4.2. Being the Political Elite.
Another concern to our key finding is that connections may simply reflect being a member of China's political elite. A certain set of workplaces may be the home of every top leader in China. As a result, those destined for promotion have worked with the current top leaders in the PSC, and this has nothing to do with social connections between PSC members and provincial leaders.
Table 5 checks this possibility. In column (1), we use as |$\boldsymbol {x}_{iopt}$| in equation (8) a measure of connection between provincial leaders and past or future PSC members rather than current members. In column (2), we instead employ an indicator for provincial leaders who used to work in the same place as current PSC members but in a different period. They should thus pick up the effect of the elite status, but not of connections. In column (3), we also look at the impact of being connected to current members of the Politburo, the second highest decision-making body in the Communist Party. These dummies are set to 0 if our main connection indicator is 1.
Connections or being part of the political elite?
| (Dependent variable: Promoted) | |||
|---|---|---|---|
| (1) | (2) | (3) | |
| Connection | 0.033 (0.028) | 0.042* (0.023) | 0.037(0.027) |
| Growth | 0.414 (0.483) | 0.206 (0.521) | 0.395 (0.479) |
| Connection * Growth | 2.125** (0.938) [0.090]* | 2.376** (0.908) [0.042]** | 2.157** (0.903) [0.058]* |
| Future/past connection | 0.005 (0.027) | ||
| Future/past connection * Growth | −0.265 (1.059) | ||
| Workplace | 0.023 (0.028) | ||
| Workplace * Growth | 0.406 (0.736) | ||
| Politburo connection | 0.013 (0.019) | ||
| Politburo connection * Growth | −0.234 (0.653) | ||
| |$F$|-test | 3.27 [0.052]* | 2.53 [0.096]* | 3.96 [0.030]** |
| Fixed effects | Y | Y | Y |
| No. of provinces | 31 | 31 | 31 |
| No. of observations | 966 | 966 | 966 |
Notes: Standard errors clustered at the province level are reported in parentheses. Reported in brackets are the |$p$|-values for the significance of the coefficient on Connection * Growth by wild cluster bootstrap-|$t$| (Cameron, Gelbach, and Miller 2008). See Online Appendix Section G.2 for variable definitions. However, the variable Growth is normalized by subtracting the sample mean. All columns control for dummies of the number of years in office (two to twelve), office-by-province fixed effects, and office-by-year fixed effects. |$F$|-test reports |$F$|-statistics and their associated |$p$|-values for the null that the coefficients on Connection and on Future/Past Connection in column (1), Workplace in column (2), or Politburo Connection in column (3), are the same and that the coefficients on their respective interaction terms with Growth are also the same.
Significant at 10%
significant at 5%.
Table 5 shows that the coefficients on these additional regressors are not significantly different from 0. The |$F$|-test rejects the null that the effect of being connected to the current members of the PSC is the same as that of being connected to the past or future members of the PSC (column (1)) or of working in the same place as current PSC members in a different period (column (2)) or of connecting to the Politburo (column (3)).
All these results in Table 5 imply that connections to the people with decision-making power count the most. Consequently, the estimated correlation of connections with promotion is driven by whether the provincial leader's connections are members of the PSC, which is plausibly beyond each provincial leader's control.
5.5. Other Connection Sources
In Online Appendix Section E.1, we also investigate whether other sources of social connections are of importance for promotion. We do not find any significant effects of connections from sharing the college to graduate or the province of birth. Sharing working experience seems to be of greater importance than sharing the same birthplace or knowing each other via the college alumni network. Another interpretation of these results is that our measures of school and birth place connections are coarser than those based on shared working experience.
6. Evidence for the Loyalty Role of Connections
In light of our theoretical framework in Section 3, the empirical evidence presented in the previous section suggests that the loyalty and/or communication roles of connections dominate the learning role. Ideally we would like to quantify the relative importance of the loyalty and communication roles. Since this is not feasible with the data at hand, our aim in this section is to evaluate which role is likely to be dominant. To accomplish this, we investigate heterogeneity in the degree of complementarity along two dimensions: (i) the age difference between the provincial leader and his connected PSC member and (ii) the length of tenure of provincial leaders. Also, we briefly discuss a few other possible dimensions of the heterogeneity in the degree of complementarity, which provides further evidence for our main findings.
6.1. Age Difference
Since the 1990s, the Communist Party of China has undergone generational changes of leadership every ten years. Older party officials tend to have more power than junior ones while officials in similar ages compete with each other for high office. Thus, it is plausible that provincial leaders show more loyalty towards connected PSC members whose age is higher than their own. On the other hand, the communication role of connections is less likely to differ by the age difference. Consequently, if the complementarity between connections and performance in the promotion process is due to the loyalty role of connections, we expect a stronger complementarity for the connected pairs in which provincial leaders are younger than the PSC members.
As in Section 5.3, we obtain the age difference between provincial leaders and their connected PSC members by subtracting the age of the provincial leader from that of the PSC member.30 In our sample, provincial leaders are on average 7.1 years younger than their connected PSC members, with a standard deviation of 5.8 years. We include the interactions of this variable with the connection indicator and with the connection–growth interaction term as two additional regressors to equation (8). If the age difference makes the complementarity of connections and growth stronger, the coefficient on its interaction with the connection–growth interaction term will be positive.
Column (1) in Table 6 reports the results from this estimation. It shows that the complementarity between connections and performance are indeed stronger for pairs where provincial leaders are younger than their connected PSC members. According to the estimated coefficients, a one standard deviation increase in growth performance raises the promotion probability by 5.03 percentage points more than unconnected provincial leaders for the connected provincial leader with the average age difference (7.1 years). This number goes up to 8.51 percentage points if the age difference increases by one standard deviation (5.8 years).31
Heterogeneity in complementarity of connections and performance
| (Dependent variable: Promoted) | ||
|---|---|---|
| (1) | (2) | |
| Connection | −0.004 (0.026) | 0.000 (0.037) |
| Connection * Age difference | 0.005* (0.003) | |
| Connection * Tenure | 0.008 (0.011) | |
| Growth | 0.295 (0.446) | 0.031 (0.668) |
| Growth * Tenure | 0.144 (0.188) | |
| Connection * Growth | 0.310 (0.992) | −0.633 (1.524) |
| Connection * Growth * Age difference | 0.247** (0.102) [0.042]** | |
| Connection * Growth * Tenure | 1.314 (0.798) [0.122] | |
| Fixed effects | Y | Y |
| No. of provinces | 31 | 31 |
| No. of observations | 966 | 966 |
Notes: Standard errors clustered at the province level are reported in parentheses. Reported in brackets are the |$p$|-values for the significance of the coefficient by wild cluster bootstrap-|$t$| (Cameron, Gelbach, and Miller 2008). Age difference is the (maximum, if more than one connection) difference in age between the provincial leader and his connected member(s) of the Politburo Standing Committee, where the positive value indicates that provincial leaders are younger. Tenure is the number of years in office with nine years or longer being coded as eight years. See Online Appendix Section G.2 for other variable definitions. However, the variable Growth is normalized by subtracting the sample mean. All columns control for dummies of the number of years in office (two to twelve), office-by-province fixed effects, and office-by-year fixed effects.
Significant at 10%
significant at 5%.
Since the age difference with a connected PSC member cannot be defined for unconnected provincial leaders, we do not control for the interaction term of growth and age difference. Consequently, the result in column (1) of Table 6 may be driven by unobserved characteristics of the provincial leader that are correlated with the difference of their age from the PSC member's. Among such omitted variables, one important factor is how close the provincial leader's age is to the official retirement age of 65 years. It is commonly believed that promotion becomes more unlikely when provincial leaders approach the retirement age (e.g., Li and Zhou 2002, Persson and Zhuravskaya 2012, Li 2012). To the extent that PSC members are all similar in age, our age difference measure reflects the provincial leader's own age. The stronger complementarity for those who are younger than PSC members may be driven by a lower promotion chance of those near the age of 65.
However, the age of the connected PSC member varies widely from 53 to 76 (see Online Appendix Figure G.3 for the histogram). The age difference is therefore not necessarily perfectly correlated with the provincial leader's own age. In Online Appendix Section F, we also check the robustness of the result in column (1) of Table 6 to controlling for four different indicators of approaching the retirement age and its interaction with connection, growth, and the connection–growth interaction term. The coefficient on the triple interaction term of connection, growth, and age difference remains comparable in size across specifications, suggesting that the stronger complementarity for larger age difference is not driven by the retirement age effect.
These results are consistent with the hypothesis that the complementarity between connections and performance is due to the loyalty role of connections.
6.2. Tenure
In this section, we provide additional evidence for the presence of the loyalty role of connections by showing that the communication channel alone cannot explain the empirical pattern we observe. More specifically, our estimate on changes in the degree of complementarity over the leadership spell can only be reconciled by the existence of a loyalty role of connections.
In Online Appendix Section G, we extend the theoretical framework in Section 3 to a case where the economic growth rate of |$i$|'s province is observed annually during |$i$|'s rule. We show that, as long as growth is as much informative about |$i$|'s true ability as the prior mean ability, the degree of complementarity decreases with each provincial leader's tenure if the complementarity of connections and performance is solely driven by the communication role of connections.32 Provincial economic growth becomes a more accurate signal of the true ability of provincial leaders when it is observed over more years. Thus, a longer tenure diminishes the communication advantage of connections between the PSC and the provincial leader.33
We test this prediction empirically. As Figure 2 shows, we do not observe any promotion after the ninth year in office. Therefore, we censor tenure by converting the ninth year or later into the eighth year. We then interact this variable with growth, the connection indicator, and their interaction term. Note that the dummies for the number of years in office have always been controlled for.
Column (2) in Table 6 reports the results from this estimation. While being insignificant, the point estimate of the interaction term of connections, growth, and tenure is positive. This means that the complementarity between connections and performance are, if anything, stronger for those provincial leaders who have been in office for a longer period. This evidence contradicts with the theoretical prediction if the communication role of connections is the only mechanism for complementarity.
Taken together, among different roles of connections, the loyalty role appears most consistent with the patterns in the data. While we do not deny possible existence of the communication or the learning channel of connections, our results suggest that the two informational channels are dominated by the loyalty channel in the context of promotion of Chinese provincial leaders.
6.3. Heterogeneous Impacts of Connections by Other Dimensions
Online Appendix Table G.7 investigates whether the degree of the complementarity of connections and performance differs by other dimensions of heterogeneity across connected provincial leaders. We examine the heterogeneous impacts by (i) the number of connections, (ii) the number of years working together, (iii) before and after 2002, the year in which Hu Jintao succeeded Jiang Zemin as General Secretary, and (iv) the source of variation in the connection–growth interaction term (switches in the connection status or changes in growth performance).
These results are discussed in detail in Section G.1 in the Online Appendix. Limited by sample size, the standard errors on the triple effects are often too large to be conclusive. However, the only significant triple effect also sheds light on the role of connections. As shown in column (2), having worked with a PSC member longer by one standard deviation (2.5 years), the promotion probability goes up further by 2.1 percentage points if this connected provincial leader improves his performance by one standard deviation (2.4 percentage points). This result further suggests that either the loyalty or communication role of connections dominates the learning role.
7. Performance after the Promotion Decision is Made
In this section, we look at the performance of provincial leaders after promotion decisions are made. The purpose of this analysis is two-fold. First, we investigate whether provincial GDP growth reflects the ability of provincial leaders as we assume throughout the paper. Second, we shed some light on whether the promotion pattern we observe is inefficient in the sense that, conditional on high performance, those connected provincial leaders are actually less able (but more likely to be promoted as we have shown) than unconnected ones.
While we do not have any good measure of the performance of Chinese politicians once they leave the provincial leadership positions, we can look at provincial leaders with more than one spell: (1) secretaries and governors who get transferred to other provinces without promotion, (2) governors who are promoted and become secretaries of the same or a different province, and (3) secretaries who are promoted by joining the Politburo without leaving the provincial secretary office (see footnote 15). We observe the performance of these leaders after their promotion or nonpromotional transfer. Again, it is measured by the real GDP growth of the new province in which they assume leadership.
In equation (9), the extent to which the first-term performance is correlated with the second-term performance is measured by |$\xi$| for unconnected officials and by |$\xi + \psi$| for connected officials. If they are positive, it indicates that provincial GDP growth reflects the ability of provincial leaders, at least to some extent.
If |$\varphi \le 0$| and |$\psi \lt 0$|, connected officials with more than the average performance during the first term perform worse than unconnected ones with a similar first-term performance, indicating that the promotion pattern that we observe is inefficient. If |$\varphi \ge 0$| and |$\psi \ge 0$|, connected officials perform equally or better than unconnected ones if their first-term performance is more than the average, suggesting that promoting connected officials rather than unconnected ones among best performers may not severely distort the allocation of talent.
In our data, 58 officials serve more than one term of provincial leadership between 1993 and 2009, 13 of which serve three terms. In terms of leader–years, these officials account for 453 observations with a promotion probability of 12.4%. This number is higher than that in the main sample (7%) because part of the sample selection criteria requires the promotion from governors to secretaries and from secretaries to Politburo-member secretaries.
Aside from the promotion rate, however, this subset of provincial leaders does not substantially differ from the whole sample. In terms of performance and connections, this subsample is more or less comparable to the main sample: the average growth measured as the deviation from the whole sample average is 0.005 percentage points, and 18.1% of the leader–years are connected (where it is 21% in the whole sample). Column (1) of Table 7 replicates our main result by restricting the sample to the leader–years served by these 58 officials. With this subsample, connected officials are significantly more likely to be promoted than those who are unconnected if their growth performance is average. For unconnected officials, higher growth reduces the promotion probability although this negative correlation is not significant. However, the complementarity between connection and growth does apply to this subset of provincial leaders.
Performance after the promotion decision is made
| Dependent variable: | (1) Promoted | (2) Second-term Growth |
|---|---|---|
| Connection | 0.081 ** (0.035) | 0.004 (0.004) |
| Growth | −0.309 (1.007) | 0.162* (0.094) |
| Connection * Growth | 2.568* (1.352) [0.116] | 0.167 (0.121) |
| Observations | 453 | 71 |
| Dependent variable: | (1) Promoted | (2) Second-term Growth |
|---|---|---|
| Connection | 0.081 ** (0.035) | 0.004 (0.004) |
| Growth | −0.309 (1.007) | 0.162* (0.094) |
| Connection * Growth | 2.568* (1.352) [0.116] | 0.167 (0.121) |
| Observations | 453 | 71 |
Notes: In column (1), the unit of observations is the leader–year. The sample is restricted to those who assume provincial leadership positions more than once. The definition of variables is the same as in column (4) of Table 2. Standard errors clustered at the province level are reported in parentheses. Reported in brackets is the |$p$|-value for the significance of the coefficient on Connection * Growth by wild cluster bootstrap-|$t$| (Cameron, Gelbach, and Miller 2008). Dummies of the number of years in office (two to twelve), office-by-province fixed effects, and office-by-year fixed effects are controlled for. In column (2), the leadership spell is the unit of observation. The sample is restricted to those who serve the second or third term of provincial leadership. The dependent variable is average annual growth during the tenure conditional on province and year fixed effects in a balanced province panel regression. Connection is an indicator of being connected in the last year of the previous term. Growth is the deviation of average conditional annual growth during the previous term from the sample average. No other variables are included as regressors. Robust standard errors are reported in parentheses.
Significant at 10%
significant at 5%.
Column (2) of Table 7 reports the result of estimating equation (9). Since first-term growth is demeaned, the coefficient on the connection indicator tells us the difference in the second-term conditional growth between those connected and unconnected whose first-term growth is average, and it is not significantly different from zero. The higher the first-term growth, the higher is the second-term growth, with the coefficient being significant at the 10% level. The coefficient on the connection–growth interaction term is positive but not significantly different from zero.
The second-term growth might not reflect the ability. For example, it might be the case that good performers during the first term are rewarded by being assigned to a province that has been growing fast and therefore is easy to rule. For the 35 leadership spells that are followed by the transfer to another province, we check this possibility by estimating equation (9) with the dependent variable replaced with the average conditional growth of the second-term province during the period before the transfer. The result (not reported) shows that officials with higher first-term performance tend to be transferred to slower-growing provinces, with this relationship stronger for those connected.
Although not conclusive, these results suggest that promoting connected officials with high performance instead of unconnected ones with similarly high performance is not very inefficient in terms of the allocation of talent in the Chinese government. In addition, echoing the finding that provincial leader fixed effects matter for growth (see Online Appendix Section B), the positive correlation of provincial economic growth between the first and second terms suggests that the ability of provincial leaders does appear to affect the economic performance of the province they rule.
8. Conclusions
Our empirical analysis shows a robustly stronger positive correlation of the province's economic growth and its ruler's promotion chance for those connected to top politicians in the central government of China than for those not connected. Although other mechanisms may explain this empirical pattern, we propose, and provide evidence consistent with, one plausible explanation: connections foster loyalty of junior officials to senior ones, allowing the incumbent top politicians to promote the most able ones among those connected.
Political selection in autocracy often involves a trade-off between competence and loyalty (Egorov and Sonin 2011). Appointing competent officials to high office threatens the power of an autocrat. As a result, incompetent but loyal subordinates tend to surround the autocrat, which is one contributing factor to a poor quality of government in autocracy.
Our evidence might suggest how China has avoided this trap. A system of job rotation and promotion within the Communist Party helps pairs of officials build trust by working together. Within a pool of officials with such connections, top officials are then able to pick the most talented without being threatened. In this view, what we may call patronage or nepotism does not necessarily result in an inefficient allocation of talent.
Acknowledgments
The previous version of this paper was circulated under the title “Complementary Roles of Connections and Performance in Political Selection in China”. For helpful comments and suggestions, we thank the editors, anonymous referees, Philippe Aghion, Tim Besley, Loren Brandt, Antonio Ciccone, Tom Cunningham, Claudio Ferraz, Lucie Gadenne, Nicola Gennaioli, Maitreesh Ghatak, Henrik Kleven, Anna Larsson Seim, Shi Li, Rocco Macchiavello, Rob McMillan, Stelios Michalopoulos, Dirk Niepelt, Elena Nikolova, Peter Nilsson, Gerard Padro-i-Miquel, Mårten Palme, Albert Park, Torsten Persson, Per Pettersson-Lidbom, Gerard Roland, David Strömberg, Dan Tortorice, Shing-Yi Wang, Peter Zeitz, Li-An Zhou, Fabrizio Zilibotti, and seminar/workshop participants at the CEPR/BREAD/AMID Conference on Development Economics in 2011, Barcelona Development Economics Workshop in 2012, China Meeting of the Econometric Society 2013, ICSID 2014 Conference in St Petersburg, Tartu, Gothenburg, Zurich, EBRD, Pennsylvania, Edinburgh, Strathclyde, Singapore Management University, National Graduate Institute of Policy Studies, Osaka, and Hong Kong University of Science and Technology, IIES Stockholm, and Shandong University. We also thank Jin Wang for sharing the data, Erik Prawitz for research assistance, and Christina Lönnblad for editorial assistance. Financial support from ERC grant 249580 (Kudamatsu) and Jan Wallander and Tom Hedelius Foundation (Jia and Seim) is gratefully acknowledged.
References
Most studies in the literature on political selection focus on democracy. Exceptions include Acemoglu, Egorov, and Sonin (2010), Besley and Reynal-Querol (2011), Egorov and Sonin (2011), Garcia-Jimeno and Robinson (2010), and Francois, Rainer, and Trebbi (2012).
Jiang Zemin, General Secretary from 1989 to 2002, is well known for having promoted his former colleagues when he was the leader of Shanghai (those promoted are thus known as the Shanghai clique). Hu Jintao, who succeeded Jiang in 2002, is also widely known for having promoted his former colleagues while being the leader of the Communist Youth League, a youth organization of the Chinese Communist Party (such promoted officials are known as tuanpai).
For example, in the lead-up of the 18th National Congress of the Communist Party held in November 2012, where many promotion decisions would be made, the New York Times published articles emphasizing both aspects. See, for instance, Zhang (2012) for the meritocracy view and Wong (2012) for the patronage view.
In Online Appendix Section D, we also present a model of promotion where promotion acts as an incentive scheme for provincial leaders to boost economic growth.
We also measure connections based on education and birth place, but these measures do not have any significant correlations with promotion. See Section 5.5.
Exploiting exogenous variations in provincial economic growth does not help us answer the question of whether performance affects promotion. An exogenous shock to economic growth is, by definition, beyond the control of provincial leaders, and its effect on promotion may reflect whether top leaders in China are mistaking such shocks for strong performance, a question that is of less importance. In other contexts such as CEO pay, exploiting exogenous shocks in performance can be an effective empirical strategy. See Bertrand and Mullainathan (2001), for example.
In the context of China, Shih (2008) investigates the impact of connections (measured in a similar way to ours) on the loan-to-deposit ratio of each province, interpreted as the support from the central government. Persson and Zhuravskaya (2012) find that provincial leaders who rule their native province invest less in infrastructure and spend more on education and health than those not born in the province they rule. Different from these studies, we focus on the interplay of connections and performance as determinants of political selection.
Xu (2011) refers to this institutional feature as a regionally decentralized authoritarian system. Although it is interesting to study the coordination and competition between secretaries and governors, we leave this to future research.
As discussed in what follows, allowing connections to affect the mean ability does not change the nature of the interaction between connections and performance in determining the promotion probability.
As shown in Online Appendix Section C, the functional form for |$F(\bar u)$| does not affect our main theoretical result, Proposition 1, as long as the observed growth rate, |$g_i$|, does not take extreme values and |$p(1)/p(0)$| sufficiently differs from |$h(0)/h(1)$| (see what follows for the definition of |$h(C_i)$|).
In the unlikely case in which the loyalty role of connections exactly cancels the informational roles of connections to satisfy |$p(1)h(1) = p(0)h(0)$|, the interdependency of connections and growth disappears (case 1(b) in the Proposition).
Egorov and Sonin (2011) argue that the tradeoff between loyalty and ability creates a dilemma for the dictator when choosing high officials. See also Besley et al. (2012) in the context of the choice of electoral lists by political party leaders in Sweden.
For general distribution functions of |${\bar u}$|, the result is robust as long as |$p(1)/p(0)$| is sufficiently larger or smaller than |$h(0)/h(1)$| and |$g_i$| does not take extreme values. See Online Appendix Section C.
We start from 1993 because China Vitae (2012) does not cover officials in office in June 1992 or before. Our sample period ends in 2009 as annual growth data are available up to 2009 when the first draft of this paper was written. We look at June because, following Li and Zhou (2002), we measure the promotion outcome during the period between July of year |$t$| and June of year |$t + 1$|, which is to be matched with economic growth in year |$t$|. Finally, we drop provincial leaders whose tenure is less than twelve months because the promotion of such leaders is unlikely to be associated with annual provincial growth.
Some provincial secretaries join the Politburo without leaving office. If this happens, we record this as their promotion and treat the rest of the leadership spell as a separate one. There are three such cases. When a provincial secretary with the Politburo membership leaves office, joining the PSC is defined as promotion.
In Section 5.4, we also consider links between each provincial leader and any current non-Standing-Committee members of the Politburo.
We also find that the difference in position ranks for connected pairs (each position of the Party and the government has an official rank) is usually no more than two when they worked together. To make our coding procedure tractable, we disregard the periods of working at a local government below the provincial level from each official's curriculum vitae. Consequently, an official working for a prefectural or county government is not regarded as connected to another working for a provincial government in which the prefecture or county is located.
We thank Li-An Zhou for providing us with this information.
We corroborate the quality of the provincial growth data by checking whether it reflects the growth in night-time lights observed by satellites. Night-time lights can be seen as an objective measure of living standards, and therefore its correlation with GDP is indicative of the quality of GDP data. Using data on night-time lights from National Geophysical Data Center (2010) and on Chinese provincial boundaries from Natural Earth (2012), we follow Henderson, Storeygard, and Weil (2012) in measuring and aggregating night-time lights to the provincial level. The correlation coefficient (conditional on province and year fixed effects) between annual GDP growth and annual light growth is about 0.1, significantly different from zero at the 5% level. This evidence suggests that real GDP growth, at least to some extent, reflects improvements in some dimensions of living standards captured by night-time lights.
Online Appendix Section E, shows that the logit and probit estimation yields a similar result.
See footnote 14 for why we measure promotion during the period from July.
To explicitly incorporate the possibility of relative performance evaluation, we also estimate equation (8) with |$G_{iopt} - \bar G_{ot}$| (the deviation from each year's mean by office) replacing |$G_{iopt} - \bar G$|. As reported in Online Appendix Table G.1, the result is very similar.
The result of Li and Zhou (2005) suggests that a one standard deviation increase in growth raises the promotion probability by 1.8 percentage points.
The data on princelings come from China Vitae (2012). Xi Jinping, General Secretary since 2012, is a princeling. The media often reported factional struggles between princelings and the former members of the Communist Youth League headed by the outgoing General Secretary Hu Jintao in the lead-up to the 2012 Party Congress.
The SEZ is an area with more liberal laws and economic policies to encourage foreign direct investment for export. It is the central government that authorizes local governments to establish SEZs.
If the provincial leader has more than one connection, we take the average. The results do not substantially change if we take the maximum or the minimum.
It might also be the case that the connections are stronger if the connected pair of individuals is more similar in age. To reflect this possibility, we also measure the age difference in absolute value. The results are similar.
The coefficient on the interaction of connection and growth for column (4) of Table 2 is reduced by one-fifth in size, but it remains significant at the 5% level.
Since the age difference is correlated with the provincial leader's own age, we also run regressions where we control for the age and its interaction with the connection indicator. The coefficients on the age difference interacted with the connection indicator remain insignificant.
If there are two connected PSC members, we take the maximum.
The coefficient on the connection–growth interaction in column (1) of Table 6 measures the complementarity for the connected provincial leader whose age difference is zero, which rarely occurs in the data.
More specifically, as long as |$\sigma_\varepsilon (0)\sigma_\varepsilon (1)$| is not too large relative to |$\sigma_a (0)\sigma_a (1)$|, the difference in equation (5) between |$C_i = 1$| and |$C_i = 0$| decreases with the provincial leader |$i$|'s tenure if |$p(1) = p(0)$| and |$h(1) \gt h(0)$|.
This prediction depends on how many years the PSC members can observe |$g_i$|, not |$\varepsilon_i$|. The provincial GDP growth is observable for all the past years from statistical yearbooks. Therefore, even if the current PSC members assume power some years after a provincial leader assumed office, it is the total number of years a provincial leader has been in office that weakens the complementarity due to the communication role of connections.
Supporting Information
Additional Supporting Information may be found in the online version of this article at the publisher's website:
Author notes
The editor in charge of this paper was Fabrizio Zilibotti.
