


Abstract
Mitochondrial diseases have a wide spectrum of clinical presentations. Heteroplasmy, the presence of wild type and mutated mitochondrial deoxyribonucleic acid (DNA) in a single cell, is typical of mitochondrial disorders. It can show varying levels between cells of the same tissue, between organs in a single individual as well as between members of the same family. We describe below a woman who presented to us for management of pancreatic diabetes. Her daughter had a history of recurrent bouts of myopathy; evaluation was suggestive of having a mitochondrial etiology. Subsequently, mitochondrial genetic testing revealed positivity for m.3243A>G variant with a heteroplasmy of 45% in the blood in the daughter and 15% in the proband. We highlight how differences in the heteroplasmy and threshold levels among members of the same family resulted in a variable spectrum of clinical disease. Family screening of members identified with mitochondrial disease is of utmost significance to ensure early diagnosis and therapy.
Introduction
Mitochondria are membrane bound cell organelles with innumerable functions involving cellular and metabolic pathways. Energy production via oxidative phosphorylation represents their primary role [1]. Mitochondria are present in all nucleated cell types; therefore, dysfunction may lead to multiple organ system involvement.
Mitochondria are distinctive in possessing their own set of deoxyribonucleic acid (mtDNA) with multiple copies of mtDNA in each cell. Homoplasmy is present when all components of mtDNA are identical; the opposite is termed heteroplasmy. The level of heteroplasmy may vary between cells in the same tissue or organ, between organs within the same person, as well as between individuals in the same family [2].
Mitochondrial disease represents a common group of inherited metabolic illness, affecting 1 in 5000 individuals worldwide [3]. Diabetes mellitus is the most common endocrinopathy reported among those with mitochondrial disease [4]. We describe a female patient who was on follow-up for pancreatic diabetes and was subsequently diagnosed to have a mitochondrial etiology after her daughter presented with myopathy.
Case Presentation
A 42-year-old woman presented with a 4-year history of diabetes mellitus and chronic calcific pancreatitis. She had a history of recurrent bouts of abdominal pain between the ages of 20 and 35 years. Her mother had hearing loss at the age of 19, diabetes mellitus at 35 years, and died at the age of 60 years (cause unclear). The proband's brother was diagnosed with diabetes mellitus at 27 years, and he developed ischemic heart disease and chronic kidney disease. He expired in the fourth decade of life from a sudden cardiac event (Fig. 1). Our proband had a body mass index of 20 kg/m2 with an otherwise unremarkable systemic examination. She did not have any features suggestive of microvascular or macrovascular complications of diabetes mellitus. Her anti-glutamic acid decarboxylase (GAD) antibody and anti-islet antigen 2 (IA2) antibody were checked and were negative. Her fasting C-peptide was 0.26 ng/mL. Computerized tomography of the abdomen revealed intra-ductal calcification of the pancreas (Fig. 2A and 2B). She was initiated on pancreatic enzyme supplements in view of exocrine insufficiency and her blood glucose levels were controlled using insulin.
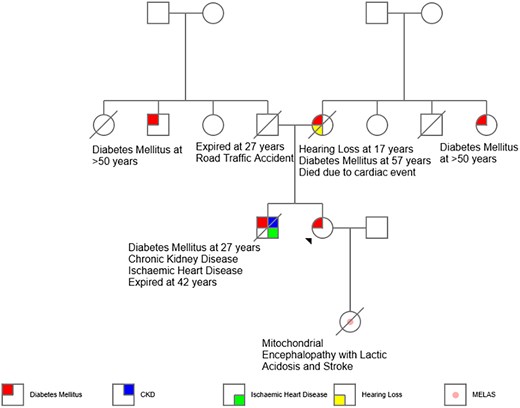
Pedigree chart of the proband.
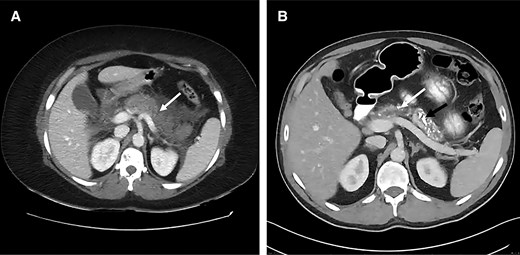
A, Computed tomography of the abdomen depicting necrotizing pancreatitis during an episode of acute abdominal pain in the proband (mother). B, Follow-up imaging shows dilated pancreatic duct (white arrow), multiple intraductal calculi, and parenchymal calcification (black arrow) with marked atrophy of the gland.
In view of persistent abdominal pain, pancreatic duct stenting was attempted. Subsequently, she underwent Frey's procedure and frequency of pain reduced thereafter. She had only a few acute exacerbations over the next 5 years and has been relatively pain-free the last 8 years.
Her 13-year-old daughter, her only child, born of a nonconsanguineous marriage, developed episodes of muscle pain in the lower limbs over 2 years. Initially these were associated with episodes of febrile illness and thought to be viral myositis. However, her symptoms progressed over 2 years with inability to rise from squatting and climb stairs. She was born at term by vaginal delivery with a birth weight of 3.2 kg. Her neonatal period was uneventful. Her developmental milestones, linear growth, and puberty were appropriate for age and she was fully independent in her activities of daily living. She was diagnosed with subclinical hypothyroidism and initiated treatment at 12 years of age.
Diagnostic Assessment
On examination, the daughter had induration of the calf muscles with warmth and tenderness. Reduced power (4 minus) at the hip and shoulder with normal deep tendon reflexes and flexor plantar reflexes were present. Biochemical evaluation has been depicted in Table 1. She had elevated serum creatine phosphokinase levels with negative urinary myoglobin. Needle electromyography was suggestive of a myopathic process. She was noted to have persistently elevated lactate levels with acidosis (pH 7.306; normal range, 7.35-7.45). Her vasculitic work up was negative. Her serum alanine levels were elevated (863 µM) and suggestive of a probable mitochondrial etiology. Histopathology of the left gastrocnemius revealed ragged red fibers and absence of cytochrome oxidase activity in several fibers (Figs. 3 and 4).
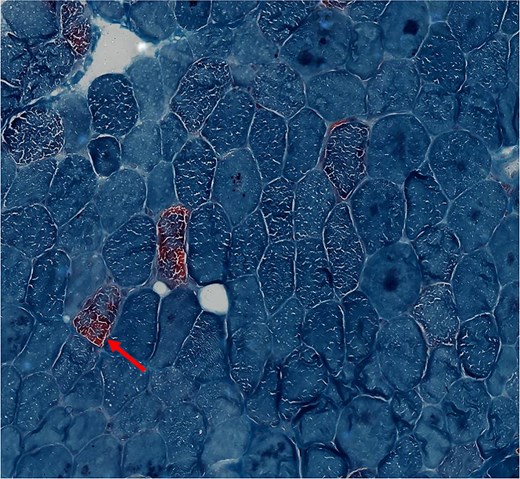
Cross sections of skeletal muscle with scattered ragged red fibers in the proband's daughter (modified gomori trichrome stain ×400).
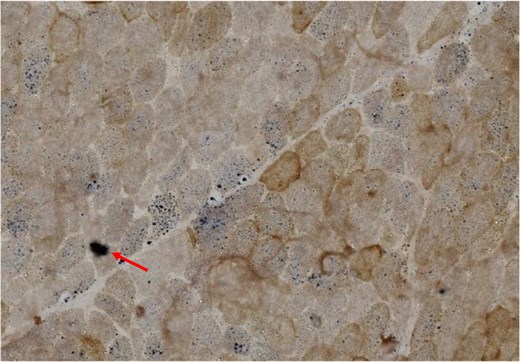
Cross sections of skeletal muscle from the proband's daughter. It demonstrates several scattered cytochrome oxidase–deficient fibers that are highlighted by succinic dehydrogenase (COX-SDH ×400).
Biochemical profile of proband and her daughter
| Parameter | Proband | Proband’s daughter | Reference range |
|---|---|---|---|
| Hemoglobin | 12.8 g/dL (128 g/L) | 13.8 g/dL (138 g/L) | 11-15 g/dL (110-150 g/L) |
| Serum sodium | 140 mEq/L (140 mmol/L) | 142 mEq/L (142 mmol/L) | 135-145 mEq/L (135-145 mmol/L) |
| Serum potassium | 3.9 mEq/L (3.9 mmol/L) | 5.4 mEq/L (5.4 mmol/L) | 3.5-5.0 mEq/L (3.5-5.0 mmol/L) |
| Serum bicarbonate | 13 mEq/L (13 mmol/L) | 10 mEq/L (10 mmol/L) | 22-29 mEq/L (22-29 mmol/L) |
| S. creatinine | 0.9 mg/dL (79.56 µmol/L) | 0.58 mg/dL (51.27 µmol/L) | 0.5-1.4 mg/dL (44.20-123.76 µmol/L) |
| SGOT | 18 U/L (0.3 µkat/L) | 134 U/L (2.23 µkat/L) | <40 U/L (<0.66 µkat/L) |
| SGPT | 12 U/L (0.2 µkat/L) | 57 U/L (0.95 µkat/L) | <41 U/L (<0.68 µkat/L) |
| Serum CPK | 63 U/L (1.05 µkat/L) | 946 U/L (15.76 µkat/L) | 45-195 U/L (0.75-3.25 µkat/L) |
| Serum LDH | 380 U/L (6.33 µkat/L) | 1723 U/L (28.71 µkat/L) | 225-460 U/L (3.75-7.66 µkat/L) |
| HbA1c | 6.5% (48 mmol/mol) | — | <5.7% (39 mmol/mol) |
| Blood lactate | 29.8 mg/dL (3.31 mmol/L) | 92.78 mg/dL (10.3 mmol/L) | 2.70-11.71 mg/dL (0.3-1.3 mmol/L) |
| Plasma ammonia | (72 µg/dL) (42.27 µmol/L) | (57 µg/dL) (33.46 µmol/L) | (20-80 µg/dL) (11.74-46.97 µmol/L) |
| Myositis panel | — | Ku weak positive | — |
| Urine myoglobulin | Negative | Negative | Negative |
Values in parenthesis are International System of Units (SI).
Abbreviations: CPK, creatine phosphokinase; HbA1c, glycated hemoglobin; LDH, lactate dehydrogenase; SGOT, serum glutamic-oxaloacetic transaminase; SGPT, serum glutamic pyruvic transaminase.
Considering the diagnosis of mitochondrial myopathy, next-generation sequencing–based in-house mitochondrial genetic testing was done [5]. Her genetic panel revealed she was positive for A3243G mutation in gene MT-TL1 with a heteroplasmy of 45% in the peripheral blood (Fig. 5). The neurologist communicated the presence of the underlying mitochondrial disease and potential maternal inheritance. The proband was also positive for the same mutation with 15% heteroplasmy in the peripheral blood.
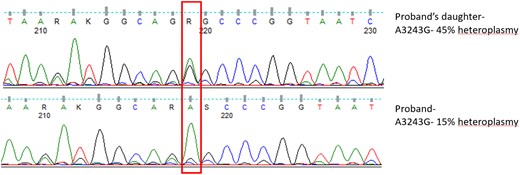
Sanger sequencing showing A3243G hotspot mutation in heterozygous state.
Treatment
The daughter was started on therapy with the mitochondrial cocktail. She was initiated on vitamin E (400 mg once a day), riboflavin (20 mg thrice a day), thiamine (100 mg once a day), vitamin C (500 mg once a day), folic acid (5 mg once a day), L-arginine 2 grams twice daily, and levocarnitine (500 mg thrice a day). Both mother and daughter were initiated on co-enzyme Q supplementation at 100 mg once a day and 100 mg thrice a day, respectively.
Outcome and Follow-Up
The child showed improvement on treatment with regards to her myopathy. However, she was noted to have a decline in her scholastic performance. At the age of 16 years, she was brought in with 2 episodes of generalized tonic clonic seizures, confirmed on electroencephalography, and hospitalized for further management. Magnetic resonance imaging of the brain with magnetic resonance spectroscopy was unremarkable except for blooming in bilateral globus pallidi suggestive of possible early calcification (Fig. 6). She developed severe headache with blurring of vision and scintillating scotomas. Visual evoked potential revealed bilateral anterior pathway dysfunction. She was started on levetiracetam and the dosing of drugs in the mitochondrial cocktail were escalated. Her visual symptoms subsided and she did not have any further seizures. She was started on flunarizine; however, the dose had to be reduced in view of increasing blood lactate levels.
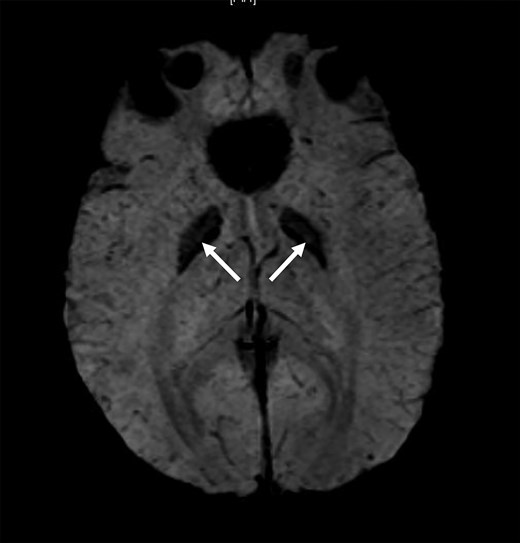
Magnetic resonance susceptibility weighted imaging (SWI) sequence of the brain of the proband’s daughter showing the globus pallidi blooming (arrow).
She had an improvement in muscle strength over the subsequent years with reduction in fatigue. She presented again with severe pain and progressive weakness in both lower limbs, difficulty in waking, and reduced oral intake for a week. She developed recurrent episodes of vomiting, followed by an episode of generalized tonic clonic seizures. She was intubated post seizure in view of worsening metabolic acidosis and poor sensorium and required mechanical ventilation. She eventually succumbed to her illness due to cardiac dysfunction and refractory lactic acidosis. The proband remains on regular follow-up and is on insulin as well as co-enzyme Q complex and is clinically stable.
Discussion
Mitochondrial dysfunction can lead to insulinopenia, insulin resistance, or pancreatic diabetes. Among those with mitochondrial diabetes, maternally inherited diabetes and deafness (MIDD) is the most frequently reported form [4].
Mitochondrial encephalopathy with lactic acidosis and stroke-like episodes (MELAS), has a classic phenotype of childhood onset myopathy, young-onset stroke-like episodes, seizures, migraine, visual disturbances, cognitive decline, as well as lactic acidosis. Eighty percent have been associated with m.3243A>G mutations [6, 7].
The mitochondrial mode of inheritance was initially considered to be solely maternal as mtDNA is maternally transferred, as opposed to nuclear DNA which is inherited equally from both parents. It is now understood that mitochondrial genetics is associated with 2 sets of genomes—an intrinsic mitochondrial genome, encoding 37 genes, as well as the extrinsic nuclear genome which encodes 1500 gene products targeted to the mitochondria. It is only the mitochondrial genome which is maternally inherited. The majority of the nuclear genome mutations which lead to mitochondrial dysfunction and disease are autosomal recessive. Hence mitochondrial disease may follow any inheritance: maternal, autosomal dominant, autosomal recessive, X-linked, or sporadic [4].
Heteroplasmy is a phenomenon unique to mitochondrial diseases. When the level of heteroplasmy exceeds the threshold of a particular tissue, disease ensues. While homoplasmic mitochondrial mutations tend to involve only a single organ system, heteroplasmic mutations tend to have multisystem involvement [2].
Mitochondrial disorders do not have a significant genotype-phenotype correlation. Phenotypic pleiotropy has particularly been associated with m.3243A>G, seen in phenotypes of MELAS, chronic progressive external ophthalmoplegia as well as maternally inherited diabetes and deafness (MIDD) [1]. Myoclonic epilepsy associated with ragged red fibers (MERRF), another mitochondrial ragged red fiber myopathy, also shares several overlapping features. These patients present with predominant symptoms of myoclonus, generalized epilepsy, myopathy and ataxia with around 80% carrying m.8344A>G variant [8]. However, stroke-like episodes and lactic acidosis is rare in pure form of this disease.
In the Indian subcontinent, only a handful of cases with mitochondrial diabetes have been described. Ramakrishna et al describe a 9-year-old male who presented with short stature and poor scholastic performance and went on to develop diabetes mellitus at 16 years and hearing loss at 20 years. Around the same time, his mother and older sister (3 years older than him) were also diagnosed with diabetes mellitus. Genetic testing of the proband demonstrated m.3243A>G mutation. He further developed cramps and electromyography was suggestive of early myopathy; he was treated with vitamin E and levocarnitine combination which relieved the muscle cramps [9]. Mitochondrial diabetes has been associated with several point mutations in transfer RNA (tRNA) genes including m.3243G>A, m.3256C>T, m.3264T>G, m.8344A>G, m.12258T>C, m.14709T>C, m.14577T>C and autosomal recessive mutations in nuclear genes POLG, RRM2B, OPA1 and MPV17 [1].
Our index patient had m.3243A>G mutation and her presentation had been pancreatic diabetes. Her daughter, on the other hand, presented with MELAS with positivity for the same mutation. The heteroplasmy in the daughter was 45% in the peripheral blood while in her mother (proband) it was 15% in peripheral blood. We highlight the difference in heteroplasmy and threshold levels among individuals of the same family, resulting in varying spectrum of mitochondrial clinical disease. It is of key importance to screen family members of those identified with mitochondrial disease. They may not be overtly symptomatic or may have disease manifestations which do not bear similarity with that of the other family members. However, early diagnosis by genetic testing would ensure appropriate therapy with mitochondria-specific vitamin and antioxidant therapy. While no specific therapy has been identified for the treatment of mitochondrial disease, co-enzyme Q10, carnitine, creatine, dichloroacetate, and vitamin supplements have been widely used. The aim with such therapies is to stabilize residual metabolic function and halt disease progression. Using precision medicine, the addition of arginine for metabolic strokes and creatine for metabolic myopathy has been supported [6, 10, 11]. Our proband, on following genetic testing was initiated on therapy and she is currently doing well and on regular follow-up.
Learning Points
Varying degrees of heteroplasmy may present with diverse phenotypes among family members affected by mitochondrial disease.
A high degree of awareness regarding the various clinical presentations of mitochondrial dysfunction is needed.
Drawing a detailed pedigree and timely screening of other family members will go a long way to ensure early and correct diagnosis.
Acknowledgments
Lavanya Ravichandran, Deny Varghese, and Jabasteen Johnson for their support with the molecular genetics laboratory work.
Contributors
All authors made individual contributions to authorship. N.T., S.Y., and M.M.T. were involved in the clinical care of the proband and her daughter. G.C. was involved in the histopathology. A.C. was involved in the next-generation sequencing–based mitochondrial testing. R.J. was involved in patient care and manuscript writing and editing. All authors reviewed and approved the final draft.
Funding
No public or commercial funding.
Disclosures
None declared.
Informed Patient Consent for Publication
Signed informed consent obtained directly from the patient for herself and her daughter.
Data Availability Statement
Original data generated and analyzed during this study are included in this published article.
References
Abbreviations
- MELAS
mitochondrial encephalopathy with lactic acidosis and stroke-like episodes
- mtDNA
mitochondrial DNA
