


Evidence suggests that first-born children and adults are phenotypically different to later-born children. Therefore, we aimed to assess whether birth order would be associated with changes in metabolism in childhood.
We studied 85 healthy prepubertal children aged 4 to 11 years, born 38 to 40 weeks' gestation, and birth weight appropriate for gestational age: 32 first-born and 53 later-born children. Clinical assessments included measurement of children's height, weight, fasting lipid and hormonal profiles, and dual-energy x-ray absorptiometry–derived body composition. Children also underwent 24-hour ambulatory blood pressure monitoring, and frequently sampled intravenous glucose tests with Bergman's minimal model.
First-born children were approximately 3 cm taller (height SD scores 0.88 vs 0.39; P = .009) and were slimmer (body mass index SD scores −0.05 vs 0.39; P = .048) than later-born children. Consistent with their taller stature, first-born children also had a 27% increase in IGF-I concentrations (227 vs 173 ng/mL; P = .002). Insulin sensitivity was reduced by 21% among first-borns compared to later-borns (8.4 vs 10.6 × 10⁻⁴/min/[mU/L]; P = .019). Further, 24-hour ambulatory blood pressure monitoring showed that first-borns had higher daytime systolic (+5 mm Hg; P = .032) and diastolic (+4 mm Hg; P = .029) blood pressure. Blood lipids were unaffected by birth order.
Although first-borns were taller and slimmer, these children had reduced insulin sensitivity and increased daytime blood pressure compared to later-borns. Thus, first-borns may be at a greater risk of metabolic and cardiovascular diseases in adult life. This finding may have important public health implications, in light of a worldwide trend toward smaller families.
There has been a steady reduction in fertility worldwide (1), with a more severe decline in birth rates observed in many European and Asian countries (2). Several reasons may account for the reduction in birth rates, including government policies such as the 1-child policy in mainland China (3), greater family planning, personal choice, and economical constraints. Irrespective of underlying causes, there has been a large increase in the number of single-child families (1), and a consequent increase in the proportion of first-born children.
A number of studies suggest that birth order affects the offspring in the long-term. There is evidence of phenotypic differences in childhood (4–6) and in adulthood (7–9). In addition, previous studies have shown that first-born children are at a greater risk of developing type 1 diabetes (10) as well as of having increased blood pressure (BP) (11). As a result, the increasing proportion of first-born children could affect the incidence of cardiovascular and metabolic diseases in a given population.
Alterations in the fetal environment (including changes in fetal nutrition) are associated with an increased risk of disease in adulthood (12). There is ongoing research investigating possible causes for the global epidemic of type 2 diabetes, including large population genetic studies that have had limited success (13, 14). The prevalence of hypertension is also increasing in industrialized countries, without clear explanation (15). Because the causes of type 2 diabetes and hypertension are multifactorial, we hypothesized that birth order may be a contributing factor. Thus, we aimed to assess whether birth order adversely affects glucose metabolism in childhood.
Materials and Methods
Ethics approval
Ethics approval for this study was provided by the Northern Y Regional Ethics Committee (Ministry of Health, New Zealand). Written informed consent was obtained from parents or guardians as well as verbal or written consent from each child as was appropriate to their age.
Subjects and recruitment
Only healthy, developmentally normal, prepubertal children aged 4 to 10 years, born between 38 and 40 weeks' gestation, were recruited for this study in 2010 to 2011. Potential participants were identified from the obstetrics database at the National Women's Health, Auckland City Hospital (Auckland, New Zealand). All children were naturally conceived, born of singleton pregnancies, and of birth weight appropriate for gestational age (birth weight >−2 and <2 SD scores [SDS]). Exclusion criteria included signs of puberty (Tanner stage 2 breast development in girls and testicular volume >3 mL in boys or evidence of adrenarche), receiving medication that could affect insulin sensitivity, as well as having a first-degree relative or grandparent with prediagnosed diabetes, the metabolic syndrome, or any of its features other than central adiposity. Children were also excluded if born to mothers with gestational diabetes, pre-eclampsia, gestational or pre-existing hypertension, chronic illnesses, or maternal drug use (including tobacco) during pregnancy.
Clinical assessments
All clinical assessments were carried out at the Maurice and Agnes Paykel Clinical Research Unit (Liggins Institute, University of Auckland). Data on each child were collected during a single visit to the clinic. A number of neonatal parameters were recorded, including birth weight, gestational age, and maternal age at time of delivery. Birth weight data were transformed into SDS (16).
Primary outcome
The primary outcome was insulin sensitivity, which was assessed using a 90-minute modified frequently sampled iv glucose test, modified with insulin and analyzed using Bergman's minimal model software (17). Three baseline samples were drawn at −20, −10, and 0 minutes. A 25% dextrose infusion (at 0.3 g/kg) was started at 0 minutes and lasted for 1 minute. Blood samples were drawn at 2, 3, 4, 5, 6, 8, 10, 12, 14, 16, and 19 minutes. Insulin (0.015 U/kg) was then administered iv as a bolus at 20 minutes, and further samples were drawn at 22, 23, 24, 25, 27, 30, 35, 40, 45, 50, 60, 70, 80, and 90 minutes. Values derived from the minimal model included the insulin sensitivity index and acute insulin release (measure of insulin secretory capacity).
Secondary outcomes
Children's heights were measured using a Harpenden's stadiometer, whereas weight and body composition data were obtained using whole-body dual-energy x-ray absorptiometry (DEXA; Lunar Prodigy 2000, General Electric, Madison, Wisconsin). Height SDS were derived from Tanner/Whitehouse reference data (18) and weight and body mass index (BMI) SDS were derived according to British 1990 standards (16, 19). Maternal and paternal weight and height were recorded for all participants. Mean parental BMI was calculated as the average of maternal and paternal BMI. Midparental height was calculated using standard formulas (20). Ethnicity was recorded by self-report using a prioritized system, such that if multiple ethnicities were selected, the patient was assigned to a single category, following a hierarchical system of classification (21).
Following an overnight fast, baseline blood samples were drawn to measure serum total cholesterol, high-density lipoprotein cholesterol, low-density lipoprotein cholesterol, triglycerides, IGF-I, IGF-II, IGF binding protein 1 (IGFBP-1), IGFBP-3, leptin, adiponectin, androstenedione, dehydroepiandrosterone sulfate (DHEAS), cortisol, glucose, and insulin.
Twenty-four-hour ambulatory BP was assessed following the clinical visit, when participants were fitted with a Spacelabs 90217 monitor (Spacelabs Medical Inc, Redmond, Washington) on the nondominant arm. Measurements were performed every 20 minutes from 0700 to 2200, and every 30 minutes from 2200 to 0700. Only profiles with more than 14 daytime and 7 nocturnal readings over a 24-hour period were included for analysis (22).
Assays
Glucose concentrations were measured on a Hitachi 902 autoanalyzer (Hitachi High Technologies Corporation, Tokyo, Japan) by enzymatic colorimetric assay (Roche, Mannheim, Germany), with an interassay coefficient of variation (CV) of 2.1%. Insulin concentrations were measured using an Abbott AxSYM system (Abbott Laboratories, Abbott Park, Illinois) by microparticle enzyme immunoassay, with a CV of 5.7%. Total cholesterol, high-density lipoprotein cholesterol, and low-density lipoprotein cholesterol concentrations were measured using a Hitachi 902 autoanalyzer with CVs of 8.9%, 11.4%, and 10.1%, respectively. Commercially available ELISA kits E20, E30, E01, E05, E03A, E07, and E09 (Mediagnost, Reutlingen, Germany) were used for quantitative determination of serum IGF-I, IGF-II, IGFBP-1, IGFBP-3, leptin, and adiponectin, respectively; assay sensitivities were 0.09, 0.02, 0.2, 0.1, 1.0, and 0.6 ng/mL, with CV of 3.1, 5.0, 9.4, 9.6, 6.7, and 3.0%, respectively. Cortisol, DHEAS, and androstenedione were measured using Finnigan TSQ Quantum Ultra AM triple quadrupole mass spectrometer controlled by Finnigan Xcaliber software (Thermo Electron Corp, San Jose, California); mean CVs were 5.8% for cortisol, 18.4% for DHEAS, and 8.2% for androstenedione.
Statistical analysis
Children were separated into 2 groups according to their birth order: first-borns and later-borns. Comparisons between birth-order groups were carried out using linear mixed models in SAS v.9.2 (SAS Institute, Cary, North Carolina). All models accounted for important confounding factors, mainly gender, ethnicity, birth weight SDS, gestational age, and maternal age. All models included family identification number as a random factor, to account for the clustering of siblings. Other factors were controlled for as required, depending on the outcome response of interest: for lipids, hormones, and outcomes associated with glucose homeostasis: age and BMISDS were included; for anthropometric data: age and the appropriate parental factor (ie, mean parental BMI or midparental height); and for BP parameters: height and total body fat percentage. Where appropriate, data were log-transformed to approximate a normal distribution. Age data are presented as means ± SD, whereas other data are means and 95% confidence intervals adjusted for the confounders in multivariate models.
Results
In total, 85 children aged 8.7 ± 1.9 years (range 4–11) took part in the study, including 32 first-borns (69% boys) and 53 later-borns (57% boys). Among the latter group, there were 35 second-borns, 8 third-borns, and 8 fourth-born children.
First-borns were lighter at birth than later-borns (P = .009), despite similar gestational ages (P = .75; Table 1). There were no differences in biological maturity between birth-order groups, as all children were prepubertal and had similar DHEAS (P = .18) and androstenedione (P = .28) concentrations (data not shown).
Baseline and Auxologic Characteristics in First-Born and Later-Born Children
| First-Borns | Later-Borns | P Value | |
|---|---|---|---|
| n | 32 | 53 | |
| Sex ratio, % boys | 69 | 57 | .36 |
| Age, y | 9.1 ± 2.1 | 8.5 ± 1.7 | .072 |
| Gestation, wk | 39.5 ± 0.7 | 39.4 ± 0.7 | .75 |
| Birth weight, kg | 3.19 (3.02–3.37) | 3.44 (3.30–3.59) | .0009 |
| Height SDS | 0.88 (0.48–1.29) | 0.39 (0.07–0.86) | .009 |
| BMISDS | −0.05 (−0.54–0.45) | 0.39 (0.02–0.76) | .048 |
| Total body fat, % | 18.2 (15.1–21.9) | 19.3 (16.8–22.3) | .47 |
| Android fat to gynoid fat ratio | 0.54 (0.47–0.63) | 0.56 (0.50–0.63) | .64 |
| Lean mass, % | 75.6 (71.3–80.0) | 74.4 (71.1–77.7) | .51 |
| Bone mineral content, g | 1090 (978–1202) | 1003 (916–1090) | .059 |
| Bone mineral density, g/cm2 | 0.886 (0.857–0.916) | 0.877 (0.854–0.899) | .47 |
Age data are mean ± SD; other data are means and 95% confidence intervals adjusted for other confounding factors in the multivariate models. Statistically significant results (P < .05) are shown in bold.
First-borns were taller (P = .009) and had lower BMI (P = .048) than later-borns (Table 1), despite correction for parental variables (height and BMI) in the model. There was also an indication of an effect on bone mineral content, which appeared to be 9% higher among first-born children (P = .059; Table 1). In keeping with the differences in stature, IGF-I concentrations were also increased in first-borns compared to later-borns (P = .0002; Table 2).
Secondary Outcomes on First-Born and Later-Born Children
| First-Borns | Later-Borns | P Value | |
|---|---|---|---|
| n | 32 | 53 | |
| 24-h ambulatory BP | |||
| Daytime systolic BP, mm Hg | 112.6 (107.3–118.0) | 107.7 (103.3–112.1) | .032 |
| Nocturnal systolic BP, mm Hg | 97.6 (91.6–103.6) | 96.6 (91.6–101.6) | .66 |
| Daytime diastolic BP, mm Hg | 69.2 (65.2–73.2) | 65.3 (62.1–68.6) | .029 |
| Nocturnal diastolic BP, mm Hg | 55.8 (51.4–60.2) | 54.3 (50.7–58.0) | .38 |
| Diastolic dip, % | 17.2 (11.9–22.5) | 15.8 (11.5–20.1) | .51 |
| Systolic dip, % | 12.2 (8.4–16.1) | 9.9 (6.8–13.0) | .14 |
| Lipids | |||
| Total cholesterol, mmol/L | 3.88 (3.44–4.31) | 3.83 (3.50–4.16) | .80 |
| LDL-C, mmol/L | 2.34 (2.00–2.69) | 2.22 (1.96–2.49) | .44 |
| HDL-C, mmol/L | 1.30 (1.15–1.45) | 1.30 (1.19–1.42) | .93 |
| Total cholesterol: HDL-C | 3.05 (2.71–3.42) | 2.95 (2.69–3.23) | .53 |
| Hormones | |||
| IGF-I, ng/mL | 227 (199–256) | 173 (151–194) | .0002 |
| IGF-II, ng/mL | 690 (637–744) | 668 (628–709) | .39 |
| IGFBP-1, ng/mL | 9.79 (6.70–14.31) | 13.45 (10.10–17.90) | .085 |
| IGFBP-3, ng/mL | 3071 (2675–3466) | 3216 (2913–3519) | .43 |
| Glucose homeostasis | |||
| Fasting glucose, mg/dL | 84.3 (81.6–87.0) | 85.3 (83.3–87.4) | .32 |
| Fasting insulin, mU/L | 5.49 (4.17–7.22) | 5.93 (4.81–7.30) | .53 |
Data are means and 95% confidence intervals adjusted for other confounding factors in the multivariate models. Statistically significant results (P < .05) are shown in bold.
Assessment of glucose homeostasis showed a 21% reduction in insulin sensitivity among first-borns compared to later-borns (8.4 vs 10.6 × 10⁻⁴/min/[mU/L]; P = .019) (Fig. 1). However, there was no significant increase in the compensatory acute insulin response (350 vs 284 mU/L; P = .16) (Fig. 1).
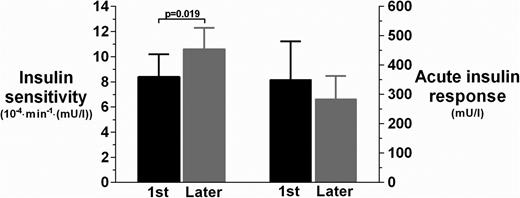
Insulin sensitivity (primary outcome) and acute insulin response among first-born (black bars) and later-born (gray bars) children. Data are means and 95% confidence intervals are adjusted for other confounding factors in the multivariate models.
Twenty-four-hour ambulatory BP monitoring also revealed that first-borns had higher daytime systolic (P = .032) and diastolic (P = .029) BP than later-borns (Table 2). Lipid profiles were unaffected by birth order (Table 2), and both groups had similar fasting serum leptin (3.54 vs 3.15 ng/mL; P = .46) and adiponectin concentrations (10 316 vs 9616 ng/mL; P = .50).
Discussion
This study shows that first-born children have reduced insulin sensitivity compared to later-born children. The observed 21% reduction in insulin sensitivity has not been described previously and is comparable to that seen as a result of obesity in childhood (23, 24). Decreased insulin sensitivity is known to precede a number of important adult diseases years before they occur, such as type 2 diabetes mellitus, coronary artery disease, stroke, hypertension, and cancer (25, 26).
Our first-born cohort also had higher daytime systolic and diastolic ambulatory BP compared to later-born children. Previous studies have described increased BP in first-borns compared to later-borns in childhood (11, 27) and adolescence (6), but they used single BP measurements that are less precise. Elevations in BP in childhood often track into adulthood (28, 29), and our findings suggest that first-born children may be at a greater risk of later hypertension. Higher BP and the observed reduction in insulin sensitivity indicate that first-borns are at a greater risk of developing the metabolic syndrome (30). The latter comprises a combination of insulin resistance with or without glucose intolerance with any 2 of the following: central obesity, high BP, dyslipidemia, proinflammatory state, or prothrombotic state (31).
We also observed that first-borns were taller and slimmer than later-borns, with increased IGF-I concentrations. Higher IGF-I levels are associated with lower birth weight and were directly related to present height and systolic BPs in a cohort of 444 prepubertal children studied by Fall et al (32). However, the observed differences among first-born children in our study were independent of birth weight, which was controlled for in all our analyses.
There is no obvious mechanism that could explain the combination of adverse metabolic but positive auxologic changes seen in first-born children. There is some evidence that implantation and placentation during first pregnancy leads to physical changes in the uterus (33–35). These changes become more evident in second and subsequent pregnancies and are associated with more efficient placental invasion of the uterine wall and consequent improvement in nutrient flow to the fetus (33–35). Thus, first-borns may be exposed to a degree of nutrient restriction in utero compared to later-borns (36), which may lead to alterations in glucose metabolism and BP later in life.
Indeed, it is thought that this disparity in placentation between first and later pregnancies is partially responsible for an approximate 200 g increase in birth weight among later-borns (37). This difference in birth weight is similar to the 250 g that was observed in our study. Lower birth weight is well recognized to be associated with reduced insulin sensitivity in children (38, 39) and adults (40–43). However, our multivariate models accounted for birth weight and gestational age among other important confounders, suggesting that the reduction in insulin sensitivity among first-borns is likely to be associated with other factors.
In conclusion, first-born children were taller and slimmer than later-borns. However, first-borns also had lower insulin sensitivity and higher daytime BP, which suggest that first-borns are likely to be at a greater risk of metabolic and cardiovascular diseases later in life compared to their siblings. These findings have important public health implications, in view of a growing trend toward smaller families and the consequent increase in the proportion of first-borns in the population. Thus, we speculate that the increase over the past decades in the proportion of first-borns worldwide may be a contributing factor to the global increase in prevalence of type 2 diabetes and hypertension. It should be highlighted that prepubertal children were studied to remove the confounding effects of puberty and adult lifestyle factors (eg, smoking, alcohol, prescription drugs) on insulin sensitivity. However, large, adult studies should be carried out to corroborate our findings. Further research is needed to elucidate underpinning mechanisms of altered growth and metabolism in first-borns.
Acknowledgments
We acknowledge the Paykel Trust for long-term funding of the Maurice and Agnes Paykel Clinical Research Unit at the Liggins Institute, University of Auckland. We thank Gravida: National Centre for Growth and Development and the Australasian Pediatric Endocrine Group for financial support. We also thank Eric Thorstensen (Liggins Institute) and his group for assistance with laboratory work.
This work was supported by funding from Gravida: National Centre for Growth and Development (New Zealand) and the Australasian Pediatric Endocrine Group (APEG). We also acknowledge the Paykel Trust for long-term funding of the Maurice and Agnes Paykel Clinical Research Unit at the Liggins Institute, University of Auckland.
A.A., W.S.C., T.S., and P.L.H. conceived and designed the study. A.A. recruited and performed the tests. A.A. collected and compiled the data. J.G.B.D. carried out the statistical analyses. T.S., A.A., J.G.B.D., and W.S.C. wrote the manuscript with input from P.L.H. All authors have approved the submission of the final version of this manuscript.
Disclosure Summary: The authors have no conflicts of interest to disclose.
A.A. and T.S. contributed equally as first authors to the study.
Abbreviations
- BMI
body mass index
- BP
blood pressure
- CV
coefficient of variation
- DHEAS
dehydroepiandrosterone sulfate
- IGFBP
IGF binding protein
- SDS
standard deviation score.
