


Abstract
An important goal during weight loss is to maximize fat loss while preserving metabolically active fat-free mass (FFM). Massive weight loss typically results in substantial loss of FFM potentially slowing metabolic rate.
Our objective was to determine whether a weight loss program consisting of diet restriction and vigorous exercise helped to preserve FFM and maintain resting metabolic rate (RMR).
We measured body composition by dual-energy x-ray absorptiometry, RMR by indirect calorimetry, and total energy expenditure by doubly labeled water at baseline (n = 16), wk 6 (n = 11), and wk 30 (n = 16).
At baseline, participants were severely obese (×± sd; body mass index 49.4 ± 9.4 kg/m2) with 49 ± 5% body fat. At wk 30, more than one third of initial body weight was lost (−38 ± 9%) and consisted of 17 ± 8% from FFM and 83 ± 8% from fat. RMR declined out of proportion to the decrease in body mass, demonstrating a substantial metabolic adaptation (−244 ± 231 and −504 ± 171 kcal/d at wk 6 and 30, respectively, P < 0.01). Energy expenditure attributed to physical activity increased by 10.2 ± 5.1 kcal/kg·d at wk 6 and 6.0 ± 4.1 kcal/kg·d at wk 30 (P < 0.001 vs. zero).
Despite relative preservation of FFM, exercise did not prevent dramatic slowing of resting metabolism out of proportion to weight loss. This metabolic adaptation may persist during weight maintenance and predispose to weight regain unless high levels of physical activity or caloric restriction are maintained.
The prevalence of severe obesity [i.e. body mass index (BMI) >40 kg/m2] continues to increase (1), with potentially dire implications for the health of the population and the economy (2). Bariatric surgery is becoming an increasingly accepted treatment for severe obesity (3) because it results in massive weight loss and improved health and disease outcomes (4). However, these procedures typically cause an undesirable loss of fat-free mass (FFM) (5), which comprises the metabolically active tissues of the body (6, 7). Because FFM is the primary determinant of resting metabolic rate (RMR) (8, 9), a large reduction in FFM is expected to slow the metabolic rate. Furthermore, a suppression of RMR out of proportion to the loss in body weight and FFM may occur through a phenomenon known as adaptive thermogenesis or metabolic adaptation (10–17). Together the loss of FFM along with metabolic adaptation may profoundly decrease resting energy expenditure, slow the rate of weight loss, and may predispose to weight regain.
Adding exercise to a weight-loss program, particularly resistance training, is thought to preserve FFM and attenuate the drop in RMR during weight loss (18–21). Theoretically any strategy that can lessen the decrease in RMR after weight loss could increase the chances for long-term weight loss success (22). In the present study, we measured body composition and energy expenditure in a unique group of severely obese individuals undergoing massive weight loss through a 30-wk competitive program of diet restriction and vigorous exercise. The objective of this observational study was to determine whether participation in this intensive program helped to preserve FFM and thereby attenuate the metabolic slowing due to weight loss.
Materials and Methods
Participants
This study involved measures of body composition and energy expenditure in individuals competing in a nationally televised weight loss competition. To participate in the competition, subjects could not be pregnant or lactating, have orthopedic conditions that interfered with walking, or have had previous bariatric surgery. All subjects obtained medical clearance before competition. The study was approved by the Institutional Review Boards of Cedars Sinai Medical Center (no. 8967) and Pennington Biomedical Research Center (no. PBRC29008), and participants provided written informed consent before participating.
Environment
Once in the competition, participants were housed together at an isolated ranch outside Los Angeles. The exercise component of the competition consisted of 90 min/d (6 d/wk) of directly supervised vigorous circuit training and/or aerobic training. Subjects were encouraged to exercise up to an additional 3 h/d. Dietary intake was not monitored; however, subjects were advised to consume a calorie-restricted diet greater than 70% of their baseline energy requirements as calculated by the following: 21.6 kcal/kg·d × FFM (kilograms) + 370 kcal/d (23). Every 7–10 d, a participant was voted out of the competition and returned home to continue their exercise and diet program unsupervised at home. Four participants remained at the ranch by wk 13, at which time they all returned home. At wk 30 (7 months), all the participants returned to Los Angeles for testing, coincident with the live television broadcast.
Measurements
Testing was conducted at baseline (∼1 wk before competition), 6 wk, and 30 wk. Body composition was determined by dual-energy x-ray absorptiometry (GE Lunar, Madison, WI), and FFM and fat mass (FM) were calculated from weight and whole-body percent fat using the thick scan mode. The supine body width exceeded the dimensions of the scan window for all participants; therefore, scans were analyzed using the dual-energy x-ray absorptiometry MirrorImage application, which automatically calculates total body results by doubling the half-body values. Previous research has shown that this method provides an accurate estimate of total body results (24).
The RMR was measured by indirect calorimetry (Max II metabolic cart; AEI Technologies, Naperville, FL) after a 10-h overnight fast. Participants rested supine in a quiet, darkened room for 30 min at thermoneutrality before testing, followed by the measurement of the O2 consumption and CO2 production for 20 min, with the last 15 min used to determine the RMR.
Blood samples were collected after a 10-h overnight fast at only the baseline and wk 30 time points. A chemistry panel was measured on a Beckman Synchron CX5CE or CX9PRO (GMI, Inc., Ramsey, MN). Insulin, adiponectin, and leptin were determined by RIA, and a thyroid panel (T3, T4, TSH) was run by immunoassay with chemiluminescent detection (Millipore Corp., Billerica, MA). Insulin resistance was calculated using the homeostasis model assessment of insulin resistance (HOMA-IR) using fasting measurements of glucose and insulin (28).
Statistical analysis
Predicted RMR values were calculated at wk 6 and 30 using measured FFM and FM at those time points. Differences between measured and predicted RMR (i.e. RMR residual) were calculated and analyzed by ANOVA. A metabolic adaptation was considered present if the RMR residuals were negative and different from zero. To graphically illustrate the dependence of RMR on FFM, we plotted the RMR adjusted for age, sex, and FM vs. FFM.
Associations between physiological factors were examined using Pearson or Spearman rank correlation coefficients as appropriate, depending on normality of the data. Tukey-Kramer adjustment was used to control for multiple comparisons.
Results
Seven males and nine females participated in the study and ranged in age from 20 to 56 yr (33 ± 10 yr). All 16 participants completed baseline and wk 30 assessments, but only those remaining at the ranch (n = 11) completed wk 6 measures. There were no significant differences in body composition, energy expenditure, or weight loss parameters between those who did or did not have wk 6 measures (all P > 0.10). Participants were severely obese at baseline with a BMI of 49.4 ± 9.4 kg/m2 and body weight of 149.2 ± 38.0 kg, nearly half of which was fat (49 ± 5%) (Table 1). Mean fasting glucose and insulin were within normal limits; however, calculated HOMA-IR values suggested insulin resistance (Table 2). One person had a fasting glucose of 145 mg/dl, diagnostic of type 2 diabetes (≥126 mg/dl), and two others had levels greater than 100 (111 and 104) mg/dl, characteristic of impaired fasting glucose (100–125 mg/dl) (29). Other laboratory values, including triacylglycerol (TAG) and total cholesterol, were within normal limits (Table 2).
Anthropometrics and energy expenditure
| Entire sample (n = 16) | Wk 6 completers only (n = 11) | ||||
|---|---|---|---|---|---|
| Baseline | Wk 30 | Baseline | Wk 6 | Wk 30 | |
| Anthropometry | |||||
| Body weight (kg) | 149.2 (38.0) | 91.6 (22.9)a | 144.9 (39.4) | 129.9 (35.2)a | 86.8 (24.0)a,b |
| BMI (kg/m2) | 49.4 (9.4) | 30.4 (6.3)a | 48.7 (10.1) | 43.6 (9.1)a | 29.3 (6.9)a,b |
| Weight change (%) | 37.9% (9.1%) | 10.3% (1.6%) | 39.4% (9.5%) | ||
| FFM (kg) | 75.7 (20.2) | 65.2 (15.5)a | 73.6 (20.8) | 70.7 (19.6)ns | 62.4 (14.8)a,b |
| FM (kg) | 73.5 (21.1) | 26.4 (13.8)a | 71.3 (22.7) | 59.1 (19.1)a | 24.5 (14.0)a,b |
| Body fat (%) | 49% (5%) | 28% (10%)a | 49% (6%) | 46% (6%)ns | 27% (9%)a,b |
| Weight loss proportion | |||||
| FFM (%) | 17.4% (7.8%) | 17.1% (16.5%) | 18.4% (8.4%) | ||
| FM (%) | 82.6% (7.8%) | 82.9% (16.5%) | 81.6% (8.4%) | ||
| Energy expenditure | |||||
| RMR measured (kcal/d) | 2679 (624) | 1890 (423)a | 2614 (690) | 2258 (441)a | 1763 (344)a,b |
| RMR predicted (kcal/d) | 2393 (466) | 2502 (548) | 2279 (429) | ||
| Metabolic adaptation (kcal/d) | −504 (171)c | −244 (231)c | −516 (185)c,d | ||
| (n = 14) | (n = 9) | ||||
| TEE (kcal/d) | 3900 (957) | 3114 (571)a | 3727 (1035) | 4531 (1041)a | 2906 (540)a,b |
Data were mean (sd). Metabolic adaptation refers to the change in energy expenditure not explained by changes in FFM and FM, i.e. the difference between actual and predicted values. Predicted values were calculated on the basis of the equation for RMR generated at baseline. ns, Not significant.
P < 0.05 compared with baseline.
P < 0.05 compared with wk 6.
P < 0.05 adaptation different from baseline (zero).
P < 0.05 adaptation different from wk 6.
Biochemical and blood pressure measurements (n = 16)
| Baseline | Wk 30 | P value | |
|---|---|---|---|
| Glucose (mg/dl) | 95 ± 15 | 76 ± 6 | <0.001 |
| Insulin (μU/ml) | 9.8 ± 8.0 | 5.1 ± 4.3 | 0.07 |
| C-peptide (ng/ml) | 2.8 ± 1.3 | 1.4 ± 0.9 | 0.004 |
| HOMA-IRa | 2.3 ± 2.1 | 0.9 ± 0.8 | 0.03 |
| TAG (mg/dl) | 119 ± 77 | 55 ± 24 | 0.003 |
| Cholesterol (mg/dl) | 168 ± 40 | 192 ± 48 | 0.07 |
| LDL (mg/dl) | 105 ± 29 | 126 ± 45 | 0.07 |
| HDL (mg/dl) | 43 ± 17 | 55 ± 14 | 0.002 |
| Adiponectin (μg/ml) | 2.6 ± 1.2 | 4.7 ± 1.9 | <0.001 |
| Leptin (ng/ml) | 42.9 ± 17.8 | 2.7 ± 2.4 | <0.001 |
| Thyroid profile | |||
| T3 (ng/dl) | 94 ± 27 | 53 ± 15 | 0.0002 |
| T4 (μg/dl) | 7.3 ± 1.5 | 6.9 ± 1.4 | 0.35 |
| TSH (μIU/ml) | 1.5 ± 1.2 | 1.3 ± 0.8 | 0.6 |
Data are mean ± sd. LDL, Low-density lipoprotein; HDL, high-density lipoprotein.
HOMA-IR is the following: [fasting glucose (millimoles per liter) × fasting insulin (microunits per milliliter)]/22.5.
At wk 6, the 11 participants who were at the ranch had lost 15.0 ± 4.9 kg, more than 10% of their starting body weight (P < 0.001). Most of the weight loss was in the form of fat, with only 17% of the loss coming from FFM (Table 1). Accordingly, FM decreased significantly between baseline and wk 6, without a significant change in FFM (Table 1). By wk 30, in the entire sample of 16, participants lost 57.6 ± 23.8 kg, a reduction of nearly 40% of their initial body weight (P < 0.001). The classification of BMI changed from being in the severely obese category to just over the threshold for obesity (Table 1). The proportion of weight loss coming from fat vs. FFM remained consistent from wk 6 percentages (Table 1 and Fig. 1A). Figure 1b shows the progression of body weight loss over 30 wk.

A, Loss of FFM and FM at wk 6 (n = 11) and wk 30 (n = 16) of the weight-loss competition. The FFM did not decrease significantly from baseline to wk 6 (P > 0.05). All other decreases were significant at P < 0.01. B, The progression of weight loss over the 30-wk competition. The numbers below each data point indicate the number of participants who had their body weight measured at that time and comprise the measurement. At week 13.4, 5 participants were weighed prior to all leaving the ranch; however, only 4 remained in contention and were considered finalists.
Despite the relative preservation of FFM, RMR dropped from baseline by 356 ± 399 kcal/d and 789 ± 483 kcal/d at wk 6 and 30, respectively (Table 1, P < 0.05). To account for the altered body weight and composition, the predicted RMR at wk 6 and 30 was calculated according to the following equation developed using baseline data: RMR (kilocalories per day) = 1241 kcal/d + 19.2 (FFM) + 1.8 (FM) − 9.8 (age) + 404 (for males) (R2 = 0.85). Using this equation, RMR was predicted to be 2502 ± 548 kcal/d at wk 6, whereas the measured RMR was 2258 ± 441 kcal/d, i.e. metabolic rate decreased by 244 ± 231 kcal/d more than expected based on the changes in FFM and FM (Table 1). At wk 30, the RMR was predicted to be 2393 ± 466 kcal/d, a reduction of 504 ± 171 kcal/d more than expected on the basis of the new weight and body composition (Table 1). Although simple division of the RMR by FFM is commonly used to correct for metabolic mass, this procedure is known to artificially increase the normalized RMR as the FFM decreases (30). Thus, the RMR per kilogram of FFM is expected to increase with weight loss in the absence of metabolic adaptation. However, RMR per kilogram of FFM fell to 29 ± 2 kcal/kg·d after weight loss at wk 30 from a baseline of 36 ± 4 kcal/kg·d (P < 0.0001), thereby demonstrating the presence of a substantial metabolic adaptation, regardless of the normalization procedure. The RQ (CO2 production/O2 consumption) was low at baseline (0.76 ± 0.05), suggesting increased fat oxidation at rest, and did not change from baseline to either time point (wk 6, RQ = 0.76 ± 0.04; wk 30, RQ = 0.75 ± 0.03, all P > 0.5).
Figure 2 shows the relationship between RMR (adjusted for FM, age, and sex) and FFM at baseline and wk 30 in comparison with the regression line derived from the RMR and FFM at baseline. Although the baseline RMR data (Fig. 2, solid symbols) fall close to the regression line, at wk 30 all of the RMR values (Fig. 2, open symbols) fall below the baseline regression curve. Together the residuals in the RMR (actual minus predicted value) plus the deviation from the regression line demonstrate that despite a relative preservation of FFM, a large metabolic adaptation to weight loss occurred.
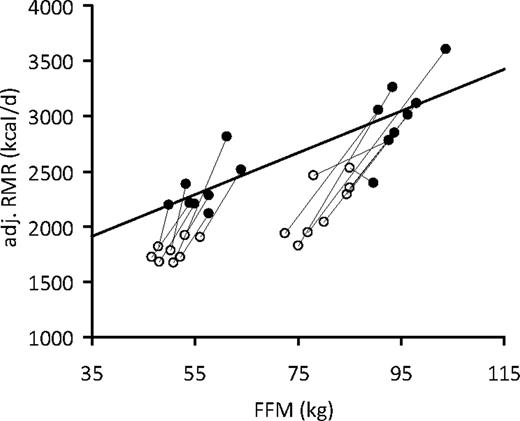
RMR adjusted for sex, age, and FM (adjusted RMR, kilocalories per day) at baseline (●) and wk 30 (○) of the weight-loss competition (n = 16). The regression line was derived from RMR measurements at baseline in all 16 participants. The deviation from the regression line at wk 30 suggests that RMR per kilogram of FFM was reduced, indicative of metabolic adaptation.
TEE increased significantly from baseline to wk 6 (P = 0.03, Table 1) and, because the RMR was concomitantly decreased, demonstrates a substantial increase in physical activity. At wk 30, TEE was similar to baseline levels; however, the similar TEE despite massive weight loss suggests maintenance of a high level of physical activity (Table 1). Figure 3A shows that nonresting energy expenditure (NREE; TEE − RMR) comprised 31 ± 6% of TEE at baseline, increased to 48 ± 9% at wk 6, and declined to 40 ± 7% at wk 30. Absolute NREE was not different between baseline and wk 30 (1207 ± 396 vs. 1255 ± 290 kcal/d, respectively, P = 0.85). The subjects were relatively sedentary at baseline with a physical activity expenditure of 5.5 ± 1.9 kcal/kg·d. However, physical activity expenditure substantially increased by 10.2 ± 5.1 kcal/kg·d at wk 6 and was 6.0 ± 4.1 kcal/kg·d higher than baseline at wk 30 (both P < 0.001 vs. baseline and P = 0.16 between wk 6 and 30).
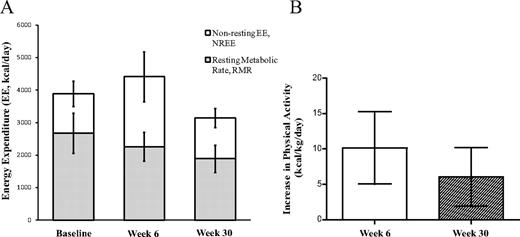
A, TEE partitioned into resting (RMR) and nonresting (NREE) components. The NREE includes the energy expended in physical movement and diet-induced thermogenesis. At wk 6, the NREE is significantly increased (P = <0.001) and the RMR decreased (P = 0.04) from baseline. At wk 30, the NREE is not different from the baseline (P = 0.82) and the RMR is significantly decreased (P < 0.001). B, The increase in estimated physical activity from baseline was10.2 ± 5.1 kcal/kg·d at wk 6 and 6.0 ± 4.1 kcal/kg·d at wk 30 (P < 0.001 vs. zero). The decrease from wk 6 to wk 30 was not significant (P = 0.16).
Fasting glucose decreased nearly 20 mg/dl at wk 30 (all were <90 mg/dl) and insulin dropped by half. As a consequence, HOMA-IR fell to within normal range, indicating improved insulin sensitivity. The lipid profile showed that TAG decreased significantly; however, cholesterol tended to increase and consisted of increases in both low-density lipoprotein and high-density lipoprotein components. Body weight at baseline was negatively associated with adiponectin (r = −0.71, P = 0.002) but not with leptin (r = 0.08, P = 0.78). Consistent with weight loss, leptin decreased from 43 ng/ml at baseline to less than 3 ng/ml at wk 30, and adiponectin levels nearly doubled (Table 2). Those who lost the most weight had the greatest increase in adiponectin (r = 0.51, P = 0.04) and the largest decrease in T3 (r = 0.59, P = 0.03).
Whereas TSH and T4 did not significantly change, T3 dropped by 44% during weight loss (Table 2). TSH was positively correlated with the change in circulating T3 (r = 0.77, P = 0.001). Interestingly, the change in TSH levels after weight loss was associated with a reduced metabolic adaptation (r = 0.56, P = 0.04), but surprisingly there was no significant association between changes in T3 and metabolic adaptation (r = 0.39, P = 0.2). No associations were detected between weight loss, changes in energy expenditure, and changes in leptin concentration. Those who lost the most weight had the largest metabolic adaptation (r = 0.61, P = 0.01).
Discussion
An important objective during weight loss is to maximize the loss of body fat while minimizing the loss of metabolically active fat free mass. Limited studies of modest weight loss suggest that adding exercise to a weight loss program may help spare FFM (19–21). In the present study, we found that individuals undergoing rapid and massive weight loss through a combination of diet restriction and vigorous physical activity preserved much of their FFM, with less than 18% of the total weight loss coming from the fat-free compartment. We suspect that the relative preservation of FFM was due to the maintenance or possible increase of skeletal muscle tissue during the vigorous exercise program (31). Thus, we showed that a substantial loss of FFM is not an obligatory consequence of massive weight loss.
However, despite the relative preservation of FFM, the RMR decreased by 789 ± 483 kcal/d at the end of the study, which was 504 ± 171 kcal/d greater than accounted for by the change of body weight and composition. This metabolic adaptation to the weight loss intervention was also significant at wk 6 but doubled by the end of the competition. Therefore, we showed that a drop in resting metabolism during active weight loss of this magnitude probably cannot be avoided by the addition of an exercise program.
While participants resided at the ranch, exercise was monitored and consisted of a minimum of 2 h/d for all individuals. This amount of vigorous physical activity, with both aerobic and resistance training, resulted in a substantial increase in total daily energy expenditure in the 11 participants who were tested at wk 6. This large increase in TEE, in the face of a metabolic adaptation in resting metabolism, confirms the high physical activity levels in these subjects. Our data show that physical activity dropped slightly but nonsignificantly between wk 6 and 30, suggesting that the high levels of physical activity were largely maintained, even after the participants were sent home. Furthermore, FFM continued to be markedly conserved compared with the loss of fat.
The causes for the metabolic adaptation to weight loss are still unclear. Although metabolic adaptation acts to decrease the rate of weight loss, it was the subjects with the greatest weight loss who had the greatest metabolic adaptation. This suggests that the magnitude of the intervention plays a role in determining both the degree of weight loss as well as the metabolic response acting to counter weight loss. Mechanistically, the decline in circulating leptin and thyroid hormones may contribute to the metabolic adaptation, with a consequent blunting of sympathetic nervous activity (14, 16, 32, 33). Whereas we found that leptin decreased dramatically with weight loss, neither the degree of weight loss nor metabolic adaptation was directly associated with the change in leptin concentration.
Because TSH and T3 were both associated with greater weight loss, this supports the role of thyroid suppression in metabolic adaptation. On average, T3 levels decreased, while TSH and T4 levels were not significantly changed after weight loss. The subjects who had the largest increase in TSH had the least reduction of T3, suggesting that the thyroid axis was acting to counter alterations in peripheral thyroid metabolism, but this response was insufficient to preserve T3 levels. Surprisingly, the magnitude of metabolic adaptation was not significantly correlated with circulating T3 changes but was associated with the change in TSH such that those with the greatest increase in TSH had the least metabolic adaptation. These results suggest that metabolic adaptation may be centrally mediated with a parallel action on the hypothalamic-pituitary-thyroid axis.
It is also possible that a disproportionate mass reduction of high metabolic rate organs may have contributed to the observed metabolic adaptation. The average specific metabolic rate of high metabolic rate tissues is approximately 240 kcal/kg·d, whereas for slow rate tissues, it is between 4 and 15 kcal/kg·d (6). However, to explain the wk 30 metabolic adaptation of about −500 kcal/d, considering the observed decrease in FFM of about −10 kg, the mass of high metabolic rate tissues would have to decrease more than 1.5 kg (see calculation in the Appendix). Given that the total mass of these tissues (brain, liver, heart, kidneys) is approximately 4 kg, this would represent an unrealistically large relative decrease in the mass of high metabolic rate tissues. Thus, a disproportionate loss of metabolically active tissues is unlikely to fully explain the observed metabolic adaptation.
Adiponectin is known to reduce hepatic glucose output, increase fatty acid oxidation, and activate cellular energy sensing pathways via AMP-activated protein kinase, leading to improved insulin sensitivity (35). Intracerebroventricular administration of adiponectin also decreases body weight and fat mass through increased energy expenditure (36), possibly through the activation of AMP-activated protein kinase (37). Adiponectin increased 2-fold in our study and was associated with weight and fat mass loss but also with lowered resting metabolism. It is impossible to know from this study whether the changes in adiponectin had an independent effect on weight loss or RMR or was merely a reflection of weight loss magnitude.
Limitations of this study include the lack of experimental control group throughout the competition. We can assume that the degree of energy deficit was different among subjects as was the amount and type of exercise and calorie restriction. Therefore, we cannot make claims regarding the relative effects of the exercise per se on the weight loss and body composition changes. Additionally, the measurements at wk 6 and 30 were conducted while the subjects were engaged in active weight loss and were in varying degrees of energy deficit. Although the ongoing weight loss may have contributed to the very large reduction of the RMR, recent evidence suggests that at least part of the metabolic adaptation (15) and hormonal changes (38) persist over prolonged periods at a reduced body weight.
In conclusion, our study shows that participants in this competition experienced a relative preservation of FFM. Unfortunately, FFM preservation did not prevent the slowing of metabolic rate during active weight loss, which may predispose to weight regain unless the participants maintain high levels of physical activity or significant caloric restriction.
Acknowledgments
This work was supported by the Intramural Research Program of the National Institutes of Health, National Institute of Diabetes and Digestive and Kidney Diseases (to N.D.K. and K.D.H.), the Nutrition and Obesity Research Center Grant P30 DK072476 (Pennington Biomedical Research Center), and K01DK89005 (to D.L.J.).
Disclosure Summary: The authors declare no conflicts of interest.
D.L.J. and N.D.K. contributed equally to the research and manuscript.
Appendix
The metabolic rate of the FFM as a whole is γFFM of approximately 19 kcal/kg·d from our baseline RMR prediction equation and also agrees with other RMR prediction models (34). In contrast, γH is approximately 240 kcal/kg·d and γS is between 4 and 15 kcal/kg·d (6). Thus, to explain our data indicating a residual RMR of about −500 kcal·d for a ΔFFM of about −10 kg, high metabolic rate organs would have to decrease by more than 1.5 kg. Given that the total mass of these organs is likely less than about 4 kg (corresponding to the sum of brain, liver, heart, and kidneys), this would represent a very large relative decrease in the mass of high metabolic rate organs, especially considering that the brain alone represents approximately 1.3 kg of the total H and its mass is thought to be preserved with weight loss. Thus, a disproportionate decrease of high metabolic rate organs is unlikely to fully explain the observed metabolic adaptation.
Abbreviations
- BMI
Body mass index
- FFM
fat-free mass
- FM
fat mass
- HOMA-IR
homeostasis model assessment of insulin resistance
- NREE
nonresting energy expenditure
- RMR
resting metabolic rate
- RQ
respiratory quotient
- TAG
triacylglycerol.
References
