


Abstract
The detailed role of FSH in contributing to male testicular function and fertility has been debated. We have previously identified the association between the T-allele of the FSHB promoter polymorphism (rs10835638; G/T, −211 bp from the mRNA start) and significantly reduced male serum FSH.
In the current study, the T-allele carriers of the FSHB −211 G/T single nucleotide polymorphism represented a natural model for documenting downstream phenotypic consequences of insufficient FSH action.
We genotyped rs10835638 in the population-based Baltic cohort of young men (n = 1054; GG carriers, n = 796; GT carriers, n = 244; TT carriers, n = 14) recruited by Andrology Centres in Tartu, Estonia; Riga, Latvia; and Kaunas, Lithuania. Marker-trait association testing was performed using linear regression (additive, recessive models) adjusted by age, body mass index, smoking, and recruitment center.
Serum hormones directly correlated with the T-allele dosage of rs10835638 included FSH (additive model, P = 1.11 × 10⁻⁶; T-allele effect, −0.41 IU/liter), inhibin-B (P = 2.16 × 10⁻³; T-allele effect, −14.67 pg/ml), and total testosterone (P = 9.30 × 10⁻³; T-allele effect, −1.46 nmol/liter). Parameters altered only among TT homozygotes were reduced testicular volume (recessive model, P = 1.19 × 10⁻⁴; TT genotype effect, −9.47 ml) and increased serum LH (P = 2.25 × 10⁻²; TT genotype effect, 1.07 IU/liter). The carrier status of rs10835638 alternative genotypes did not affect sperm motility and morphology, calculated free testosterone, serum SHBG, and estradiol concentrations.
We showed for the first time that genetically determined low FSH may have wider downstream effects on the male reproductive system, including impaired testes development, altered testicular hormone levels (inhibin-B, total testosterone, LH), and affected male reproductive potential.
More than 1000 genes have been shown to contribute to the regulation of male reproductive potential (1). A significant proportion of genetic variants are rare loss-of-function single-gene mutations or chromosomal abnormalities causing varying degrees of impaired spermatogenesis. Furthermore, polymorphisms located in regulatory regions responsible for the expression of genes involved in the reproductive endocrine system could affect the quality of spermatogenesis and success in conceiving a child.
Recently, a promoter polymorphism (rs10835638; G/T, −211 bp from the mRNA transcription start site) in the FSHB gene was shown to act as a major genetic determinant of the serum FSH levels in men (2, 3). FSH has a significant role in activating the proliferation of Sertoli cells during the male fetal and neonatal development, as well as inducing mitotic activity of spermatogonia in the pubertal phase (4). In adult men, FSH is positively associated with spermatogenesis (5). The identified polymorphism is located within a conserved progesterone-response element capable of binding a progesterone receptor and is involved in regulating the FSHB gene expression (2, 6, 7). Functional studies conducted with ovine Fshb 5′-flanking region showed that the progesterone-response element located between −212 and −197 enhances the gene transcription up to 9-fold, and the conserved G nucleotide at the position −211 is one of the critical positions for the proper functioning of this element (6). Functionally, the two FSHB −211 G/T-alleles exhibit a differential effect on gene expression (7). The relative activity of the proximal promoter carrying the T-allele was only 46–58%, compared with the wild-type promoter variant with the G-allele (7). The T-allele of rs10835638 exhibited highly significant association with reduced serum FSH in Estonian studies of young men and male partners of infertile couples (2, 3). The median serum FSH of TT carriers was 48.5% of the level determined for the GG carriers (3). Because circulating FSH concentration in serum has been shown to correlate highly with intrapituitary levels of FSHB transcripts (8), the reduced serum FSH in the T-allele carriers is most likely caused by an impaired expression of the FSHB gene. The identification of a significant excess of TT homozygotes (2.4 vs. 1.1%) and GT heterozygotes (25.1 vs. 22.4%) among Estonian infertile men compared with the young male cohort (P < 0.05) could suggest a contribution of this genetic variant to male factor infertility (3).
The current study aimed to test the effect of the FSHB −211 G/T alternative genotypes on a broader range of male reproductive parameters using a large Baltic male cohort (n = 1054). The role of FSH in contributing to human testicular function, spermatogenesis, and fertility has been discussed for decades (5, 9), and the interpretation of available clinical data about human patients with altered FSH action has not been straightforward. This study confirmed robustly the association of the FSHB −211 G/T single nucleotide polymorphism (SNP) with serum FSH level and highlighted for the first time that genetically determined low FSH may have wider direct and indirect downstream effects on the male reproductive system, including impaired testes development, altered testicular hormone levels (inhibin-B, total testosterone, LH), and affected male reproductive potential.
Subjects and Methods
Subjects
The Baltic cohort of young men was recruited between May 2003 and June 2004 among the participants in a prospective study Environment and Reproductive Health (European Union Sixth Framework project QLRT-2001-02911) in parallel at the three study centers (Tartu, Estonia; Riga, Latvia; Kaunas, Lithuania). The study was approved by the Ethics Committee of Human Research of the University Clinic of Tartu, Estonia (27.01.2003), the Ethics Committee of Riga Stradins University, Latvia (23.04.2003), and the Regional Ethics Committee of Kaunas, Lithuania (approval no.13, 2003). Detailed principles of the study group formation have been described in detail previously (10). The recruitment and phenotyping protocols of the study subjects at the participating centers were identical. Study participation was voluntary, and written informed consent was obtained from all subjects. Young men were recruited to the study at the Centre of Andrology, University Clinic of Tartu, Estonia (n = 578; all born and living in Estonia); at the Riga Family and Sexual Problems Centre, Latvia (n = 300; all born and living in Latvia); and at the specialized laboratory of the Institute of Endocrinology, Kaunas University of Medicine (n = 326; all born and living in Lithuania). In the current project, 150 subjects were excluded (cryptorchidism, n = 13; abuse of anabolic steroids, n = 1; orchitis with unilateral testis damage, n = 1; incomplete data, n = 15; and unavailable DNA sample, n = 120). The final number of analyzed subjects was 1054 (Table 1).
General characteristics of the study cohort of Baltic young men (n = 1054)
| General characteristics | Median (25th–75th %ile) |
|---|---|
| Age (yr) | 19.8 (18.5–21.4) |
| BMI (kg/m2) | 22.1 (20.7–23.5) |
| Ejaculation abstinence period (h) | 87.0 (63.0–135.0) |
| Total testes volume (ml) | 50.0 (42.0–55.0) |
| General characteristics | Median (25th–75th %ile) |
|---|---|
| Age (yr) | 19.8 (18.5–21.4) |
| BMI (kg/m2) | 22.1 (20.7–23.5) |
| Ejaculation abstinence period (h) | 87.0 (63.0–135.0) |
| Total testes volume (ml) | 50.0 (42.0–55.0) |
Laboratory procedures
Blood was drawn from the cubital vein between 0800 and 1300 h (median, 1100 h). Serum was extracted and stored at −80 C until it was sent frozen to the University Department of Growth and Reproduction in Copenhagen, Rigshospitalet, Denmark, for analysis. Serum levels of FSH and LH were determined using a time-resolved immunofluorometric assay (Delfia; Wallac, Turku, Finland). Total testosterone levels were determined using a time-resolved fluoroimmunoassay (Delfia; Wallac), estradiol by RIA (Pantex, Santa Monica, CA), and inhibin-B by a specific two-sided enzyme immunometric assay (Serotec, Oxford, UK). All hormone assessments were done at the end of the study to reduce the influence of interassay variations. The intra- and interassay coefficients of variation (CV) for measurement of both FSH and LH were 3 and 4.5%, respectively. CV for both total testosterone and SHBG were less than 8% and less than 5%, respectively; and CV for estradiol and inhibin-B were 7.5 and 13%, and 15 and 18%, respectively. Free testosterone levels were calculated from measured total testosterone, SHBG, and fixed albumin levels (43 g/liter) using the Vermeulen's equation (11).
Semen samples were obtained by masturbation and ejaculated into a collection tube in the privacy of a room near the laboratory. After ejaculation, the semen was incubated at 37 C for 30–40 min for liquefaction. Semen analysis was performed as recently described (10, 12). Semen volume was estimated by weighing the collection tube with the semen sample and subsequently subtracting the predetermined weight of the empty tube, assuming 1 g = 1 ml. The motility assessment was performed in duplicate, and the average value was calculated for both samples. For assessment of the sperm concentration, the samples were diluted in a solution of 0.6 mol/liter NaHCO3 and 0.4% (vol/vol) formaldehyde in distilled water. The sperm concentration was assessed using the improved Neubauer hemocytometers.
Physical examination for the assessment of genital pathology and testicular size was performed with the men in the standing position. If necessary, pathologies were clarified further with the men in the supine position. The orchidometer (made of birch wood; Pharmacia & Upjohn, Copenhagen, Denmark) was used for assessment of testicular size. Participants of the study were examined by one (J.E., Riga) or two (M.P. and K.A., Tartu; V.M. and B.Z., Kaunas) investigators who had passed special training for standardization of the clinical examination immediately before the study. The total testes volume is the sum of the volume of right and left testicles.
Genotyping of the FSHB promoter polymorphism (rs10835638; −211 G/T from mRNA start site) was performed according to the established protocol using the restriction fragment length polymorphism method (2). The PCR primers and conditions (forward/reverse primers: 5′-GGAGCCAGATCATGAAATGTT-3′/5′-GACCAATGCTAGCCTGAAGC-3′) and the choice of the restriction enzyme (TatI; Fermentas, Vilnius, Lithuania) for the G-allele-specific cutting of the PCR product was identical to the seminal study. The uncut PCR product (364 bp) representing the T-allele was separated from the restricted fragments (233 and 131 bp) resulting from the G-allele using electrophoreses in 2% agarose gel and 0.5X TBE buffer. On each analyzed gel were loaded positive control samples representing GG, GT, and TT individuals, whose rs10835638 genotype had been confirmed by sequencing.
Statistical analysis
The men were stratified into three groups according to their FSHB rs10835638 (−211 G/T) genotype. Deviation from Hardy-Weinberg equilibrium was tested by χ2 analysis using the program DeFinetti (http://ihg2.helmholtz-muenchen.de/cgi-bin/hw/hwa1.pl). Calculations of descriptive statistics and confounder-adjusted parameters (see Supplemental Data, published on The Endocrine Society's Journals Online web site at http://jcem.endojournals.org) were performed using PASW software Grad Pack 18.0 (SPSS Inc., Chicago, IL). For the descriptive statistics, mean, sd, median, and 25th-75th percentiles were calculated for the main outcome variables (hormone, semen variables, and testes volume). Linear regressions were performed on natural logarithmic-transformed outcome variables to provide expected values of the outcome variables adjusted for covariates [age, body mass index (BMI), ejaculation abstinence period, blood sampling hour, smoking status, center of recruitment, and ejaculation-to-analysis delay]. For the reproductive hormones, the linear regression model was adjusted to give the expected values for a 20-yr-old man from Estonia, nonsmoker, having a BMI of 22 kg/m2 and blood drawn at 0800 h. For the semen variables, the expected values were assessed to represent a 20-yr-old man from Estonia, nonsmoker, having an ejaculation abstinence period of 96 h. For calculations of progressive motile (AB-motile) and motile (ABC-motile) spermatozoa, the model was additionally corrected to having the motility assessed 30 min after ejaculation because a longer period was correlated with a decrease in motility. Total testes volume and sperm morphology were adjusted to represent a 20-yr-old Estonian man.
Genetic associations between the FSHB rs10835638 SNP and male reproductive parameters were tested using PLINK version 1.07 (http://pngu.mgh.harvard.edu/purcell/plink/) (13). Natural log-transformation was used to obtain an approximate normal distribution of values. Marker-trait association testing was performed using linear regression additive and recessive models, adjusting for covariates as stated above. Statistically significant associations were considered P < 2.5 × 10⁻², representing a correction for two models tested for each parameter. The stringent Bonferroni threshold for multiple testing correction was calculated as α = 0.05/(2 × N) = 2.27 × 10⁻³, where N = 11 represents the number of independent measurements.
Results
The population-based Baltic cohort of young men (n = 1054; median age (25th-75th percentile), 19.8 (18.5–21.4) yr; Table 1) was genotyped for the −211 G/T SNP (rs10835638) located in the FSHB gene promoter. The allele (T-allele 12.9%) and genotype frequencies (TT and GT carriers, 1.3 and 23.1%, respectively) were consistent with Hardy-Weinberg equilibrium (P = 0.41).
Stratification of the study sample based on the genotypes of the rs10835638 distinguished three categories of reproductive parameters in respect to the effect of the FSHB promoter −211 G/T SNP (Table 2 and Fig. 1). The first group consisted of parameters showing a gradient from the lowest measurements among TT-genotype carriers to the highest level in the GG group (TT<GT<GG). The dosage of the T-allele was robustly associated with reduced serum FSH level (linear regression additive model, P = 1.11 × 10⁻⁶), followed by the association with decreased serum inhibin-B (P = 2.16 × 10⁻³). Both associations were resistant to stringent Bonferroni correction for multiple testing. Compared with the GG-homozygote group (adjusted median, 2.3 IU/liter), the GT-heterozygote (2.0 IU/liter), and TT-homozygote (1.8 IU/liter) men had approximately 13 and 22% reduced FSH levels, respectively. Serum inhibin-B levels in TT-homozygotes (adjusted median, 142 pg/ml) and GT-heterozygotes (172 pg/ml) were 4.5 and 21% lower than among GG-homozygotes (180 pg/ml), respectively. The inhibin-B/FSH ratio was not affected by the carrier status of rs10835638, indicating that the decrease in both hormone levels is in high correlation. Statistically significant associations were also detected between T-allele carrier status and reduced total serum testosterone (TT group, 23 nmol/liter; vs. GT group, 24 nmol/liter; vs. GG group, 25 nmol/liter; P = 9.30 × 10⁻³), testosterone/LH ratio (P = 1.24 × 10⁻³), and testosterone/estradiol ratio (P = 6.02 × 10⁻³).
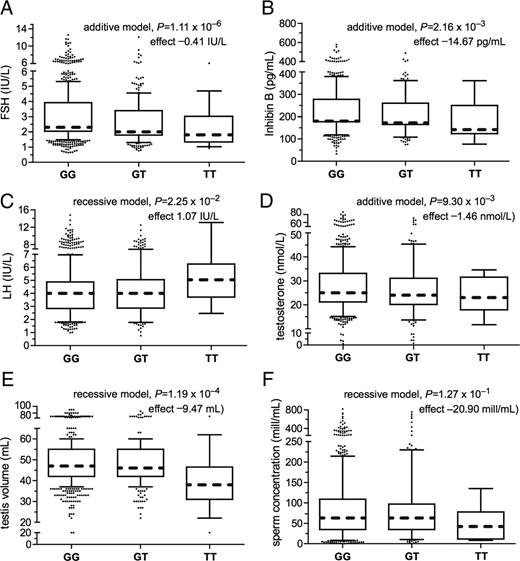
Box-and-whisker diagrams for the distribution of serum FSH (A), inhibin-B (B), LH (C), total testosterone (D), testis volume (E), and sperm concentration (F) in the Baltic young men cohort subgrouped according to their FSHB promoter SNP rs10835638 genotype (GG, n = 796; GT, n = 244; TT, n = 14). The boxes represent the 25th and 75th percentiles; the whiskers cover the 5th to 95th percentiles of the raw data. Circles represent the outlier values. The confounder adjusted median value is denoted as the dotted line that bisects the boxes. For each boxplot, P value of multiple linear regression (additive or recessive genetic model) and effect size (β) of the FSHB rs10835638 T-allele or T-allele homozygosity are shown.
Male reproductive parameters in the Baltic young men cohort stratified by the FSHB rs10835638 (−211 G/T) genotype
| Parameter | TT-genotype | GT-genotype | GG-genotype | Additive modela | Recessive modela | ||
|---|---|---|---|---|---|---|---|
| P value | T-allele effect | P value | T-allele effect | ||||
| No. of men | 14 | 244 | 796 | ||||
| Sertoli cell function, semen quantity, and quality | |||||||
| FSH (IU/liter)b | |||||||
| Mean (sd) | 2.4 (1.3) | 2.7 (1.5) | 3.2 (1.7) | ||||
| Median (25–75%) | 2.4 (1.3–3.0) | 2.3 (1.8–3.4) | 2.9 (2.0–3.9) | ||||
| Adjusted median (95% CI) | 1.8 (1.3–2.4) | 2.0 (1.7–2.3) | 2.3 (2.0–2.7) | 1.11 × 10⁻⁶ | −0.41 | 7.08 × 10⁻² | −0.59 |
| Inhibin-B (pg/ml)b | |||||||
| Mean (sd) | 185 (161) | 219 (76) | 232 (78) | ||||
| Median (25–75%) | 161 (124–250) | 209 (165–260) | 224 (177–277) | ||||
| Adjusted median (95% CI) | 142 (115–174) | 172 (155–191) | 180 (163–199) | 2.16 × 10⁻³ | −14.67 | 1.30 × 10⁻² | −44.75 |
| Inhibin-B/FSH | |||||||
| Mean (sd) | 107 (81) | 107 (72) | 99 (80) | ||||
| Median (25–75%) | 80 (35–165) | 93 (52–144) | 77 (48–127) | ||||
| Adjusted median (95% CI) | 80 (52–123) | 87 (70–108) | 77 (62–85) | 6.87 × 10⁻² | 7.14 | 9.64 × 10⁻¹ | 0.69 |
| Total testes volume (ml)d | |||||||
| Mean (sd) | 40 (13) | 49 (10) | 49 (10) | ||||
| Median (25–75%) | 41 (31–47) | 50 (42–55) | 50 (42–55) | ||||
| Adjusted median (95% CI) | 38 (33–42) | 46 (44–49) | 47 (45–49) | 1.47 × 10⁻² | −1.64 | 1.19 × 10⁻⁴ | −9.47 |
| Total sperm count per ejaculate (million)c | |||||||
| Mean (sd) | 250 (223) | 259 (255) | 278 (283) | ||||
| Median (25–75%) | 185 (46–459) | 194 (105–324) | 213 (103–363) | ||||
| Adjusted median (95% CI) | 162 (93–282) | 222 (188–261) | 216 (193–242) | 5.41 × 10⁻¹ | −12.54 | 5.46 × 10⁻¹ | −44.86 |
| Sperm concentration (million/ml)c | |||||||
| Mean (sd) | 54 (41) | 79 (80) | 83 (72) | ||||
| Median (25–75%) | 52 (1178) | 61 (35–97) | 65 (35–109) | ||||
| Adjusted median (95% CI) | 42 (25–69) | 63 (55–73) | 63 (57–70) | 3.14 × 10⁻¹ | −4.11 | 1.27 × 10⁻¹ | −20.90 |
| Semen volume (ml)c | |||||||
| Mean (sd) | 4.2 (1.8) | 3.4 (1.6) | 3.5 (1.6) | ||||
| Median (25–75%) | 4.3 (2.1–5.7) | 3.3 (2.3–4.4) | 3.2 (2.2–4.5) | ||||
| Adjusted median (95% CI) | 3.9 (3.0–5.0) | 3.5 (3.2–3.7) | 3.4 (3.2–3.6) | 6.35 × 10⁻¹ | 0.05 | 2.60 × 10⁻¹ | 0.52 |
| Morphologically normal (%)d | |||||||
| Mean (sd) | 10.4 (3.9) | 12.2 (4.79) | 11.6 (4.9) | ||||
| Median (25–75%) | 10.5 (7.0–13.3) | 12.0 (8.3–16.0) | 12.0 (8.0–15.0) | ||||
| Adjusted median (95% CI) | 9.0 (6.8–12.1) | 10.5 (9.4–11.7) | 9.8 (8.9–10.9) | 2.41 × 10⁻¹ | 0.45 | 5.13 × 10⁻¹ | −0.94 |
| AB motile (%)c | |||||||
| Mean (sd) | 59 (9) | 58 (14) | 56 (14) | ||||
| Median (25–75%) | 59 (53–66) | 59 (50–66) | 58 (49–66) | ||||
| Adjusted median (95% CI) | 55 (46–65) | 54 (49–59) | 51 (47–56) | 4.1 × 10⁻² | 2.23 | 5.00 × 10⁻¹ | 3.00 |
| ABC motile (%)c | |||||||
| Mean (sd) | 73 (7) | 72 (11) | 71 (12) | ||||
| Median (25–75%) | 73 (67–79) | 73 (65–81) | 73 (64–80) | ||||
| Adjusted median (95% CI) | 69 (62–78) | 68 (64–72) | 67 (63–71) | 2.19 × 10⁻¹ | 1.14 | 5.36 × 10⁻¹ | 2.32 |
| Leydig cell function | |||||||
| LH (IU/liter)b | |||||||
| Mean (sd) | 5.2 (2.4) | 4.1 (1.6) | 4.0 (1.7) | ||||
| Median (25–75%) | 4.3 (3.6–6.3) | 3.8 (2.9–5.1) | 3.8 (2.8–4.9) | ||||
| Adjusted median (95% CI) | 5.0 (4.0–6.4) | 4.0 (3.5–4.5) | 4.0 (3.5–4.5) | 1.57 × 10⁻¹ | 0.15 | 2.25 × 10⁻² | 1.07 |
| Total testosterone (nmol/liter)b | |||||||
| Mean (sd) | 25 (8) | 26 (9) | 28 (9) | ||||
| Median (25–75%) | 27 (18–32) | 25 (20–31) | 27 (21–33) | ||||
| Adjusted median (95% CI) | 23 (19–27) | 24 (21–26) | 25 (23–28) | 9.30 × 10⁻³ | −1.46 | 3.75 × 10⁻¹ | −2.02 |
| Testosterone/LH | |||||||
| Mean (sd) | 5.5 (2.7) | 7.3 (3.3) | 7.9 (3.8) | ||||
| Median (25–75%) | 5.1 (3.2–6.5) | 6.7 (5.9–8.7) | 7.2 (5.3–9.8) | ||||
| Adjusted median (95% CI) | 4.5 (3.4–5.8) | 6.0 (5.2–6.8) | 6.4 (5.6–7.2) | 1.24 × 10⁻³ | −0.64 | 5.88 × 10⁻³ | −1.98 |
| Free testosterone (%) | |||||||
| Mean (sd) | 2.26 (0.53) | 2.30 (0.41) | 2.32 (0.42) | ||||
| Median (25–75%) | 2.18 (1.86–2.68) | 2.32 (2.03–2.58) | 2.34 (2.02–2.59) | ||||
| Adjusted median (95% CI) | 2.25 (2.02–2.51) | 2.27 (2.15–2.40) | 2.30 (2.18–2.43) | 3.34 × 10⁻¹ | −0.03 | 7.86 × 10⁻¹ | −0.03 |
| Estradiol (pmol/liter)b | |||||||
| Mean (sd) | 102 (33) | 93 (25) | 95 (25) | ||||
| Median (25–75%) | 105 (70–129) | 90 (77–107) | 91 (78–108) | ||||
| Adjusted median (95% CI) | 84 (72–97) | 76 (71–82) | 78 (73–84) | 8.19 × 10⁻¹ | −0.35 | 2.66 × 10⁻¹ | 7.20 |
| Testosterone/estradiol | |||||||
| Mean (sd) | 0.25 (0.04) | 0.29 (0.08) | 0.30 (0.09) | ||||
| Median (25–75%) | 0.25 (0.20–0.28) | 0.28 (0.23–0.34) | 0.29 (0.24–0.35) | ||||
| Adjusted median (95% CI) | 0.27 (0.23–0.32) | 0.31 (0.28–0.34) | 0.32 (0.30–0.35) | 6.02 × 10⁻³ | −0.01 | 4.63 × 10⁻² | −0.04 |
| SHBG (nmol/liter)b | |||||||
| Mean (sd) | 35 (16) | 35 (16) | 34 (13) | ||||
| Median (25–75%) | 32 (26–49) | 31 (25–41) | 32 (25–42) | ||||
| Adjusted median (95% CI) | 30 (24–37) | 31 (28–35) | 31 (28–34) | 9.55 × 10⁻¹ | −0.05 | 9.13 × 10⁻¹ | −0.36 |
CI, Confidence interval.
Marker-trait association testing was performed using linear regression (additive, recessive models) with the adjustment for age, BMI, smoking status, and recruitment center. Hormone measurements were additionally corrected for blood sampling hour, and semen parameters were corrected for ejaculation abstinence period. Statistically significant associations after correction for two applied models (P < 2.5 × 10⁻²) are indicated in bold, and P values remaining significant (P < 2.27 × 10⁻³) after further correction for the number of measurements (n = 11) are underlined. T-allele effect is shown as the estimated linear regression statistic β.
Hormonal parameters were adjusted to represent a 20-yr-old nonsmoker (BMI = 22 kg/m2) from Estonia, whose blood sample was taken at 0800 h.
Semen parameters were adjusted to represent a 20-yr-old nonsmoker from Estonia with ejaculation abstinence period of 96 h; for calculations of progressive motile (AB-motile) and motile (ABC-motile) spermatozoa, additional correction was applied to correspond to the motility assessed 30 min after ejaculation.
Total testes volume and sperm morphology were adjusted to represent a 20-yr-old man from Estonia.
The values of the second group of parameters were affected only among the T-allele homozygotes (Table 2 and Fig. 1). First, the strongest association (resistant to Bonferroni correction) was identified with reduced testes volume in the TT group (linear regression, recessive model, P = 1.19 × 10⁻⁴). TT-homozygotes (adjusted median, 38 ml) had an approximately 20% lower total testes volume than GG-homozygotes (47 ml) and GT-heterozygotes (46 ml), respectively. Second, compared with GG- and GT-genotype carriers, the TT subjects had a statistically significant increase in serum LH (adjusted median, 5.0 vs. 4.0 IU/liter; P = 2.25 × 10⁻²). In addition, a nonsignificant trend of higher semen volume (3.9 vs. 3.4–3.5 ml; P = 2.60 × 10⁻¹) but lower sperm concentration (42 vs. 63 million/ml; P = 1.27 × 10⁻¹) and total sperm count per ejaculate (162 million vs. 220 million; P = 5.46 × 10⁻¹) was observed among TT subjects.
Reproductive parameters unaffected by the carrier status of the FSHB −211 G/T SNP included sperm motility and morphology, calculated free testosterone, and serum SHBG and estradiol concentrations (Table 2).
Discussion
Our studies in Estonian men had shown a strong association between the T-allele of the FSHB gene promoter polymorphism (rs10835638; G/T; −211 bp from transcription start site) and reduced serum FSH (2, 3). Furthermore, the seminal studies had suggested that the carrier status of rs10835638 T-allele might also affect other markers of male reproductive function (e.g. testicular size) (3). The current study set forward to corroborate or refute the identified genetic association in a large cohort of Baltic young men and to possibly gain novel insights into direct and indirect effects of FSH in regulating male reproductive potential. We confirmed robustly the association of the FSHB −211 G/T SNP with serum FSH level. In the Baltic young men cohort, the level of circulating FSH in TT-homozygotes and GT-heterozygotes compared with GG-homozygotes was 78 and 87%, respectively (P < 5 × 10⁻⁶; Table 2). To date, this is the only identified genetic variant with direct major effect on serum FSH concentrations in men. The association in women remains to be tested. The significance of our finding arises from the fact that in contrast to the conclusive differential contribution of the two FSH receptor (FSHR) isoforms (Thr307/Asn680; Ala307/Ser680) in determination of serum FSH level in women, the FSHR polymorphism has been found to correlate neither with male FSH nor with any male reproductive parameters (14).
Although there is a general agreement that FSH is essential for quantitatively normal spermatogenesis and male reproduction, the detailed role of FSH in contributing to human testicular function, spermatogenesis, and fertility has been debated and requires further specification (5, 9). In our study, the carriers of the T-allele of the FSHB −211 G/T SNP represent a natural model for documenting the phenotypic consequences of insufficient FSH action due to genetically inherited constitutively reduced hormone levels. The data of the current study grouped the investigated male reproductive parameters into three categories: 1) sensitive to T-allele dosage (significant reduction in serum FSH, total testosterone, inhibin-B); 2) affected only among TT-homozygotes and most probably involving compensatory mechanisms to maintain wild-type levels in GT carriers (significantly decreased testes volume and increased serum LH; trend for lower sperm concentration); and 3) not affected by constitutively reduced FSH levels (serum SHBG and estradiol, sperm motility, and morphology). We propose that these observations may reflect not only the short-term effect of reduced circulating FSH on reproductive physiology of adult men, but also the past long-term effects of altered FSH concentration on developing gonads and on early reprogramming of hormonal balance due to shared regulatory and feedback loops with FSH (8, 15). During fetal, neonatal, and pubertal development, FSH activates the mitotic proliferation of the Sertoli and germ cells, and in the pubertal phase, FSH induces mitotic activity of the spermatogonia and regulates spermatogonial survival (16, 17). Because testicular seminiferous tubules consist mainly of the Sertoli cells and differentiating germ cell population, understimulated proliferation by low FSH in developmental stages may lead to reduced testis volume in adulthood. The Baltic men homozygous for the FSHB −211 T-allele (associated with lower FSH) had approximately 20% smaller testes size than G-allele carriers (P < 5 × 10⁻⁴). Similarly, the suppression of FSH levels during the development in rat was reported to result in reduced numbers of Sertoli cells and smaller testicular size, and this effect was reversed by administration of FSH (18, 19).
Inhibin-B represents a unique testicular product responsive to FSH stimulation. The declining gradient of serum inhibin-B levels in the men stratified by the FSHB −211 G/T genotype (P < 5 × 10⁻³) may reflect affected stimulation of inhibin-B secretion due to reduced circulating FSH levels combined with the effect of a lower number of Sertoli cells due to disturbed proliferation in development. The estimated unaltered inhibin-B/FSH ratio in men with genetically decreased levels of FSH is a biologically important finding. This indicates that the main effect is hypothalamic/pituitary (secreting FSH), and the reduced semen quality reflects a lack of stimulation rather than a primary failure of testicular function itself. The finite size of the Sertoli cell population is closely correlated to the capacity of the testis for sperm production (20).
Recently, the role of FSH in the regulation of apoptotic pathways during spermatogenesis supporting survival of spermatogonia and sperm release in adult men was shown (4, 17). Genetically determined lower FSH in developmental stages may also lead to reprogramming of various complex downstream networks of paracrine and endocrine interactions. For example, in addition to the direct effect of FSH on the actions of Sertoli cells expressing FSH receptor, FSH has been shown to indirectly affect androgen-producing Leydig cell function (21, 22). FSH-stimulated Sertoli cells produce various factors (e.g. cytokines, steroids, growth factors) that contribute to the induction of Leydig cell differentiation during fetal development and further functional maturation in puberty (23, 24). Elevated serum LH and lower testosterone levels observed among the TT subjects of the FSHB −211 G/T SNP may refer to reduced LH responsiveness and impaired steroidogenic activity of the Leydig cells due to understimulation of differentiation during fetal development (25, 26).
Our previous study showed an enrichment of infertile men among the TT-genotype carriers (3). An independent case report has described a 19-yr-old infertile male with normal virilization, azoospermia, and isolated FSH deficiency, who was homozygous for the T-allele of the FSHB −211 G/T polymorphism (27). The data of the current study extended the understanding of the consequence of insufficient FSH stimulation and showed that it affects almost a broad range of male reproductive parameters. We speculate that the men with TT-genotype may form a risk group not only for subfertility, but also for the development of testicular dysgenesis syndrome, suggested to result from the disruption of embryonal programming and gonadal development during fetal life (28).
In conclusion, the current study in a large Baltic male cohort confirmed robustly the association of the FSHB −211 G/T SNP and male serum FSH concentration. For the first time, significant direct and indirect effects of inherited reduced FSH levels on male reproductive parameters, physiology, and potential were shown.
Abbreviations:
Acknowledgments
We thank the participants of the study. Solveiga Hlevicka, Helle-Mai Tabo, Kairi Pramann, Kadri Poolak, and Nijole Sabeckiene are acknowledged for technical assistance. Reedik Mägi is thanked for computational assistance.
The recruitment of the Baltic male cohort was financed by European Union Sixth Framework project QLRT-2001-02911. The genetic research has been financed by the following grants to M.L. and her research group: Howard Hughes Medical Institute International Scholarship Grant 55005617, Estonian Science Foundation Grant 7471, Wellcome Trust International Senior Research Fellowship (070191/Z/03/A) in Biomedical Science in Central Europe, and Estonian Ministry of Education and Science (Core Grant 0182721s06). N.J. received support from the Danish Agency for Science, Technology, and Innovation (Grant 271070678). M.G. was the recipient of personal travel scholarship provided by European Commission Grant 205419 (ECOGENE), Estonian Biocenter.
M.L., M.G., and M.P. designed the overall study. M.P., B.Z., J.E., and N.J. oversaw the sample recruitment and supervised all clinical aspects; K.A., V.M., and I.T. contributed in sample recruitment and phenotyping. M.L. supervised and M.G. performed the laboratory work. M.L., M.G., M.P., and N.J. designed the data analysis and jointly interpreted the results. M.G. and N.J. conducted the statistical analysis of the data. M.L. and M.G. drafted the manuscript; all authors have approved the final version of the manuscript.
Disclosure Summary: The authors have nothing to disclose.
References
