


Objective: We set out to develop a molecular test that distinguishes benign and malignant thyroid nodules using fine-needle aspirates (FNA).
Design: We used mRNA expression analysis to measure more than 247,186 transcripts in 315 thyroid nodules, comprising multiple subtypes. The data set consisted of 178 retrospective surgical tissues and 137 prospectively collected FNA samples. Two classifiers were trained separately on surgical tissues and FNAs. The performance was evaluated using an independent set of 48 prospective FNA samples, which included 50% with indeterminate cytopathology.
Results: Performance of the tissue-trained classifier was markedly lower in FNAs than in tissue. Exploratory analysis pointed to differences in cellular heterogeneity between tissues and FNAs as the likely cause. The classifier trained on FNA samples resulted in increased performance, estimated using both 30-fold cross-validation and an independent test set. On the test set, negative predictive value and specificity were estimated to be 96 and 84%, respectively, suggesting clinical utility in the management of patients considering surgery. Using in silico and in vitro mixing experiments, we demonstrated that even in the presence of 80% dilution with benign background, the classifier can correctly recognize malignancy in the majority of FNA samples.
Conclusions: The FNA-trained classifier was able to classify an independent set of FNAs in which substantial RNA degradation had occurred and in the presence of blood. High tolerance to dilution makes the classifier useful in routine clinical settings where sampling error may be a concern. An ongoing multicenter clinical trial will allow us to validate molecular test performance on a larger independent test set of prospectively collected thyroid FNAs.
Fine-needle aspiration (FNA) is the screening and diagnostic tool of choice in the evaluation of thyroid nodules (1, 2). However, cytological results are indeterminate (defined as atypical, follicular or Hürthle cell neoplasm, or suspicious for malignancy) in 10–30% of cases (3–5). The large majority of patients (80%) with indeterminate cytology results undergo partial or complete thyroidectomy. Although surgical resection is presently necessary in the management of indeterminate nodules, subsequent postsurgical evaluation reveals a malignancy rate ranging from 6–30%, making this clinical process one with extremely low specificity (6–8). Therefore, improvements in the preoperative assessment of cytologically indeterminate thyroid FNAs are likely to result in better-quality management of patients.
Groups aiming to identify biomarkers of malignancy in indeterminate thyroid FNAs have reported their classification results, usually with higher specificity than sensitivity (9–11). Molecular markers of malignancy, such as BRAF and RAS mutational status, have been investigated as an approach to classify thyroid nodules, including those that are indeterminate by cytology (7). However, this approach misses a significant proportion of malignant samples that do not contain one of the mutations being tested, hence limiting its clinical utility in avoiding benign surgeries.
Although some marker panels show promising performance, most do not achieve a high enough negative predictive value (NPV) on indeterminate FNAs for physicians to choose watchful waiting over thyroid surgery. Furthermore, testing in an independent set of samples either resulted in poor performance or was not reported in all cases, a requirement for assessing any trained molecular classifier for generalizability (12). We sought to develop a molecular classifier that satisfies the objective of 95% NPV and 70% specificity when tested on FNAs collected in the clinic. This approach has the potential to reduce the incidence of thyroidectomies performed on patients with truly benign thyroid nodules, thus improving overall patient care. We set up over 20 academic and community-based sites in the United States to gather a representative sampling of FNAs encountered in current clinical practice.
We first developed a molecular classifier trained on postsurgical thyroid tissue but found its performance to be suboptimal in testing FNAs. We therefore retrained the classifier on clinic FNAs. We hypothesized that variability in the cellular composition of FNAs affects the reproducibility and accuracy of the classifier. FNA sample dilution may occur when the aspirate includes adjacent thyroid tissue and/or lymphocytic background. Reports have estimated that 30–58% of nodules with papillary thyroid carcinoma (PTC), 20% of nodules with follicular carcinomas (FCs), and 14% of nodules with follicular adenomas (FAs) arise in a lymphocytic background (13, 14). We show that the majority of PTCs tolerate dilution in a lymphocytic background down to less than 20% of their original mass, suggesting the classifier remains robust at low levels of malignant cells and against a potentially confounding background.
Here we report the development of a novel molecular classifier created specifically to resolve the ambiguity observed in samples categorized as indeterminate by thyroid FNA cytology. Validation of the classifier on an independent cohort of prospectively collected FNAs achieves 96% NPV [95% confidence interval (CI) = 82–99%] and 84% specificity (95% CI = 68–93%).
Examination of the top differentially expressed genes revealed significant overrepresentation of numerous Kyoto Encyclopedia of Genes and Genomes (KEGG) and gene ontology (GO) pathways. We found an overrepresentation of genes in the cell adhesion, extracellular matrix, plasma membrane, focal adhesion, and adherens pathways, thus confirming by molecular means the myriad of visual morphological changes that have been the hallmark of surgical histopathological diagnosis for the past century.
Materials and Methods
Additional information can be found in Supplemental Data (published on The Endocrine Society’s Journals Online web site at http://jcem.endojournals.org).
Specimens
Samples were obtained with patient informed consent through Institutional Review Board-approved protocols. Postsurgical thyroid tissue was snap-frozen immediately after excision and stored at −80 C. Prospective FNA samples were 1) aspirated in vivo at outpatient clinical sites, 2) aspirated preoperatively, or 3) aspirated ex vivo immediately after surgical excision and then directly placed into RNAprotect preservative solution (QIAGEN, Valencia, CA) and stored at −80 C. When available, postsurgical slides were reexamined by one or two additional expert pathologists. A breakdown of samples and subtypes is available in Supplemental Data.
RNA isolation, amplification, and microarray hybridization
RNA from clinical FNAs was extracted using the AllPrep micro kit (QIAGEN). RNA from surgical thyroid tissue was purified using a standard phenol-chloroform extraction and ethanol precipitation method. Total RNA was amplified using the NuGEN (San Carlos, CA) WT Ovation amplification system and hybridized to Human Exon 1.0 ST arrays (Affymetrix, Santa Clara, CA).
Training models and classification
Two distinct training models were built using postsurgical tissue or FNA samples. Classification of samples into benign and malignant categories was done using transcript cluster intensity summaries from the exon array as features in the model. Selection of markers differentiating benign and malignant categories was done using a LIMMA linear model approach. Classification was performed using a linear support vector machine (SVM) model and performance estimated using 30-fold cross-validation (details in Supplemental Data). To determine a classification score cutoff value, the cross-validated classifier scores were resampled to represent the distribution of subtypes seen in the prospective FNA collection.
Supplemental Data further describe the methods used to assess classifier performance, estimate cellular heterogeneity, estimate classifier tolerance to sample dilution, develop in vitro and in silico mixture modeling, and perform gene enrichment analysis.
Results
Performance evaluation of tissue models on FNA samples
We began first by generating microarray data from a set of 178 surgical thyroid tissue samples, representing the eight most common benign and malignant subtypes [nodular hyperplasia (NHP), lymphocytic thyroiditis (LCT), FA, FC, PTC, follicular variant of PTC (FVPTC), and Hürthle cell carcinoma (HC)]. We chose the Affymetrix Human Exon 1.0 ST array, which measures all known and predicted human transcripts at both the gene and exon level, to provide a comprehensive transcriptional profile of these samples.
We implemented machine-learning methods to train a molecular classifier on tissue samples, and after the evaluation of several analytical methods, we chose the support vector machine (SVM) method for classification (15). Using 30-fold cross-validation, we estimated false-positive and false-negative error rates (16). True-positive rate (1 − false-negative rate) as a function of false-positive rate generated a receiver-operator-characteristic (ROC) curve with an area under the curve (AUC) of 0.90 (Fig. 1A, black line). To represent the natural prevalence of malignant samples within the indeterminate group, we performed resampling to attain a target subtype distribution containing approximately 30% malignant samples (4–10); see Supplemental Data on classification score and cutoff determination for details. The AUC of the resampled ROC curve is 0.89 (Fig. 1A, red line). We then used these parameters and models to test an independent set of FNAs to determine whether this performance is generalizable to an unseen data set. We used a test set of 24 FNAs with indeterminate cytopathology and known surgical pathology diagnoses. We also expanded this independent test set to 48 with an additional 24 FNAs diagnosed as benign or malignant by cytopathology and known surgical pathology diagnoses. The composition of the sample sets are described in Table 1. The performance of the tissue-trained classifier decreased when tested on the independent FNAs, with sensitivity of 92% (95 CI = 68–99%) and specificity of 58% (95% CI = 41–73%) on the entire set of 48 FNAs (Fig. 2). Performance on the indeterminate-only subset of 24 FNAs is similar to the cross-validated performance (Fig. 2). The lower performance of the tissue-trained classifier on FNAs could be due to several reasons: algorithm overfitting, the small sample sizes used for independent testing, or a fundamental difference in the biological or technical properties of tissue samples and FNAs. We addressed the third possibility by first ensuring that there were no RNA quality differences between the two sample types used in our analyses (data not shown) and, second, by examining cellular heterogeneity as a variable. The first two possibilities are addressed later in the manuscript.
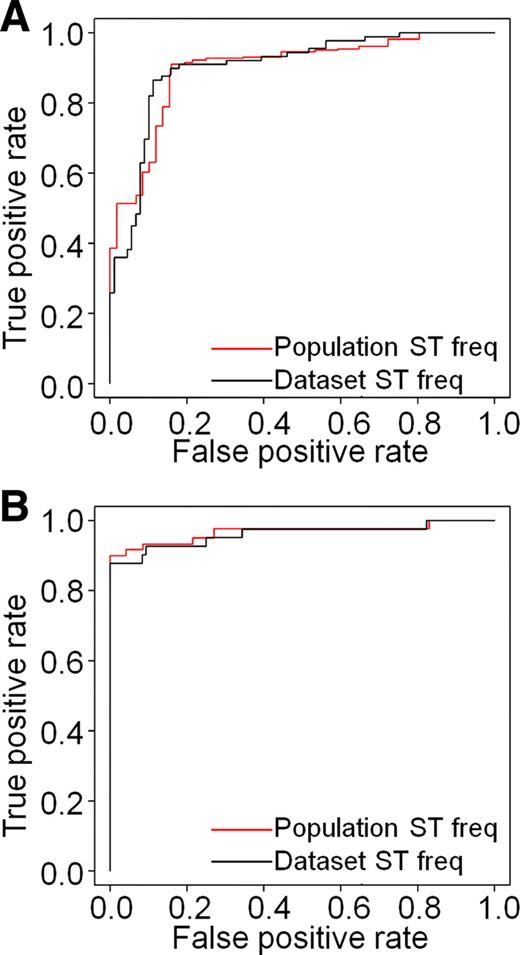
Cross-validated performance estimates for two classifiers shown as ROC curves. ROC curves measure sensitivity (true-positive rate) of the classifier as a function of (1-specificity) or false-positive rate. For each classifier, two ROC curves were generated, one showing performance on the training set without adjusting for subtype prevalence (black) and the second (red) adjusting subtype (ST) prevalence to frequencies (freq) estimated for cytologically indeterminate specimens. A, Cross-validated ROC curves for a classifier trained on postsurgical thyroid tissues. AUC is 0.9 (unadjusted for subtype prevalence) or 0.89 (adjusted). B, Cross-validated ROC curves for a classifier trained on FNA samples. AUC is 0.96 (unadjusted) and 0.97 (adjusted). Both training sets are described in Supplemental Data and Table 1.

Comparison of tissue-trained and FNA-trained molecular classifiers and their performance on an independent test set. A, B, Sensitivity (A) and specificity (B) of both classifiers on the test set. Results are reported for the subset of n = 24 samples with indeterminate cytopathology (left), as well as for the entire test set of n = 48 cytologically benign (B)/malignant (M)/indeterminate samples (right). Point estimates are shown, with 95% Wilson binomial CIs as follows: tissue-trained classifier, indeterminate subset (n = 24) has sensitivity of 85.7% (49–97%) and specificity of 40% (21–63%). The FNA-trained classifier, indeterminate subset has sensitivity of 100% (64–100%) and specificity of 73.3% (49–89%). The tissue-trained classifier, entire test set (n = 48) has sensitivity of 92.3% (68–99%) and specificity of 58.1% (41–73%) compared with the FNA-trained classifier, entire test set with sensitivity of 92.3% (68–99%), specificity of 83.9% (68–93%). C, Subtype distribution of the test set, including tabulation of classifier calls within each subtype (either “benign” or “suspicious”). BLN, Benign lymph node; MLN, malignant lymph node.
Composition of samples used in algorithm training and testing, by subtype
| Subtype | Tissue training set (n = 178) | FNA training set (n = 137) | Independent FNA test set benign, malignant, and indeterminate (n = 48) | Independent FNA test set: subset of indeterminate only (n = 24) |
|---|---|---|---|---|
| NHP | 23 | 67 | 15 | 7 |
| LCT | 40 | 18 | 4 | 3 |
| FA | 26 | 9 | 14 | 7 |
| HA | 0 | 2 | 0 | 0 |
| BLN | 0 | 0 | 1 | 0 |
| Total benign | 89 | 96 | 34 | 17 |
| HC | 23 | 0 | 2 | 2 |
| FC | 19 | 3 | 0 | 0 |
| FVPTC | 21 | 4 | 5 | 3 |
| PTC | 26 | 34 | 6 | 2 |
| MLN | 0 | 0 | 1 | 0 |
| Total malignant | 89 | 41 | 14 | 7 |
BLN, Benign lymph node; HA, Hürthle adenoma; MLN, malignant lymph node.
Evaluation of cellular heterogeneity between tissues and FNAs
Due to the sampling process, FNA samples may include adjacent thyroid tissue and/or lymphocytic background. Reports have estimated that substantial percentages of thyroid nodules contain lymphocytic background (13, 14). To begin to understand differences in the cellular composition of thyroid surgical tissue and FNAs, we measured genes known to be present in thyroid follicular cells (17) and lymphocytes (18) and created a composite measure of each sample based on the average signal of these follicular content markers as a function of average lymphocyte content markers. We observed that this composite measure has significantly higher variability in FNAs (Fig. 3B) than in tissues (Fig. 3A). These data are consistent with the lower performance of the tissue-trained classifier when predicting on FNAs and underscores the importance of accounting for cellular heterogeneity in biomarker discovery.
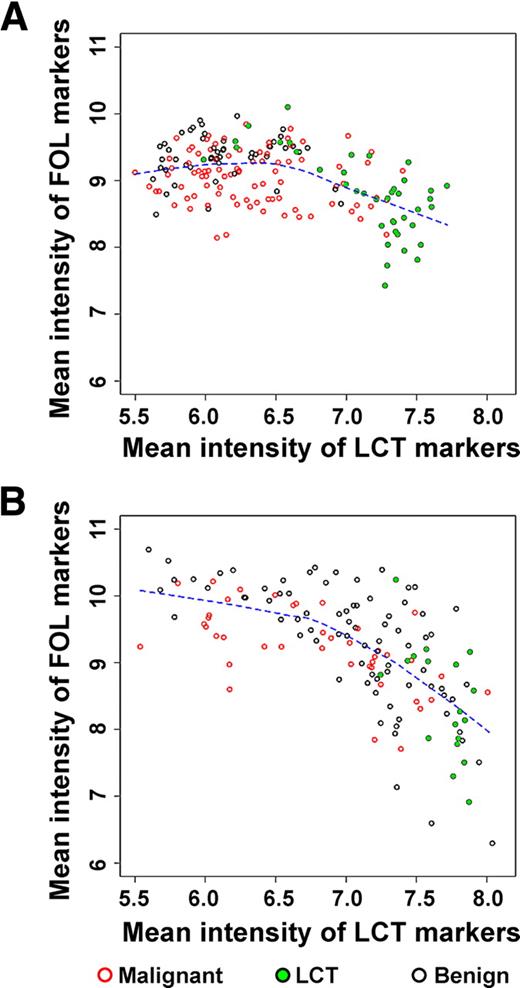
Comparison of composite follicular (FOL) and LCT scores across surgical tissue (n = 178) (A) and FNAs (n = 137) (B). The scores are defined as mean intensity levels of relevant biomarkers (see Supplemental Data). The mean signal intensity of follicular cell biomarkers decreases as the mean signal intensity of lymphocytic markers increases. The variability in both follicular and lymphocytic components is substantially greater in clinical FNA samples compared with postsurgical tissues.
Performance evaluation of FNA models on FNA samples
Given the differences in classifier performance and cellular composition we observe between postsurgical tissues and clinical FNAs, we hypothesized that developing an accurate molecular diagnostic tool would require gene discovery and algorithm training on clinical FNA samples. To this end, we assembled a cohort (n = 960) of prospectively collected clinical thyroid FNAs from more than 20 clinics across the United States, of which corresponding cytopathology and/or surgical pathology was available on FNAs (n = 137) encompassing both prevalent and rare thyroid subtypes. The composition of this training set is shown in Table 1. Histopathology slides from all patients who underwent surgical resection were subjected to primary review by a local surgical pathologist and, when available, subjected to secondary review by one to two experts to adjudicate gold-standard training and test labels. Genome-wide expression data from this cohort were used to develop a second-generation classifier, trained on FNAs, to achieve desired clinical performance. First, we estimated classifier performance using 30-fold cross-validation (similar to the process used with the tissue classifier; see Fig. 1A). The cross-validated ROC curve (sensitivity of the classifier as a function of false-positive rate) shows excellent performance, with an AUC of 0.96 for the training data as is and 0.97 when resampled to account for the prevalence of subtypes in the indeterminate population. When sensitivity is fixed at 95%, specificity remains very high at 75% (Fig. 1B) and is unaffected by varying quantities of blood in the FNA (data not shown). This classifier was then tested on the same independent test set of prospectively collected clinical FNAs used to test the tissue-trained classifier (Fig. 2, A and B). Data shown in Fig. 2 indicate that FNA-trained classifier is characterized by higher sensitivity and specificity, both on the entire test set and a subgroup of n = 24 indeterminate FNA samples. Although the test set is small in size, classifier performance on unseen data is similar to that estimated by cross-validation from training data, suggesting that the algorithm is not overfitted and that the FNA-trained classifier is generalizable to unseen samples.
The proportion of malignant samples in the test set is approximately 30%, similar to that described for indeterminate FNA samples (3–8). The classifier performs well on subtypes encountered in the independent test set; however, this test set lacked examples of FC and HA. Therefore, the classifier will need to be evaluated in a much larger series of indeterminate FNAs that includes more examples and subtypes. An ongoing multicenter prospective clinical trial across over 40 U.S. academic and community-based sites will be used to validate the performance of this molecular test on a large set of indeterminate FNAs.
In vitro and in silico modeling of sample mixtures
The inability to capture sufficient cells of interest in the aspirate, i.e. nodule sampling errors, could affect the performance of the classifier and compromise its clinical utility. We therefore sought to determine how sensitive the classifier is to decreasing proportions of malignant cells. We approached this problem by validating a model for in silico simulation of the mixture signal with in vitro mixing experiments and then using computational simulations to analyze the tolerance of the classifier to the dilution effects. Our results indicate that the deviation of simulated mixture profiles from the actual observed profiles for in vitro mixtures is within the noise levels observed for technical replicates (more details in the Supplemental Data). Furthermore, classification scores in in vitro data are nearly superimposable on the in silico predictions made for mixtures with similar PTC content (Fig. 4). Notice that in the case of this particular PTC sample, the classifier tolerates dilution of the PTC signal to less than 20% of the original level and reports a “suspicious” call for the mixed sample. However, a different clinical sample may contain a smaller proportion of malignant cells and may be characterized by lower tolerance to dilution. Given the agreement established between in silico and in vitro simulations, we next used computational simulations to investigate dilution effects on a broader set of FNAs.
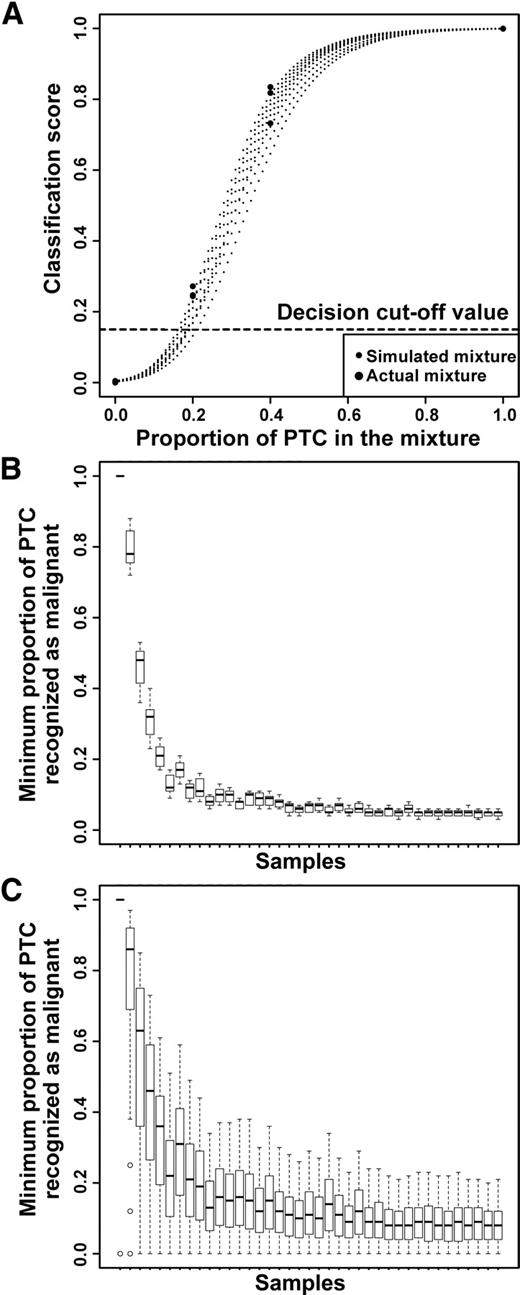
In silico simulations and in vitro mixtures show classifier performance is highly tolerant to sample dilution and heterogeneity. A, Classification scores for in silico simulated mixtures agree with classification scores for samples obtained using in vitro mixing with the same pure NHP and PTC samples. B, Classification call tolerance to in silico dilution of PTC with LCT. C, Classification call tolerance to in silico dilution of PTC with NHP. In B and C, each box plot corresponds to an individual PTC sample being diluted using one of many LCT or NHP samples. Samples are arranged in order of decreasing classification score for pure PTC.
We took each one of the 39 PTC FNA samples and mixed it in silico with one of either LCT or NHP samples. Naturally, individual FNA samples do not represent pure expression of any single component of the possible cellular types. However, the variety of signals present in many LCT and NHP samples represents the spectrum of the possible composite background signals that could obscure malignant cell signals in clinical biopsies. The results of this simulation are summarized in Fig. 4, showing the minimum proportion of the PTC signal that results in a “suspicious” call by the classifier. Smaller proportions correspond to higher tolerance to dilution. Results for mixing with LCT background are shown in Fig. 4B, and results for mixing with NHP background are shown in Fig. 4C. Notably, tolerance is higher for dilution with LCT signal. Over 80% of all PTC samples in this data set can be diluted to levels under 10% of the original signal with LCT background and still be correctly called by the classifier. Up to 50% of the samples can be diluted to less than 6% of the original sample. PTC samples appear more sensitive to dilutions with NHP signal, with highest scoring samples tolerating, on average, dilution down to 12% of the original signal, and approximately 80% of PTC samples tolerate dilutions down to 20% of the original signal. We also observed that the variances of tolerance for any given PTC sample are larger than those observed for LCT background.
Gene enrichment analysis
The classifier training process identified many genes well known for their involvement in thyroid malignancy as well as those previously not associated with this disease. To characterize the biological signatures associated with these genes, we performed overrepresentation analysis (ORA) using differentially expressed genes with high statistical support. The analysis tests the likelihood that an observed group of genes (i.e. genes in a pathway) share a nonrandom connection pointing to the underlying biology.
The first analysis focused on the KEGG pathways database and revealed enrichment of cell membrane-mediated pathways (Table 2). The extracellular matrix (ECM) receptor interaction, cell adhesion, tight junction, and focal adhesion pathways highlight the role of integrins among other membrane-bound mediators in thyroid malignancy. Other top pathways point to TNF, Rho, and chemokine gene families long known for their involvement in carcinogenesis. These results are complemented by ORA using the GO database. Again, endothelial, ECM, and cell membrane signatures represent five of the top 10 results. Another top ranked biological signature detected in the GO ORA points to wound healing. This gene expression signature has been associated with diminished survival in breast cancer patients (19).
ORA of top differentially expressed genes (n = 980; 657 up-regulated and 323 down-regulated)
| Subcategory | Number of genes expected | Number of genes observed | P value (FDR-corrected) |
|---|---|---|---|
| KEGG pathways ORA | |||
| Cell adhesion molecules | 8 | 28 | 4.17 × 10⁻⁷ |
| Olfactory transduction | 24 | 3 | 1.80 × 10⁻⁶ |
| Focal adhesion | 12 | 29 | 0.0003 |
| Adherens junction | 5 | 15 | 0.0006 |
| Arrhythmic right ventricular cardiomyopathy | 5 | 15 | 0.0006 |
| ECM-receptor interaction | 5 | 16 | 0.0006 |
| Metabolic pathways | 66 | 39 | 0.0006 |
| Tight junction | 8 | 21 | 0.0006 |
| Leukocyte transendothelial migration | 7 | 19 | 0.0009 |
| Complement coagulation cascades | 4 | 13 | 0.0021 |
| GO pathways ORA | |||
| Plasma membrane | 113 | 220 | 2.82 × 10⁻²² |
| Cell adhesion | 26 | 77 | 8.04 × 10⁻¹⁶ |
| Defense response | 22 | 59 | 1.09 × 10⁻⁹ |
| Nuclear part | 75 | 28 | 3.63 × 10⁻⁹ |
| Organelle part | 150 | 87 | 1.40 × 10⁻⁹ |
| Response to wounding | 17 | 47 | 1.97 × 10⁻⁸ |
| Nucleus | 144 | 87 | 2.41 × 10⁻⁷ |
| Extracellular region part | 26 | 59 | 2.41 × 10⁻⁷ |
| Intracellular | 339 | 266 | 3.24 × 10⁻⁷ |
| Locomotion | 17 | 44 | 6.47 × 10⁻⁷ |
Numbers in regular font refer to pathways that are overrepresented by top differentially expressed genes; those in bold refer to pathways that are underrepresented. FDR, False discovery rate.
Discussion
Most of the previous work on understanding expression patterns in thyroid cancer was carried out on tissue samples due to their availability for research. Our own comparison of profiles observed in FNA and tissue data indicates that there are global similarities in expression patterns. However, tissue samples do not fully represent the spectrum of variability observed in the clinically relevant population of FNA samples obtained from a multicenter trial. One additional source of variability in FNA samples can be attributed to the varying contribution of thyroid follicular cells and adjacent cell populations (such as red blood cells, lymphocytes, and macrophages) to the overall signal. Moreover, different markers are affected differently by this transition from tissue to FNA samples, depending on their role and expression patterns in the population of cells likely to be sampled during an FNA procedure. Thus, we find that a representative collection of FNA samples is required to accurately calibrate the models, make them robust against likely contaminants, and ensure adequate performance in the clinical setting.
However, working with clinical FNA samples collected across 20 sites presents its own challenges due to variable RNA quality and, at times, substantial RNA degradation. Our choice of exon arrays and whole-transcript RNA amplification avoids the 3′ biases characteristic of other microarray systems. We find that this assay enables consistent estimates of expression signals in samples of variable degradation levels. Consequently, our classifier demonstrates stable performance in these challenging specimens.
Both biological and procedural factors could contribute to discrepancies between classifier calls and histopathological diagnosis. Among these, nodule sampling errors could explain some “benign“ calls made by the classifier on FNA samples from nodules that are diagnosed as malignant by surgical pathology. Studies show that cytopathology results differ depending on the number of passes used in the FNA procedure (20). The current study uses FNAs from a single pass into the nodule. Although our results show the molecular classifier can tolerate sample dilution to less than 20% on average, it is possible that FNAs composed of very low proportions of malignant cells will result in false-negative errors using our test. Future studies on ex vivo FNAs will be aimed toward understanding reproducibility of classifier results obtained from different samplings of the nodule.
Procedural errors can arise when the nodule sampled during FNA cannot be traced to the specific nodule in the histopathology report. This can happen, for example, when both benign and malignant nodules are present in the same lobe. In our studies, an FNA taken from a given nodule in the clinic or preoperatively must later be linked to the resected nodule that undergoes surgical pathology evaluation. The time interval can be weeks or months. If referential integrity is not maintained, it is not possible to ascribe a surgical pathology diagnosis to the nodule that was sampled for molecular testing. This nodule ambiguity leads to both false negatives and false positives. We have seen cases of both, which were subsequently resolved by conferral with the local surgical pathologist (data not shown); however, some cases may not be possible to resolve and will contribute to the overall error rate of the classifier.
Finally, inherent ambiguity of histopathological diagnosis is a contributor to the observed error rates. It is known that interobserver variability is high in the diagnosis of thyroid lesions (21, 22). Subtypes that are more prone to expert disagreement could be expected to incur higher misclassification rates by the molecular classifier, although precise estimates of such factors are not possible given current data.
As an example, consider recent discussions of FVPTC diagnosis (22), highlighting the controversy in diagnosing the category of encapsulated FVPTC lesions with no obvious capsular invasion. In our present FNA data set, this ambiguity can be illustrated by label changes that occurred based on expert overread: for five samples with final adjudicated label of FVPTC, the original diagnosis from local hospitals included FA (one), FC (one), FVPTC (two), and PTC (one). Conversely, of seven samples with local diagnosis of FVPTC, five were called PTC and two retained the original diagnosis of FVPTC after adjudication. Other molecular studies have also attempted to identify borderline lesions (23), with signatures that are distinct from both benign and malignant classes. With more molecular data becoming available, identification of such borderline lesions and correlation of molecular and morphological features may provide better clues for consistent diagnostic criteria.
Although our primary goal has been to develop an accurate classifier of benign thyroid FNAs, we also sought to understand the nature of the biological signatures detectable at the molecular level in our cohort. Using two independent sources of biological annotation (KEGG and GO), we found consistent endothelial membrane and ECM signatures. These signatures highlight the role of slowly occurring, cellular membrane architecture changes in thyroid carcinogenesis. In a normal state, the cells within a thyroid are highly polarized and organized into three-dimensional follicle structures, requiring distinct roles of their luminal and apical membranes. Current histopathology methods rely on morphological changes to differentiate benign from malignant states. Hence, it is not surprising to discover that membrane-associated genes are differentially expressed and can be used to accurately classify thyroid FNAs. We found the fibronectin gene (FN1) to be among the known genes identified in our gene selection process. FN1 has been extensively described as a marker of thyroid carcinoma (24, 25). Fibronectin is an ECM glycoprotein thought to mediate cell adhesion by binding membrane-spanning integrins. Progressive alterations of cell morphology and architecture are typical of most epithelial malignancies. Takano et al. (26) have posed that FN1 expression arises from thyroid fibroblasts, Prasad et al. (27) reported detection of FN1 in 33 of 37 PTCs (89%). Other known genes of interest include thyroid peroxidase (TPO), galectin-3 (LGALS3), calcitonin (CALCA), tissue inhibitor of metalloproteinase (TIMP), angiopoietin-2 (ANGPT2), and telomerase reverse transcriptase (TERT), all genes previously implicated in thyroid cancer (24, 28). It is important to note that in a set of FNAs with variable RNA degradation, the classifier requires signals from approximately 100–200 genes to achieve high accuracy. Measurement of individual or smaller numbers of genes does not achieve the performance required for clinical utility (data not shown). Furthermore, despite the high-density transcriptional profiling we report here, we do not expect to extract all relevant biological signals from thyroid nodules due to loss of signal in degraded samples, dilution by cellular heterogeneity, technical limitations of microarray technology, and finally, insufficient representation of certain subtypes in training. Nevertheless, our discovery of many known genes described in the literature lends conceptual plausibility to our feature selection and algorithm training process. In conclusion, we show cross-validated molecular test performance and validation on a modest-sized independent validation set with high enough specificity to reclassify over half of indeterminate FNAs as benign, making the test clinically useful. In addition, the high NPV we observe indicates that nodules with a benign molecular test result carry a risk of malignancy similar to that of nodules with benign cytopathology (29). Future ongoing studies are aimed at evaluating the performance of this classifier on a larger independent set of FNAs with indeterminate cytopathology to assess its clinical utility in thyroid nodule management.
Acknowledgments
We thank Terry Speed, Lewis T. Williams, and Edison Liu for stimulating discussions and helpful comments on this study.
Disclosure Summary: J.I.W., E.T.W., H.W., C.M.E., J.R., E.T., C.T.R., L.F., C.C.W., R.B.L., and G.C.K. are employed by and have equity interests in Veracyte. D.C. and M.P. consult for Veracyte. N.R. was previously employed by Veracyte. M.Z., E.K., J.R., G.F., and V.A.L. have received research support from Veracyte.
Abbreviations:
- AUC,
Area under the curve;
- CI,
confidence interval;
- ECM,
extracellular matrix;
- FA,
follicular adenoma;
- FC,
follicular carcinoma;
- FNA,
fine-needle aspiration;
- FVPTC,
follicular variant of PTC;
- GO,
gene ontology;
- HC,
Hürthle cell carcinoma;
- KEGG,
Kyoto Encyclopedia of Genes and Genomes;
- LCT,
lymphocytic thyroiditis;
- NHP,
nodular hyperplasia;
- NPV,
negative predictive value;
- ORA,
overrepresentation analysis;
- PTC,
papillary thyroid carcinoma;
- ROC,
receiver operator characteristic.
