


Abstract
Context: Alterations in calcium homeostasis have long been associated with affective disorders. Recently, it has been suggested that abnormalities in calcium metabolism may be responsible for some affective and somatic symptoms in women with premenstrual syndrome.
Objective: Our objective was to measure fluctuations and group differences in calcium-regulating hormones across the menstrual cycle in women with and without premenstrual dysphoric disorder (PMDD).
Design: We conducted a cross-sectional and prospective study of women with and without PMDD. Participating women underwent 2 months of self-assessment symptom screening and 1 month of hormonal evaluation.
Results: Calcium-regulating hormones varied significantly across the menstrual cycle in both groups. Total serum, ionized and urine calcium, pH, intact PTH, and 1,25-dihydroxyvitamin D [1,25(OH)2D] varied significantly over the menstrual cycle. The PMDD group, when compared with controls, had significantly lower ionized calcium at phase 1 (menses) (1.166 ± 0.072 vs. 1.182 ± 0.087 mmol/liter; P = 0.027), significantly lower urine calcium excretion at three of the five phases (late follicular phase 2, midcycle phase 3, and early luteal phase 4), and significantly lower 1,25(OH)2D at luteal phase 4 (45.0 ± 27.5 vs. 50.6 ± 33.8 pg/ml; P = 0.032).
Conclusions: Cyclical fluctuations of the calcium-regulating hormones may help us better understand some of the psychological and somatic features of PMDD. The lack of responsiveness in vitamin D metabolism resulting in a decline in 1,25(OH)2D during the luteal phase of the menstrual cycle may serve as the biological trigger for the classical features of PMDD.
PREMENSTRUAL DYSPHORIC DISORDER (PMDD), a severe form of premenstrual syndrome (PMS), is a debilitating disorder characterized by recurrent, cyclical emotional and physical symptoms during the luteal phase of the menstrual cycle (1). Its pathophysiology remains incompletely understood (2, 3). Interestingly, alterations in calcium homeostasis have long been associated with many affective disorders (4). Irritability, anxiety, and mania have been associated with hypocalcemia, whereas increased calcium concentrations have been noted in some patients with depression (5–8). It has recently been suggested that abnormalities in calcium metabolism may be responsible for the affective and somatic symptoms in women with PMS (9). Three separate investigations have demonstrated that the dysphoria, anxiety, depression, and somatic symptoms of PMS all respond favorably to either increased dietary calcium intake or daily calcium supplementation (10, 11). Increased calcium intake proved to benefit significantly all four major categories of PMS symptoms (negative affective symptoms, water retention symptoms, food cravings, and pain symptoms). A small randomized, placebo-controlled crossover trial of 33 women and a larger, multicenter trial involving 497 women both demonstrated a reduction in symptoms by calcium supplementation (9, 10). Furthermore, when compared with asymptomatic women, women with PMS were shown to have exaggerated fluctuations of the calcium-regulating hormones across the menstrual cycle with evidence of vitamin D deficiency and secondary hyperparathyroidism (12, 13).
We considered the possibility that in PMDD, abnormal calcium homeostasis might be present and be a plausible explanation for some of the symptomatology of PMDD. Our hypothesis was that women with PMDD would be vitamin D deficient compared with asymptomatic women. Specifically, we sought to 1) measure fluctuations in calcium-regulating hormones across the menstrual cycle of women with and without luteal-phase symptoms consistent with PMDD, 2) seek differences in the calciotropic hormones between women with and without PMDD, and 3) identify the pattern and relationship between ovarian hormonal cyclicity and the calciotropic hormone changes in women with and without PMDD.
Subjects and Methods
Subjects
This study was conducted between 2000 and 2005. The protocol was approved by the institutional review board of St. Luke’s–Roosevelt Hospital Center, and all participants gave written informed consent. Healthy, premenopausal women between the ages of 18 and 45 yr of age were recruited from New York City and its tristate regions. Women with severe PMS and asymptomatic controls were screened. Only Hispanic and Caucasian women were enrolled. Potential subjects were recruited through advertisements, internet venues, newspapers, flyers, hospital and National Institutes of Health websites, and by word-of-mouth. Prescreening by telephone was conducted to exclude those subjects who did not meet the inclusion/exclusion criteria. For all women, inclusion criteria were general good health and regular menstrual cycles 21–35 d in length (±5 d). For women recruited to the PMDD group, an inclusion diagnosis of PMDD required meeting the Diagnostic and Statistical Manual of Mental Disorders IV criteria: 1) a medical history of luteal-phase symptomatology as defined by cyclically recurring symptoms at least moderate in severity; 2) prospective and consecutive assessment with a 2-month symptom diary, the PMS diary (PMSD); 3) five or more symptoms (with at least one symptom being from items 1–4) rated at least moderate in severity for the last week of the menstrual cycle with evidence of functional impairment for at least 2 d (symptom 11 included eight physical symptoms and was counted only once for diagnosis), and 4) a minimal symptom intermenstrual phase occurring after menses (14). In addition, a minimal mean symptom intensity change at least 50% higher in the luteal phase compared with the intermenstrual phase was required. To be included as a control, women had to have had 1) no prior medical history of PMDD or PMS, 2) a prospective and consecutive assessment with a 2-month daily diary demonstrating minimal symptoms during the luteal and intermenstrual phases and no evidence of functional impairment, and 3) no more than two symptoms rated as either moderate or severe on no more than 2 d during any one screening cycle. Exclusion criteria for all women were a major medical condition or serious medical illness in the past; major psychiatric disorder; active depression; active substance abuse; history of anorexia and/or bulimia; history of amenorrhea; hyperthyroidism; thyroid conditions not regulated by medication; participation in another clinical trial within the past 30 d; use of serotonin reuptake inhibitors, antidepressants, and/or psychoactive medications within the past 6 months; inflammatory bowel disease; malabsorption; multiple myeloma; cancer; gastrointestinal disorders; use of glucocorticoids or anticonvulsants; current use of diuretics; menstrual cycle irregularity; endometriosis; oral contraceptive medication; bone and calcium disorders such as primary hyperparathyroidism; and any overt metabolic disorder such as diabetes mellitus.
Protocol design
Detailed evaluation included medical, menstrual, and gynecological history, a physical examination, and baseline laboratory screening with CBC, chemistry panel, thyroid function panel, pregnancy test, and 24-h urine calcium measurement. A modified structured psychiatric interview (SCID) was performed during the screening period to exclude recent or concurrent mental disorders within the previous 6 months (15). Two months of prospective symptom screening with 1 month of hormonal evaluation was conducted. Each participant received 40 self-assessment symptom-rating questionnaires (the PMSD) monthly for the duration of the study. Daily diaries were collected at visits scheduled shortly after the onset of menses and reviewed monthly, and symptom scores were quantified to assess PMDD or control symptom criteria. Subjects were instructed to complete one questionnaire each evening describing how they felt during the previous 12–18 h. A repeat third screening month determination was offered the potential PMDD participant (not the asymptomatic control) if either of the first two screening months failed inclusion criteria. If two consecutive menstrual cycles did not fulfill the inclusion criteria, the candidate was disqualified. Daily symptom assessment continued throughout the menstrual cycle when hormonal evaluation occurred. In addition, a food diary entered into the Nutritionist Pro software analysis program (version 2.2; Stafford, TX) was used to provide a detailed record of the dietary and supplemental calcium and vitamin D intakes of the participating subjects during 4 d (two luteal and two follicular days) of the observation period of hormone sampling (16).
Figure 1 shows the recruitment and enrollment cascade for the study. Approximately 80% (4034) of the women telephone screened were disqualified for failure of inclusion/exclusion criteria involving ethnicity, oral contraceptive usage, irregular menstrual cycles, geographic location, or taking of psychotropic medication. A total of 890 subjects signed consent and were enrolled in the study for symptom monitoring and diary evaluation. Eighty-nine PMDD participants qualified for hormonal evaluation after completion of a minimum of 2 months of prospective symptom diary screening, whereas 55 qualified as asymptomatic controls. The other 746 were disqualified based on symptom severity criteria, cycle irregularity or voluntary withdrawal. A total of 129 women completed the timed biochemical and hormone evaluation with 115 (68 PMDD and 47 controls) providing hormone data meeting criteria for analysis. Unanticipated oral contraceptive use, pregnancy, anovulatory cycle, or elevated calcium consistent with primary hyperparathyroidism excluded the 14 subjects from analysis. There was no seasonal variability in recruitment between the groups.
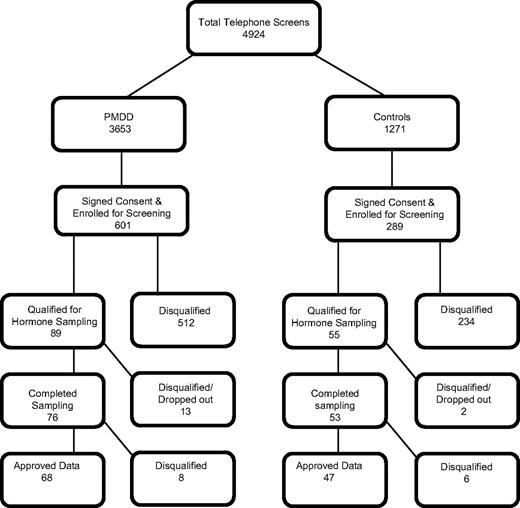
Recruitment, enrollment, and retention cascade.
Symptom assessment
Symptom screening, monitoring, and diagnosis of both the PMDD and control participants employed the PMSD self-assessment symptom rating scale. The PMSD is a concise, validated questionnaire consisting of 18 symptoms (11 items with item 11 having eight physical symptoms) including four core factors: affective, pain, water retention, and food symptoms (17). Each symptom is rated on a 4-point rating scale: 0, absent; 1, mild; 2, moderate; and 3, severe. The 18 symptoms assessed include both emotional and physical symptoms and were 1) mood swings/crying spells, 2) depression/sadness/feelings of hopelessness, 3) anxiety/tension/nervousness/keyed up/on edge, 4) anger/aggression/short tempered/irritability, 5) decreased interest in usual activities, 6) difficulty in concentrating, 7) fatigue/lack of energy, 8) increased appetite/decreased appetite/craving for sweets, 9) insomnia/hypersomnia or requiring more sleep, 10) a sense of being out of control or overwhelmed, and 11.a) abdominal bloating, b) lower abdominal cramping, c) generalized aches and pains, d) lower backache, e) headache, f) swelling of extremities, g) tenderness/fullness of breasts, and h) palpitations. All subjects were requested to complete the diaries during evening hours. The average of the components of symptom 11 counted as a single item when determining qualification for inclusion criteria, whereas the severity rating of all 18 symptom items were summed for a total score. The luteal mean was defined as the 7-d symptom mean before the onset of menstruation, the menstrual mean was defined as the mean scores during days of menstruation, and the intermenstrual mean was defined as the 7-d symptom mean immediately after menses.
Measurements
Once a subject qualified for hormonal evaluation, she was scheduled for timed hormone and biochemical samples based on her two previous menstrual cycle lengths. Serum for calciotropic hormones were collected at eight points during the menstrual cycle. Two samples were obtained within the early follicular phase, four within the periovulatory period, and two samples within the mid-to-late luteal phase of the menstrual cycle (i.e. d 2, 7, 12, 13, 14, 15, 22, and 27) for one cycle. The timing and frequency of the blood samples were adjusted according to the individual subject’s menstrual cycle. Serum samples were assayed for reproductive hormones (estradiol with the extraction chromatography RIA, progesterone with the chemiluminescence assay, and LH with the immunochemiluminometric assay), total serum calcium with the spectrophotometry assay method (normal range, 8.8–10.1 mg/dl; intra- and interassay variations 0.65 and 1.25%, respectively), ionized calcium (normal range 1.15–1.29 mmol/liter; intra- and interassay variations 0.6 and 0.9%, respectively) and pH with an ion-specific electrode, urine calcium with spectrophotometry (normal range 50–320 mg; intra- and interassay variations 2.1 and 2.3%, respectively), calcium-regulating hormones including intact PTH with the immunochemiluminometric assay (normal range 10–65 pg/ml; intra- and interassay variations 5.0 and 7.3%, respectively); 1,25 dihydroxyvitamin D [1,25(OH)2D] with the extraction chromatography radioreceptor assay (normal range 15–60 pg/ml; intra- and interassay variations 13.3 and 11.6%, respectively); 25 hydroxyvitamin D (25OHD) with the chemiluminescence assay (normal range 10–68 ng/ml, intra- and interassay variations 9.54 and 14.10%, respectively), and magnesium with Hitachi spectrophotometry (normal range 1.5–2.5 mg/dl; intra- and interassay variations 1.12 and 2.7%, respectively). Specialized laboratory tests except for ionized calcium were performed at Nichols Institute, Quest Diagnostics, San Juan Capistrano, CA. The anaerobically drawn ionized calcium samples were measured within 30 min of collection. Blood and urine samples were collected from 0700–1000 h after an overnight fast. Blood samples were allowed to clot for 1 h at room temperature, and serum was obtained by centrifugation. All timed hormone samples were frozen at −70 C and assayed simultaneously on an individual subject. Urine calcium samples were obtained 2 h after an initial morning void. Ovulation was determined by examination and review of estradiol and LH levels from d 10, 11, 12, 13, and 14 collections in conjunction with the luteal-phase serum progesterone concentration.
Statistical analysis
Data were entered into a computerized database and subjected to 100% verification against source documents. Descriptive statistics were calculated with means, sd, and 95% confidence intervals for all continuous measures and counts and percentages for categorical measures. Dependent measures were grouped into content domains (demographics, reproductive histories, habitus, serum chemistries, and urine chemistries). A multivariate ANOVA model with the vector of measures within each content domain was used to test the hypothesis that PMDD and control groups differed on at least one of the constituent measures. A P value < 0.05 for the fixed effect of group warranted univariate analysis of group differences for each of the constituent measures. This sequence of protected comparisons assures the overall experiment-wise type I error rate of 5% when many measures are recorded on the same subjects.
Univariate tests of baseline differences between PMDD and control groups used Student’s t tests for continuous measures or Fisher’s exact test for categorical variables. The between-group comparison of subjects’ average measures over the menstrual cycle (transverse mean) used Student’s t test. Differences between PMDD and controls in the temporal pattern of repeated serum and urine measures during hormone sampling were estimated with linear mixed models (SAS Proc MIXED; SAS Institute, Cary, NC) in which group, time (day of sample or menstrual cycle phase, see below), and group by time interactions entered as fixed effects, subject and error entered as random effects, and a compound symmetry covariance structure was used to model the within-subject autocorrelation among repeated measures. P values for group and group by time differences are reported from the mixed-model estimates of the fixed effects; P values for group differences at specific times (and within-group differences between times) are reported from the mixed-model estimates of the differences, and means and se are shown.
To facilitate analysis of grouped data from women with different menstrual cycle lengths, each woman’s menstrual cycle was divided into five phases for analysis: 1) first 5 d from onset of menses (menstrual phase), 2) menstrual cycle d 6 through 2 d before ovulation (follicular phase), 3) day before, day of, and day after ovulation (ovulatory phase), 4) 2 d after ovulation through midpoint of luteal phase (early luteal phase), and 5) midpoint of luteal phase to onset of next menses (late luteal phase).
Results
Demographics
The demographic, reproductive history, habitus, and lifestyle data for the overall group of 115 premenopausal women is shown in Table 1. The mean age of the PMDD participant was older than the control subject, although the difference was not significant (29.5 ± 6.1 vs. 27.9 ± 6.0 yr, P = 0.17). Only reproductive history suggested a statistical trend toward group differences. A greater number of PMDD participants who had ever been pregnant had miscarriages compared with control [seven of 18 (39%) vs. one of 13 (8%), P = 0.10], and a fewer number of PMDD who had ever been pregnant had abortions compared with control [nine of 18 (50%) vs. 11 of 13 (85%), P = 0.07]. By study inclusion criteria, the PMDD group had distinctively higher symptom scores than controls, which rose monotonically from the intermenses measurement on d 7 to a peak on menstrual d 27. Even the intermenstrual symptom score, the time period that is the symptom-free period in the PMDD group, was more than 6-fold higher than the control group.
Demographic and clinical characteristics of PMDD and control subject groups completing hormone sampling and between-groups comparison
| Measure | PMDD | Control | P value |
|---|---|---|---|
| n | 68 | 47 | |
| Age (yr) | 29.5 ± 6.1 (28.0–31.0) | 27.9 ± 6.0 (26.1–29.7) | 0.17 |
| Age at menarche (yr) | 12.9 ± 1.2 (12.6–13.2) | 12.6 ± 1.2 (12.2–12.9) | 0.14 |
| Race, no. Caucasian (%) | 49/68 (72%) | 35/47 (77%) | 0.59 |
| Height (m) | 1.66 ± 0.06 (1.65–1.68) | 1.65 ± 0.07 (1.63–1.70) | 0.32 |
| Weight (kg) | 63.8 ± 13.0 (60.7–66.9) | 62.0 ± 9.3 (59.3–64.8) | 0.40 |
| BMI (kg/m2) | 23.1 ± 4.8 (21.9–24.2) | 22.5 ± 3.7 (21.4–23.6) | 0.50 |
| Years PMS symptoms | 10.8 ± 6.2 (9.3–12.3) | N/A | |
| Menstrual cycle length (d) | 28.8 ± 2.8 (28.1–29.5) | 28.4 ± 2.5 (27.6–29.1) | 0.45 |
| Pregnancies, n (%) | 18/68 (26%) | 13/47 (28%) | 0.89 |
| Full-term pregnancies | 8/18 (44%) | 4/13 (31%) | 0.49 |
| Miscarriages | 7/18 (39%) | 1/13 (8%) | 0.10 |
| Abortions | 9/18 (50%) | 11/13 (85%) | 0.07 |
| Milk (8 oz./wk) | 4.4 ± 4.2 (3.3–5.4) | 4.6 ± 4.2 (3.4–5.9) | 0.74 |
| Dietary calcium intake (mg) | 801 ± 455 (691–911) | 794 ± 285 (709–879) | 0.93 |
| Dietary vitamin D intake (IU) | 94 ± 72 (77–112) | 102 ± 87 (76–128) | 0.61 |
| Supplemental calcium | |||
| n (%) | 31/68 (46%) | 15/47 (32%) | 0.15 |
| Intake (mg) | 371 ± 203 (297–446) | 433 ± 206 (318–547) | 0.35 |
| Supplemental vitamin D | |||
| n (%) | 28/68 (41%) | 14/47 (30%) | 0.22 |
| Intake (IU) | 171 ± 97 (133–208) | 227 ± 240 (88–365) | 0.42 |
| Exercise (h/wk) | 2.5 ± 0.8 (2.3–2.7) | 2.5 ± 0.7 (2.3–2.7) | 0.79 |
| Alcohol (oz./wk) | 2.5 ± 1.1 (2.2–2.7) | 2.6 ± 1.4 (2.2–3.0) | 0.67 |
| Carbonated beverages (cans/wk) | 2.4 ± 3.6 (1.5–3.3) | 3.1 ± 4.7 (1.7–4.5) | 0.40 |
| Ever smoke, n (%) | 65/68 (96%) | 46/47 (98%) | 0.64 |
| Current smoker, n (%) | 12/68 (18%) | 9/47 (19%) | 0.99 |
| Pack-years among ever smokers | 3.3 ± 4.4 (1.4–5.1) | 2.8 ± 3.2 (1.2–4.4) | 0.67 |
| PMDD symptom median | |||
| Luteal phase | 18.8 (13.1–27.7) | 0.6 (0.1–1.4) | |
| Menstrual phase | 12.4 (7.1–20.9) | 0.8 (0.2–1.8) | |
| Intermenstrual phase | 0.8 (0.0–1.8) | 0.0 (0.0–0.4) |
Results are shown as mean ± sd (95% confidence interval) or n (%) within group. Student’s t test was used for comparison of differences between group means for continuous measures, and Fisher’s exact test was used for comparison of differences between group proportions for categorical measures. Median test nonparametric comparison of median score (25–75th percentile) was used for differences between groups with P value calculated from the two-tailed absolute probability of Z.
Calciotropic hormones
The transverse biochemical and hormonal means of the PMDD and asymptomatic control groups are shown in Table 2. There were no statistically significant differences in the transverse means of calcium and the calcium-regulating hormones [total serum and ionized calcium, 25OHD, 1,25(OH)2D or intact PTH] between the groups. Although the screening baseline 24-h urine calcium was not found to be significantly different between the groups, the random urine calcium collections during hormonal sampling were significantly lower in the PMDD group compared with controls. Although all of the other transverse means were within their respective normal reference ranges, the mean 25OHD for both PMDD and control groups was less than 30 ng/ml. The intact PTH concentration was within the normal range for both groups (PMDD 54.7 pg/ml vs. controls 55.1 pg/ml, P = 0.88).
Hormone and biochemistry averages for PMDD (n = 68) and control (n = 47) subjects completing menstrual cycle serum sampling and between-groups comparison
| Measure | PMDD | Control | P value |
|---|---|---|---|
| Serum calcium (mg/dl) | 9.26 ± 0.26 (9.19–9.33) | 9.27 ± 0.20 (9.21–9.33) | 0.80 |
| Ionized calcium (mmol/liter) | 1.17 ± 0.03 (1.16–1.18) | 1.17 ± 0.03 (1.16–1.18) | 0.76 |
| Serum pH | 7.37 ± 0.02 (7.36–7.37) | 7.36 ± 0.02 (7.36–7.37) | 0.83 |
| Serum 25OHD (ng/ml) | 24.4 ± 11.1 (21.7–27.1) | 26.1 ± 10.8 (22.9–29.2) | 0.43 |
| Serum PTH (pg/ml) | 54.7 ± 18.3 (50.2–59.1) | 55.1 ± 14.5 (50.9–59.4) | 0.88 |
| Serum 1,25(OH)2D (pg/ml) | 48.5 ± 9.8 (46.1–50.9) | 49.0 ± 10.7 (45.8–52.1) | 0.81 |
| Random urine calcium (mg/g creatinine) | 63.3 ± 29.4 (56.2–70.5) | 80.6 ± 39.4 (69.0–92.2) | 0.01 |
| 24-h urine calcium (mg) | 131 ± 56 (117–145) | 149 ± 64 (130–168) | 0.13 |
| Serum magnesium (mg/dl) | 1.94 ± 0.14 (1.90–1.97) | 1.96 ± 0.11 (1.93–1.99) | 0.32 |
Results are shown as mean ± sd (95% confidence interval). Except for the 24-h urine calcium, the means were the averages of all measures across the menstrual cycle for the particular analyte. Student’s t test was used for comparison of differences between group means. In the PMDD group, 52 had eight samples drawn (76%), and 16 had nine samples drawn (24%) over the sampled cycle to determine the transverse mean. In the control group, four had seven samples (8%), 37 had eight samples (79%), and six had nine samples drawn (13%) over the sampled cycle to determine the transverse mean.
Mixed linear model analysis with fixed effects for group, time, and group by time interaction showed that the calcium-regulating hormones varied significantly across the menstrual cycle in both groups of subjects at this concentration of 25OHD (Fig. 2). Total serum calcium changed significantly over menstrual cycle phase (F4,361 = 10.128; P < 0.001), ionized calcium showed a significant group by phase interaction (F4,308 = 2.595; P = 0.04), intact PTH showed a significant main effect of phase (F4,400 = 5.52; P < 0.001), 1,25(OH)2D a significant group by phase interaction (F4,403 = 4.020; P = 0.003), pH a trend toward an effect of phase (F4,309 = 2.27; P = 0.06, data not shown), and urine calcium excretion an effect of group (F1,114 = 5.05; P < 0.03) and an effect of phase (F4,402 = 2.19; P = 0.07). There was little variation in 25OHD concentrations across the menstrual cycle (phase effect F4,397 = 0.12; P = 0.97). Serum magnesium (data not shown) also failed to show a main effect of group (F1,114 = 1.055; P = 0.31), phase (F4,400 = 1.55; P = 0.19), or group by phase interaction (F4,400 = 1.66; P = 0.16).
![Group average calciotropic hormone levels at each phase of the menstrual cycle (means and se). PMDD is solid line, and control is dotted line. Significant differences are shown for between-group differences and for within-group adjacent phase differences only [except for PTH and 1,25(OH)2D]; see text for comparisons between nonadjacent phases. *, indicates a between-group comparison difference with a P value < 0.05 at that phase; †, within-PMDD-group comparison between phases with a P value < 0.05; ‡, within-control-group comparison between phases with a P value < 0.05; ¶, within-group comparison in PTH between phases 2 and 4 for both PMDD and control groups with a P value < 0.05; §, within-control group comparison in 1,25(OH)2D between phases 1 and 5 with a P value < 0.05. Shown are total calcium (normal range, 8.8–10.1 mg/dl), ionized calcium (normal range, 1.15–1.29 mmol/liter), PTH (normal range, 10–65 pg/ml), 1,25(OH)2D (normal range, 15–60 pg/ml), 25OHD (normal range, 10–68 ng/ml), and urine calcium (spot) (normal range, 10–320 mg/g creatinine).](https://oup.silverchair-cdn.com/oup/backfile/Content_public/Journal/jcem/92/8/10.1210_jc.2006-2726/1/m_zeg0080752130002.jpeg?Expires=1750240508&Signature=C9Vw9qTn0c4swaCEMWZltf9YbjhOXrjelb1jKbJZO6IhMCvGpiFEvxHTqGVpEg50KQxhwy7VlLkZT3ycq8B~U1GjP72mAqkXPDx9FkYBurCOzu1NhMIBysm6Xa1sPAPWYdZy62vE5TQHwBQxzHT6JOWhYqaXI5HS2pIjgG0hd2p4~kymx8GfQbi-e-tbZThXxYBJjMtQ63nuq1LGVjNZhuGSxxow5v4ezfLm0th~I84bx6-S64fR2DK8sF50Jpd5Oce-nQSrMHyzB8b89NPUls4anR7d4fFOYZD4MhAPtDRuyVKQEjywhlTik67GOLJZ6BVchtJQMgRCq5y1BDHkUA__&Key-Pair-Id=APKAIE5G5CRDK6RD3PGA)
Group average calciotropic hormone levels at each phase of the menstrual cycle (means and se). PMDD is solid line, and control is dotted line. Significant differences are shown for between-group differences and for within-group adjacent phase differences only [except for PTH and 1,25(OH)2D]; see text for comparisons between nonadjacent phases. *, indicates a between-group comparison difference with a P value < 0.05 at that phase; †, within-PMDD-group comparison between phases with a P value < 0.05; ‡, within-control-group comparison between phases with a P value < 0.05; ¶, within-group comparison in PTH between phases 2 and 4 for both PMDD and control groups with a P value < 0.05; §, within-control group comparison in 1,25(OH)2D between phases 1 and 5 with a P value < 0.05. Shown are total calcium (normal range, 8.8–10.1 mg/dl), ionized calcium (normal range, 1.15–1.29 mmol/liter), PTH (normal range, 10–65 pg/ml), 1,25(OH)2D (normal range, 15–60 pg/ml), 25OHD (normal range, 10–68 ng/ml), and urine calcium (spot) (normal range, 10–320 mg/g creatinine).
Within-group differences across menstrual cycle phases and between-group comparisons at specific phases (phase 1, menses; phase 2, late follicular phase; phase 3, midcycle ovulatory phase; phase 4, early luteal phase; phase 5, late luteal phase) were made when a significant main effect of group, phase, or group by phase interaction warranted.
In the PMDD group (Fig. 2), total serum calcium was found to be significantly lower at 3 points: at follicular phase 1 (menses) (9.17 ± 0.55 mg/dl, P < 0.001) compared with later phases 2, 3, and 4; at midcycle phase 3 (9.25 ± 0.55 mg/dl) compared with phase 2 (9.33 ± 0.58 mg/dl, P = 0.036); and during late luteal phase 5 (9.18 ± 0.73 mg/dl) compared with phase 4 (9.27 ± 0.55 mg/dl, P = 0.018). Ionized calcium did not fluctuate as dramatically as did total calcium, but a large difference was noted between early phases 1 and 2 of the menstrual cycle again with phase 1 having the lowest ionized calcium concentration (1.166 ± 0.072 vs. 1.175 ± 0.073 mmol/liter, P = 0.069). Intact PTH peaked in follicular phase 2 (56.9 ± 35.3 pg/ml) following the decline in serum calcium during phases 1 and 5. Follicular phase intact PTH was significantly higher than luteal phase concentrations and reached its nadir in luteal phase 4 (50.9 ± 34.4 pg/ml, P < 0.01). In conjunction with the follicular phase rise in intact PTH, serum pH was lower in the follicular phase 1 and 2 compared with midcycle phase 3 and luteal phase 4 (phase 1, 7.36 ± 0.004 vs. phase 3, 7.37 ± 0.023; P = 0.015; data not shown). The concentration of 1,25(OH)2D declined precipitously in luteal phase 4 and was significantly lower compared with all earlier phases (phase 4, 45.0 ± 27.5 vs. phase 3, 49.6 ± 27.5 pg/ml; P = 0.006). Urine calcium and 25OHD concentrations did not appear to vary between individual phases in the PMDD group.
In the asymptomatic control group, similar variations for total serum calcium were demonstrated with follicular phase 1 (menses) significantly lower compared with phase 2 and 3 (phase 1, 9.21 ± 0.65 vs. phase 2, 9.34 ± 0.68 mg/dl; P = 0.002), and late luteal phase 5 total calcium significantly lower than phase 4 (9.17 ± 0.88 vs. 9.27 ± 0.68 mg/dl, P = 0.047). The intact PTH concentrations for follicular phases 1 and 2 and midcycle phase 3 were all significantly higher than luteal phase concentrations (phase 2, 57.9 ± 42.1 vs. phase 5, 49.9 ± 54.9 pg/ml; P = 0.006). Again, intact PTH concentrations peaked in the late follicular phase 2. The pH in early follicular phase 1 was significantly lower than later phases (phase 1, 7.36 ± 0.081 vs. phase 2, 7.37 ± 0.0.082; P = 0.02; data not shown). In contrast to the dramatic decline in 1,25(OH)2D during the luteal phase in the PMDD group, the concentration of 1,25(OH)2D in the control group progressively and significantly increased from follicular phase 1 (46.4 pg/ml) to late luteal phase 5 (52.1 pg/ml, P = 0.015). Urinary calcium excretion, in contrast to the PMDD group, showed significant phase variations. It progressively increased from early follicular phase to luteal phase and was significantly higher at late follicular, midcycle, and early luteal phases compared with early follicular phase 1 and late luteal phase 5 (phase 4, 86.8 ± 120.4 vs. phase 1, 68.7 ± 116.4 mg/g creatinine; P = 0.012). The 25OHD concentration did not significantly vary across the phases in the control group.
Between-group comparisons demonstrated ionized calcium at phase 1 (menses) to be significantly lower (1.166 ± 0.0.072 vs. 1.182 ± 0.087 mmol/liter, P = 0.027), urinary calcium excretion to be significantly lower at three of the five phases (late follicular phase 2, midcycle phase 3, and early luteal phase 4), and the concentration of 1,25(OH)2D to be significantly lower at luteal phase 4 (45.0 ± 27.52 vs. 50.6 ± 33.75 pg/ml, P = 0.032) in the PMDD group compared with asymptomatic controls.
Mixed-model analysis using individual days (2, 7, 11, 12–14, 22 , and 27), and not calculated phases as described above, demonstrated similar results in the variations of the calcium-regulating hormones across the menstrual cycle (data not shown). For both PMDD and control groups, a decline in total calcium concentration was noted at three points in time: at menses, at midcycle (d 13 in the PMDD and midcycle d 14 in the control), and during the late luteal phase d 27.
Examination of individual subject tracings of repeatedly measured hormone levels revealed substantial between-subject variation in both absolute levels and relative timing of sequential cascades of peak and valleys between measures. These tracings demonstrated the close relationship between ovulation and the peak of PTH.
Discussion
PMDD affects approximately 5% of women of reproductive age and can pose an enormous burden to women, their families, and society (18). It is distinct from other mood disorders because its recurrent symptom complex is closely related to the luteal phase of the menstrual cycle with minimal to nonexistent symptoms during the follicular phase. This luteal-phase disorder is known to disappear at menopause, remit with pregnancy, and improve with ovarian hormone suppression therapy such as with the gonadotropin-releasing agonists. Depression, irritability, and mood swings are prominent features of this disorder. To date, no biochemical or hormonal abnormality has ever been shown to explain the pathophysiology of this disorder (19). On the basis of previous studies linking abnormalities in calcium metabolism to disturbances in mood, this investigation has now found that the pattern of cyclical fluctuations in the calcium-regulating hormones, specifically ionized calcium, urine calcium, and 1,25(OH)2D, differs between women with PMDD and those without.
Although controversy exists as to the variability of the calcium-regulating hormones across the menstrual cycle (20, 21), we now confirm what many others have demonstrated that total serum and ionized calcium, intact PTH, 1,25(OH)2D, pH, and urinary calcium excretion all significantly vary across the menstrual cycle in premenopausal women. Serum calcium was found to decline at three points during the cycle: at menses, at midcycle, and during the late luteal half of the menstrual cycle. Intact PTH rose and peaked during the follicular phase in both PMDD and asymptomatic groups with pH notably lower during this same period. In the study of Pitkin et al. (22), the concentration of PTH in seven healthy premenopausal women progressively increased through the follicular phase of the cycle and peaked 30–35% above earlier follicular and late luteal phase concentrations in association with reduced ionized calcium concentrations. Similar midcycle fluctuations were observed for 1,25(OH)2D levels with a near doubling of its concentration compared with early follicular levels. In 1982, Gray et al. (23) measured the circulating concentrations of calcium and 1,25(OH)2D in seven normal women and found concentrations of 1,25(OH)2D on d 15 of the menstrual cycle to be double the concentrations noted on d 1 and 8. There was no detectable change in the total serum calcium level. Similarly, Tjellesen et al. (24) found a near doubling of the biologically active vitamin D metabolite at the time of ovulation in five healthy young premenopausal women, and Buchanan et al. (25) noted increased 1,25(OH)2D concentrations in 20 normal premenopausal women when serum estrogen levels peaked. In a study of 20 women, Chiu et al. (26) demonstrated that PTH was significantly higher during the follicular phase than luteal phase, and PTH was negatively correlated with estradiol, serum calcium, and urine calcium. Animal investigations in rodents, chicks, and quails have also provided evidence supporting cyclical changes in calcium metabolism during the estrous cycle (27, 28).
Very few investigations have reported the level of 25OHD as it relates to menstrual cyclicity of PTH and 1,25(OH)2D. Indeed, the concentration of 25OHD may modify calciotropic hormone menstrual cycle variability. We have previously reported that women with PMS are vitamin D deficient with midcycle elevations of PTH (12). Treatment of their vitamin D deficiency reduced symptomatology. A subsequent epidemiological case control study by Bertrone-Johnson et al. (29) reported that a high intake of calcium and vitamin D may also lower the risk of PMS. In this regard, our results encountered two unexpected findings. Both the PMDD and control groups were similarly vitamin D deficient, as defined by a level of less than 30 ng/ml (30, 31). Thus, vitamin D deficiency per se did not distinguish the groups from each other. However, the within-cycle metabolism of calcium and vitamin D was strikingly different between groups. The asymptomatic group appeared to have greater access to calcium stores, whereas the PMDD group had less. In the asymptomatic control group, the 1,25(OH)2D concentration, ionized calcium concentration, and urine calcium excretion progressively increased during the luteal phase. In the PMDD group, these indices did not change, or in the case of 1,25(OH)2D, there were significant declines. This observation is surprising, in part because estrogens are well known to modulate the metabolism of 25OHD by enhancing 1α-hydroxylase activity in the kidney (32). Because the concentration of estradiol peaks during the ovulatory and luteal phases of the menstrual cycle compared with the earlier follicular phase, it was anticipated that circulating 1,25(OH)2D would progressively rise and not decline during the latter half of the menstrual cycle as was demonstrated in the PMDD group. Potential mechanisms are of interest. Estrogen is believed to inhibit bone resorption and to antagonize the effects of PTH on bone (33). By inhibiting skeletal calcium release, estrogen lowers serum calcium, resulting in a compensatory increase in PTH with a rise in 1,25(OH)2D synthesis and enhanced gastrointestinal absorption of calcium (34). Any interference in the appropriate rise in 1,25(OH)2D concentrations may result in a relative vitamin D and calcium deficiency state with subsequent clinical manifestations. The PMDD group followed this unusual course, whereas the control group showed the expected adjustments.
Interestingly, the hormonal sequence of 1,25(OH)2D as it relates to PTH was notably different between the groups. 1,25(OH)2D usually follows the course of PTH. When PTH declines, 1,25(OH)2D usually follows. However, although this sequence did occur in the PMDD group during the luteal phase of the menstrual cycle, it did not occur in the control group. We cannot fully explain the hormonal dynamics behind this but surmise that opposing hormonal forces may be the underlying reason for this. PTH and estradiol are in some ways hormonal opponents on bone and calcium metabolism and antagonize each other’s actions (35). Then again, on the other hand, both estradiol and PTH stimulate the formation of 1,25(OH)2D via the 1α-hydroxylase enzyme. During the luteal phase, PTH declined in both groups, but in the control group, 1,25(OH)2D significantly increased from phase 1 to phase 5 with greater ensuing calcium reserves, whereas in the PMDD group, 1,25 (OH)2D declined with diminishing returns. The question, of course, arises as to which pattern is normal for the luteal phase. We cannot answer this question. However, because the control group was the asymptomatic group, the incremental increase in 1,25(OH)2D noted in the control group has been interpreted by us as a lack of responsiveness in the PMDD group. The PMDD group was not responding to the stimulatory actions of estradiol as the control group was.
This difference in pattern of the calciotropic hormones between these two groups of women was not apparent at the level of simple group means, nor was it seen when differences in menstrual cycle phase lengths were ignored. However, significant differences were reliably detectable when data were aligned in relation to the estrogen spike preceding ovulation.
In summary, differences in the pattern of cyclical changes in calcium and vitamin D metabolism across the menstrual cycle were demonstrated in women with PMDD compared with asymptomatic controls. The lack of compensatory responsiveness in vitamin D during the luteal phase may help explain some of the features of PMDD.
Acknowledgments
This work was supported, in part, by National Institutes of Health Grant DK57869-03 in conjunction with the National Institute of Mental Health and Institute of Women’s Health.
Disclosure Statement: D.M. and J.P.B have nothing to declare. S.T.-J. has an equity interest in Dannmarie LLC.
Abbreviations
- 1,25(OH)2D,
1,25-Dihydroxyvitamin D;
- 25OHD,
25 hydroxyvitamin D;
- PMDD,
premenstrual dysphoric disorder;
- PMS,
premenstrual syndrome;
- PMSD,
PMS diary.
References
American Psychiatric Association
