


Background: Despite the high prevalence of hypovitaminosis D in children and adolescents worldwide, the impact of vitamin D deficiency on skeletal health is unclear.
Methods: One hundred seventy-nine girls, ages 10–17 yr, were randomly assigned to receive weekly oral vitamin D doses of 1,400 IU (equivalent to 200 IU/d) or 14,000 IU (equivalent to 2,000 IU/d) in a double-blind, placebo-controlled, 1-yr protocol. Areal bone mineral density (BMD) and bone mineral content (BMC) at the lumbar spine, hip, forearm, total body, and body composition were measured at baseline and 1 yr. Serum calcium, phosphorus, alkaline phosphatase, and vitamin D metabolites were measured during the study.
Results: In the overall group of girls, lean mass increased significantly in both treatment groups (P ≤ 0.05); bone area and total hip BMC increased in the high-dose group (P < 0.02). In premenarcheal girls, lean mass increased significantly in both treatment groups, and there were consistent trends for increments in BMD and/or BMC at several skeletal sites, reaching significance at lumbar spine BMD in the low-dose group and at the trochanter BMC in both treatment groups. There was no significant change in lean mass, BMD, or BMC in postmenarcheal girls.
Conclusions: Vitamin D replacement had a positive impact on musculoskeletal parameters in girls, especially during the premenarcheal period.
VITAMIN D IS essential for bone growth and development in children and for skeletal health in adults (1). Although rickets is rare in developed countries, it is one of the five most prevalent diseases in developing countries. We and others have reported a high prevalence of more subtle degrees of vitamin D insufficiency in normal children and adolescents worldwide (2–10). We have demonstrated that girls were at higher risk for low vitamin D levels than boys due to lower sun exposure and decreased exercise (2). This problem was most prevalent in boys and girls of low socioeconomic status and in veiled girls (2).
In adolescents, there is an inverse relationship between serum 25-hydroxyvitamin D [25(OH)D] levels and PTH levels (2, 5, 7, 10) and a positive association between serum 25(OH)D levels and bone mineral density (BMD) (7, 9), similar to what has been reported in adults (11). In the elderly, vitamin D supplements increase grip strength (12), and muscle mass is an excellent predictor of BMD (13).
Nutrition guidelines targeted to children and adolescents to optimize bone health have focused on calcium and exercise, but have neglected vitamin D (14, 15). To date, there is no recommended dietary allowance for vitamin D for children and adolescents (16, 17) due to the lack of any evidence for a beneficial effect of supplementation in this age group.
In this study, we hypothesized that treatment with high-dose vitamin D would optimize gains in muscle mass, BMD, and bone mineral content (BMC) in adolescent girls compared with low-dose vitamin D and placebo. We anticipated that the most substantial increments would be noted in premenarcheal girls.
Subjects and Methods
Subjects
Three hundred sixty-three healthy children and adolescents were recruited between December 2001 and June 2002. Recruitment took place in four schools from the greater Beirut area to ensure balanced representation geographically and socioeconomically (18). The age group chosen was 10–17 yr, a critical age for accretion of bone mass (19). In boys, there was no consistent positive effect of vitamin D supplementation on lean mass, BMD, or BMC (20). Therefore, in this paper we report the results of the trial in 179 girls.
Subjects were included in the study if they were considered healthy based on careful physical examination and absence of a history of any disorders or medications known to affect bone metabolism (18). At entry, all had normal serum calcium, phosphorus, and alkaline phosphatase levels for age. The study was approved by the institutional review board, and informed consent was obtained from all study subjects and their parents.
Intervention
The subjects were randomly assigned in a double-blind manner to receive weekly placebo oil or a vitamin D3 preparation, given as low-dose vitamin D (1,400 IU; 35 μg/wk), i.e. the equivalent of 200 IU/d, or high-dose vitamin D (14,000 IU; 350 μg/wk), i.e. the equivalent of 2,000 IU/d (Vigantol oil, Merck KGaA, Darmstadt, Germany) for 1 yr. The randomization sequence, stratified by socioeconomic status, was generated by a computer at Merck headquarters, mailed to the study center, and administered by a senior pharmacist. All students received identical bottles of an oily solution containing diluent oil for the placebo group, diluted vigantol oil for the low-dose group, or undiluted oil for the high-dose group. The low dose, i.e. the equivalent of 200 IU/d, corresponds to the current adequate intake for vitamin D in this age group (16). The high dose, i.e. the equivalent of 2000 IU/d, was chosen as half the dose demonstrated to be safe in adults, resulting in desirable serum 25(OH)D levels (21), and had been confirmed to be safe in a 12-wk pilot study conducted in school children at our center. There were no differences in months of recruitment among the three treatment arms. The subjects were called by study personnel every 2 wk to prompt them to take the study drug. Subjects returned the bottles and received new bottles every 3 months. Compliance was checked by measuring the volume and, therefore, the amount of vitamin D left in the returned bottles. The percentage of the dose taken was calculated as (total volume − returned volume)/total volume × 100. Dietary calcium intake was comparable across treatment groups and was not controlled for.
Quality assurance
The samples of oil solution prepared for the three treatment groups were assayed at the clinical pathology laboratory of Mt Sinai Hospital (Toronto, Canada; by R.V.). The vitamin D concentration in the three solutions was within 10% of that anticipated based on the label on the bottles and the dilution protocol.
Data collection
The subjects had a baseline physical examination, including height, weight, and Tanner stages. Standing height was measured in triplicate using a wall stadiometer; weight was recorded with the subjects wearing light clothes without shoes using a standard clinical balance. Pubertal status was determined by a physician (H.K., M.N., or M.C.), according to the established criteria of Tanner (22). Calcium intake, exercise, sun exposure, and history of fractures were assessed by questionnaire at baseline and follow-up (18). Exercise frequency was assessed on the basis of a questionnaire inquiring about the average number of hours spent on sports per week. Calcium intake was assessed through a food frequency questionnaire that stressed the consumption of dairy products by adolescents in our population. Sun exposure was assessed as the average number of hours spent in the sun for weekdays and weekends, and the prorated average was reported. Vitamin D dietary intake was not evaluated. Grip strength was measured using a squeeze grip ball with a pressure gauge to measure grip strength; the average of triplicates measured at baseline and study end was used (pneumatic squeeze dynamometer, catalogue no. FAB 12-0293, Ingrams, Kansas City, MO). The mean (±sd) coefficient of variation (CV), based on 363 triplicate measurements, was 3.3 ± 3.2%. Information on sick days was obtained from school records and by self report if school records were not available. These analyses were preplanned because of the reported effect of vitamin D on the immune system (23).
The vitamin D dose was usually taken on the weekends. The timing of blood drawing was not systematically standardized, but occurred on any weekday except Sunday. Serum calcium, phosphorus, and alkaline phosphatase were measured at baseline, 6 months, and 12 months. Blood for hormonal studies was stored as serum at −70 C. Serum 25(OH)D was measured at baseline and 12 months by a competitive protein binding assay using the Incstar Kit (Diasorin, Incstar, Saluggia, Italy), with intra- and interassay CVs less than 13% at a serum concentration of 47 ng/ml. Serum 1,25-dihydroxyvitamin D (1,25(OH)2D) was measured by RIA using the IDS kit with intra- and interassay CVs less than 10% at serum concentrations between 10 and 100 pg/ml (IDS Immuno-Diagnostic Systems, Boldon, UK). Hypovitaminosis D was defined as 25(OH)D below 20 ng/ml (24). All samples from an individual subject were assayed together in the same run at the end of the study. BMD and BMC of the lumbar spine, hip, and forearm and subtotal BMD, BMC, and composition were measured at baseline and 1 yr using a Hologic 4500A densitometer (Hologic, Bedford, MA; software version 11.2:3). The software determines BMC, fat mass, and nonfat soft tissue mass, identified in the software as lean mass. Because inclusion of the head BMD in the calculation of total body BMD may lower the predictive value of some parameters for this variable, subtotal body measurements, excluding the head, were used in the analyses (25). In our center, the mean ± sd precision of the BMD measurements, expressed as the CV, for 280 same-day duplicate scans performed during the study duration was less than 1.2 ± 0.9% for the spine, total hip, femoral neck, trochanter, and one third radius. Similar values were obtained for total body BMD and BMC, lean mass, and fat mass. The mean ± sd precisions of the 280 duplicate BMC measurements, expressed as the CV, were 1.2 ± 1.1% for the spine, 1.5 ± 1.8% for the total hip, 2.1 ± 1.7% for the femoral neck, 2.8 ± 2.1% for the trochanter, and 1.1 ± 1.1% for the forearm.
Statistical analyses
Primary efficacy outcomes were percent change in lean mass and percent change in BMD and BMC at the lumbar spine and total body; these were the most established skeletal sites in children at the time the study was started.
Secondary efficacy outcomes were percent changes in bone mass at other skeletal sites. Exploratory preplanned analyses in subgroups determined by menarcheal status at study entry were performed. Because of the significant impact of growth in children on bone size and areal BMD and the potential impact of vitamin D supplementation on bone growth and lean mass, both strong correlates of areal BMD and BMC, we also evaluated the impact of the intervention on bone size, as assessed by bone area and height. To dissect the physiological pathway mediating the impact of vitamin D on skeletal parameters, the impact of treatment on BMD and BMC was assessed after adjusting for changes in lean mass and bone area. This was done when there was a significant effect of treatment on areal BMD or BMC, lean mass, or bone area in the unadjusted analyses, using linear regression analysis. Because the effect of treatment, low-dose vs. high-dose vitamin D, on percent change in bone mass could not be assumed to be linear, treatment was entered as a dummy variable.
The results reported are those based on an intent to treat analysis, which were identical with the results of per protocol analyses in view of the very high compliance of subjects and the fact that those who retuned for follow-up visits and BMD measurements were all taking the study medications (Fig. 1).
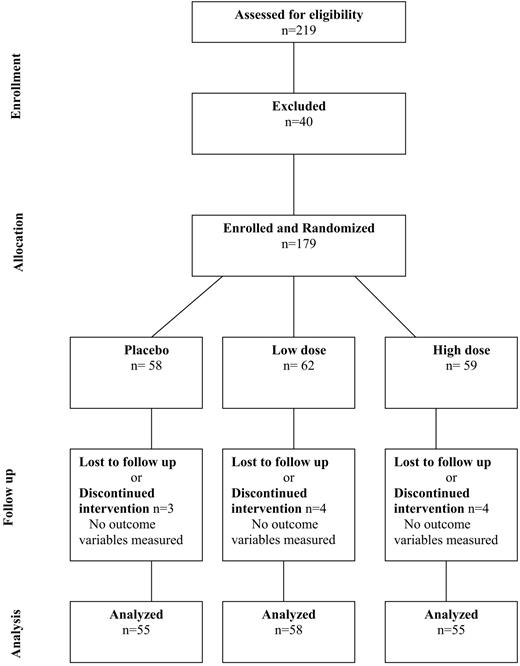
Diagram outlining the flow of the study subjects through all stages of the trial. Of the 219 subjects who originally verbally agreed to participate in the study, 40 were excluded for the following reasons: two did not meet the inclusion criteria, three had originally misstated their age, six had abnormal baseline blood values, five were inaccessible, and 24 changed their minds about participation.
To demonstrate a difference of 3% (sd, 5%) in the percent change in lumbar spine BMD between the placebo and any of the two treatment groups, 44 subjects/treatment group would be needed (α = 0.05; power, 80%; Instat PRISM, Applied Biosystems, San Diego, CA). This would translate into 132 subjects. We aimed to recruit 180 subjects to allow for potential dropouts and for exploratory analyses by pubertal stages.
ANOVA was used for evaluating the difference among the three treatment groups. The least significant difference test was implemented to explore the differences among subgroups (placebo vs. low-dose vitamin D, placebo vs. high-dose vitamin D, and low-dose vitamin D vs. high-dose vitamin D). The nonparametric Kruskal-Wallis and Mann-Whitney U tests were used to detect differences between treatment groups for premenarcheal girls due to the small sample size.
Analyses were carried out using SPSS software, version 11.0 (SPSS, Inc., Chicago, IL). There were a total of 64 siblings among the subjects; however, only 16 siblings fell within comparable treatment arms by pubertal status (as specified in Table 1). Thus, cluster analyses were performed using STATA version 7 (STATA, College Station, TX) to adjust for lack of independence among siblings due to heredity and possible familial resemblance. The STATA program does that by increasing the estimated se values and the variance of the β coefficients. Results were expressed as the mean ± sd. P < 0.05 was considered statistically significant and was not adjusted for multiple testing.
Baseline characteristics by treatment group in the overall group of girls and by menarcheal status
| Variable | All Girls | Premenarcheal | Postmenarcheal | ||||||
|---|---|---|---|---|---|---|---|---|---|
| PBO (n = 55) | Low (n = 58) | High (n = 55) | PBO (n = 8) | Low (n = 12) | High (n = 14) | PBO (n = 47) | Low (n = 46) | High (n = 41) | |
| Siblings (n) | 8 | 6 | 2 | 0 | 0 | 0 | 8 | 6 | 2 |
| Age (yr) | 13.6 (2.1) | 13.0 (2.1) | 13.1 (2.2) | 10.9 (0.6) | 10.6 (0.6) | 10.8 (1.1) | 14.0 (1.9) | 13.6 (2.0) | 13.9 (1.8) |
| Height (cm) | 154 (10) | 152 (9) | 152 (10) | 142 (8) | 141 (9) | 140 (7) | 156 (9) | 154 (7) | 156 (8) |
| Weight (kg) | 48 (11) | 47 (11) | 47 (13) | 37 (11) | 35 (8) | 36 (8) | 50 (10) | 50 (10) | 51 (12) |
| Calcium intake (mg/d) | 672 (323) | 674 (364) | 686 (411) | 805 (430) | 811 (383) | 816 (570) | 650 (301) | 638 (354) | 642 (338) |
| Exposure to sun (h/wk) | 8.1 (6.0) | 7.4 (5.9) | 6.6 (4.2) | 6.4 (4.6) | 4.5 (3.6) | 5.7 (3.5) | 8.4 (6.2) | 8.2 (6.1) | 6.8 (4.4) |
| Exercise (h/wk) | 4.1 (5.0) | 3.4 (4.0) | 4.0 (5.6) | 0.7 (1.0) | 5.7 (5.6) | 2.5 (4.9) | 4.7 (5.1) | 2.8 (3.2) | 4.4 (5.7) |
| Grip strength (psi) | 11.5 (2.2) | 11.0 (2.2) | 10.9 (2.2) | 9.1 (2.1) | 9.0 (2.1) | 8.9 (2.1) | 12.0 (2.0) | 11.5 (2.0) | 11.6 (1.8) |
| Lumbar spine BMC (g) | 41.1 (12.0) | 37.6 (10.7) | 39.2 (12.9) | 25.2 (6.4) | 25.0 (5.2) | 27.4 (6.3) | 43.8 (10.6) | 40.9 (9.2) | 43.2 (12.1) |
| 1/3 radius BMC (g) | 1.4 (0.2) | 1.3 (0.2) | 1.3 (0.3) | 1.0 (0.1) | 1.0 (0.2) | 1.0 (0.2) | 1.4 (0.2) | 1.4 (0.2) | 1.4 (0.3) |
| Total hip BMC (g) | 24.3 (5.4) | 22.8 (5.5) | 22.6 (5.9) | 17.2 (5.3) | 15.8 (4.2) | 17.0 (3.8) | 25.5 (4.4) | 24.7 (4.2) | 24.4 (5.3) |
| Femoral neck BMC (g) | 3.3 (0.7) | 3.3 (0.7) | 3.3 (0.7) | 2.4 (0.7) | 2.5 (0.5) | 2.6 (0.5) | 3.5 (0.6) | 3.5 (0.5) | 3.5 (0.7) |
| Trochanter BMC (g) | 6.3 (1.5) | 5.9 (1.7) | 5.9 (1.7) | 4.6 (1.3) | 4.0 (1.4) | 4.7 (1.5) | 6.6 (1.4) | 6.4 (1.4) | 6.3 (1.6) |
| Total body BMC (kg) | 1.2 (0.3) | 1.1 (0.3) | 1.1 (0.4) | 0.8 (0.2) | 0.7 (0.2) | 0.8 (0.2) | 1.3 (0.3) | 1.2 (0.2) | 1.2 (0.3) |
| Lean mass (kg) | 30.7 (6.0) | 29.3 (5.5) | 29.5 (6.5) | 23.5 (4.9) | 22.9 (4.4) | 23.0 (4.2) | 31.9 (5.3) | 31.1 (4.5) | 31.7 (5.6) |
| % Fat mass | 28 (6) | 29 (7) | 28 (7) | 27 (11) | 26 (7) | 26 (8) | 28 (5) | 30 (7) | 29 (7) |
| S-Ca (mg/dl) | 10.0 (0.4) | 9.9 (0.3) | 9.9 (0.4) | 9.9 (0.4) | 9.9 (0.3) | 10.0 (0.3) | 10.0 (0.4) | 9.9 (0.4) | 9.8 (0.4) |
| S-PO4 (mg/dl) | 4.4 (0.5) | 4.3 (0.5) | 4.3 (0.7) | 4.7 (0.4) | 4.6 (0.6) | 4.7 (0.4) | 4.4 (0.5) | 4.3 (0.5) | 4.1 (0.8) |
| S-ALKP (IU/liter) | 199 (116) | 208 (112) | 232 (139) | 298 (92) | 275 (65) | 332 (75) | 182 (112) | 191 (116) | 198 (141) |
| S-25(OH)D (ng/ml) | 14 (7) | 14 (9) | 14 (8) | 13 (7) | 15 (6) | 14 (5) | 14 (8) | 14 (10) | 14 (8) |
| S-1,25(OH)2D (pg/ml) | 86 (30) | 78 (29) | 83 (27) | 84 (27) | 87 (29) | 90 (29) | 84 (32) | 74 (29) | 82 (27) |
Values are means (sd). The biochemical assays are reported in metric units (SI). To convert from metric to SI units, multiply calcium by 0.25 (mmol/liter); phosphorus by 0.32 (mmol/liter); 25(OH)D by 2.496 (nmol/liter); and 1,25(OH)2D by 2.6 (pmol/liter). PBO, Placebo.
Results
Study subjects and baseline characteristics
Of the 179 subjects enrolled and randomly assigned to a treatment group, 168 (94%) returned for follow-up BMD scans and constituted the group on whom the intent to treat analyses were based (Fig. 1); at study entry, 34 were premenarcheal, and 134 were postmenarcheal. The baseline characteristics of the subjects, including bone area and bone density, serum 25(OH)D level, anthropometric and lifestyle-related variables, were similar among the treatment groups and in the menarcheal subgroups (Table 1).
At study entry, the mean serum 25(OH)D level was 14 ± 8 ng/ml. There were significant associations between baseline serum 25(OH)D levels and spine BMD (r = 0.16; P = 0.033), femoral neck BMD (r = 0.17; P = 0.028), radius BMD (r = 0.24; P = 0.002). Similarly, there was a significant association between baseline serum 25(OH)D levels and radius BMC (r = 0.16; P = 0.033).
Response to treatment: serum 25(OH)D levels, lean mass, BMC, and bone mineral mass
In subjects assigned to the high-dose vitamin D group, 25(OH)D levels reached a mean of 38 ± 31 ng/ml in the overall group and 28 ± 9 ng/ml in the premenarcheal group (Table 2). Conversely, levels remained in the low to midteens in the placebo and low-dose arms (Table 2). Serum 1,25(OH)2D levels increased with the high dose (Table 2).
Serum levels of vitamin D metabolites and percent change in BMC, lean mass, bone area, grip strength, height, and weight at 1 yr by treatment group, in the overall group of girls and in premenarcheal girls
| PBO | Low | High | P overall | P value | |||
|---|---|---|---|---|---|---|---|
| PBO vs. Low | PBO vs. High | Low vs. High | |||||
| Overall1 | |||||||
| S-25 (OH)D (ng/ml) | 16 (8) | 17 (6) | 38 (31) | <0.001 | NS | <0.001 | <0.001 |
| S-1,25(OH)2D (pg/ml) | 76 (30) | 78 (30) | 105 (33) | <0.001 | NS | <0.001 | <0.001 |
| LS BMC (%) | 10.8 (8.5) | 14.5 (12.0) | 12.9 (10.4) | 0.20 | NS | NS | NS |
| LS area (%) | 4.0 (4.6) | 5.0 (6.3) | 4.3 (5.4) | 0.61 | NS | NS | NS |
| Total hip BMC (%) | 7.8 (7.7) | 11.2 (9.3) | 12.8 (10.5) | 0.02 | 0.05 | 0.005 | NS |
| Total hip area (%) | 2.4 (4.5) | 4.0 (4.6) | 5.7 (5.8) | 0.003 | NS | 0.001 | NS |
| FN BMC (%) | 3.9 (7.2) | 4.4 (7.8) | 5.2 (8.0) | 0.70 | NS | NS | NS |
| FN area (%) | 0.7 (4.9) | 0.03 (4.8) | 0.8 (5.4) | 0.67 | NS | NS | NS |
| Trochanter BMC (%) | 9.4 (13.3) | 13.6 (14.8) | 14.2 (17.2) | 0.20 | NS | NS | NS |
| Trochanter area (%) | 4.7 (8.6) | 6.8 (9.2) | 7.8 (11.5) | 0.24 | NS | NS | NS |
| Sub total body BMC (%) | 8.7 (8.8) | 11.3 (10.4) | 12.0 (11.3) | 0.20 | NS | NS | NS |
| Total body area (%) | 5.0 (4.7) | 6.1 (5.7) | 6.2 (5.8) | 0.43 | NS | NS | NS |
| Sub total body lean mass (%) | 5.7 (6.6) | 8.7 (8.0) | 9.0 (8.3) | 0.05 | 0.042 | 0.027 | NS |
| Grip strength (%) | 13.5 (18.5) | 20.1 (19.7) | 17.4 (16.0) | 0.16 | NS | NS | NS |
| Height (%) | 2.0 (1.8) | 2.7 (2.3) | 2.8 (2.4) | 0.10 | NS | NS | NS |
| Weight (%) | 8.6 (7.8) | 8.8 (8.3) | 9.7 (8.5) | 0.74 | NS | NS | NS |
| Premenarche2 | |||||||
| S-25 (OH)D (ng/ml) | 11 (6) | 16 (5) | 28 (9) | <0.001 | NS | <0.001 | <0.001 |
| S-1,25(OH)2D (pg/ml) | 73 (20) | 79 (32) | 113 (38) | 0.02 | NS | 0.014 | 0.016 |
| LS BMC (%) | 12.0 (9.9) | 18.8 (13.0) | 17.2 (10.2) | 0.40 | NS | NS | NS |
| LS area (%) | 3.4 (7.0) | 3.2 (9.5) | 4.4 (7.7) | 0.93 | NS | NS | NS |
| Total hip BMC (%) | 12.3 (12.4) | 18.4 (9.1) | 23.2 (11.0) | 0.08 | NS | NS | NS |
| Total hip area (%) | 7.4 (7.5) | 8.0 (4.4) | 12.3 (6.5) | 0.11 | NS | NS | NS |
| FN BMC (%) | 7.4 (4.5) | 9.3 (9.3) | 11.4 (7.9) | 0.50 | NS | NS | NS |
| FN area (%) | 5.0 (3.2) | 2.7 (5.5) | 4.9 (5.2) | 0.45 | NS | NS | NS |
| Trochanter BMC (%) | 12.5 (11.3) | 32.2 (15.9) | 25.7 (20.8) | 0.05 | 0.018 | NS | NS |
| Trochanter area (%) | 5.7 (8.1) | 18.4 (8.9) | 14.2 (15.0) | 0.08 | 0.024 | NS | NS |
| Sub total body BMC (%) | 15.4 (8.0) | 19.9 (7.1) | 21.8 (9.4) | 0.20 | NS | NS | NS |
| Total body area (%) | 7.4 (3.9) | 11.4 (4.0) | 11.6 (4.2) | 0.06 | NS | NS | NS |
| Sub total body lean mass (%) | 10.7 (5.2) | 16.8 (6.6) | 18.1 (6.7) | 0.04 | 0.046 | 0.013 | NS |
| Grip strength (%) | 25.1 (30.6) | 26.5 (17.8) | 21.2 (16.9) | 0.81 | NS | NS | NS |
| Height (%) | 3.8 (1.5) | 5.0 (1.4) | 5.6 (1.3) | 0.07 | NS | NS | NS |
| Weight (%) | 14.9 (5.2) | 15.3 (4.7) | 18.4 (6.2) | 0.25 | NS | NS | NS |
Values are means (sd). LS, Lumbar spine; FN, femoral neck; PBO, placebo; NS, not significant.
Overall P value and post hoc P values between subgroups by ANOVA.
Overall P value by nonparametric test due to small sample size.
In the overall group of girls, there was a significant increase in lean mass, a primary efficacy end point, but not in grip strength (Table 2), in both vitamin D groups compared with the placebo group. There was a trend for larger increments in BMC in both treatment groups compared with placebo at several skeletal sites; these increments were statistically significant for total hip BMC (Table 2). There were significant negative correlations between baseline serum 25(OH)D levels and percent change spine BMD (r = −0.16; P = 0.044) or percent change in subtotal body BMD (r = −0.20; P = 0.009; post hoc analyses). Similarly, there were significant associations between baseline serum 25(OH)D levels and percent change in spine BMC (r = −0.20; P = 0.010), percent change in femoral neck BMC (r = −0.16; P = 0.037), and percent change in radius BMC (r = −0.17; P = 0.029).
Exploratory subgroup analyses in premenarcheal girls revealed a significant increase in lean mass, a primary efficacy end point, but not in grip strength (Table 2), in both treatment groups. Similarly, there was a consistent trend for increments in BMC (Table 2) and BMD (data not shown) at several skeletal sites in both treatment groups in a dose-dependant pattern, reaching significance at trochanteric BMC (Table 2 and Fig. 2) and at the lumbar spine BMD, a primary end point (P = 0.04), and almost reaching significance at the total hip BMD (P = 0.06). There were no differences in changes in lean mass, grip strength, BMD, or BMC among the three treatment groups in postmenarcheal girls (data not shown).
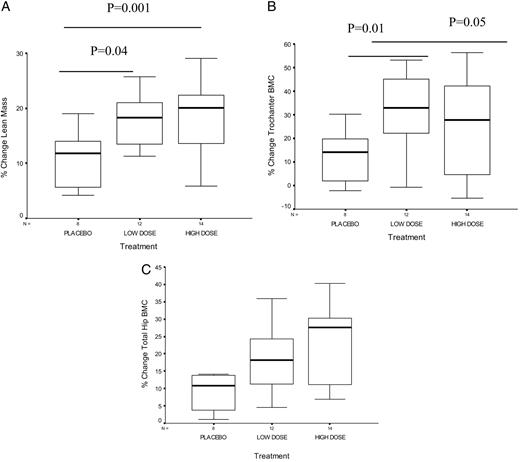
Box plots showing the median and interquartile range of the percent change in lean mass (A), the percent change in hip trochanteric BMC (B), and the percent change in total hip BMC (C) by treatment group in premenarcheal girls. P values displayed represent results from post hoc t testing on ANOVA. There was a significant effect of treatment on changes in lean mass and changes in trochanteric BMC at both doses. There was a trend for a significant effect of treatment on percent changes in total hip BMC in premenarcheal girls.
Effect of vitamin D supplementation on changes in height, weight, and bone area (surrogates of changes in bone size)
There were no differences among the three treatment groups in changes in weight in the overall group or by menarcheal category (Table 2). There was a trend for an increase in height with vitamin D supplementation that almost reached significance (P = 0.07; Table 2). There was an effect of treatment on bone area at several skeletal sites where a significant treatment effect on BMC was noted (Table 2).
Adjusted analyses for changes in bone area and lean mass
Regression analyses were conducted to further elucidate the physiological pathway for the effect of vitamin D on BMC and BMD. The introduction of percent change in area or percent change in lean mass as covariates in the model caused a decrease in the strength of the treatment effect on BMC or BMD, as reflected by a decrease in the β estimate (data not shown) and an increase in the P value for the primary end point (lumbar spine BMD) and the secondary end points (hip BMD, hip BMC, and trochanter BMC; Table 3).
Multivariate analyses relating the effect of vitamin D treatment on BMD/BMC without and then after adjusting for bone area, lean mass, and both by treatment assignment
| Skeletal site | Predictor | P value |
|---|---|---|
| All girls | ||
| LS BMD (primary efficacy endpoint) | Low dose | 0.04 |
| Low dose + % area | 0.57 | |
| Low dose + % lean mass | 0.40 | |
| Low dose + % area % lean mass | 0.40 | |
| Hip BMC (secondary efficacy endpoint) | Low dose | 0.04 |
| Low dose + % area | 0.30 | |
| Low dose + % lean mass | 0.50 | |
| Low dose + % area, % lean mass | 0.70 | |
| High dose | 0.005 | |
| High dose + % area | 0.007 | |
| High dose + % lean mass | 0.07 | |
| High dose + % area, % lean mass | 0.40 | |
| Premenarcheal girls: exploratory preplanned analyses | ||
| LS BMD (primary efficacy endpoint) | Low dose | 0.007 |
| Low dose + % area | 0.009 | |
| Low dose + % lean mass | 0.20 | |
| Low dose + % area, % lean mass | 0.20 | |
| Hip BMC (secondary efficacy endpoint) | High dose | 0.045 |
| High dose + % area | 0.09 | |
| High dose + % lean mass | 0.40 | |
| High dose + % area, % lean mass | 0.50 | |
| Hip BMD (secondary efficacy endpoint) | Low dose | 0.02 |
| Low dose + % area | 0.005 | |
| Low dose + % lean mass | 0.30 | |
| Low dose + % area, % lean mass | 0.10 | |
| High dose | 0.02 | |
| High dose + % area | 0.09 | |
| High dose + % lean mass | 0.40 | |
| High dose + % area, % lean mass | 0.60 | |
| Trochanter BMC (secondary efficacy endpoint) | Low dose | 0.003 |
| Low dose + % area | 0.50 | |
| Low dose + % lean mass | 0.07 | |
| Low dose + % area, % lean mass | 0.80 |
Compliance with study drug, adverse events, and safety
One hundred sixty-six subjects returned their study bottles. The mean percent intake of the total dose given for vitamin D was 98 ± 3% in the placebo group, 98 ± 3% in the low-dose group, and 97 ± 3% in the high-dose group.
The treatment was very well tolerated. Only two subjects (1%) had serum calcium levels above the upper limit of normal for children (10.7 mg/dl) (26) at 1 yr. The serum calcium values were 10.8 and 11.1 mg/dl, and they were both in the placebo group. Similarly, three subjects (1.5%) had high serum 25(OH)D levels at the end of the study (103, 161, and 195 ng/ml); all were in the high-dose group, but none had concomitant hypercalcemia.
Eleven girls (6.1%) dropped out of the study (Fig. 1). There were no differences in dropout rates by treatment group. The reasons for dropout included being afraid of needle sticks, unable to make appointments, disliking the taste of the medication, and changing their mind about the study. One girl dropped out at 7 months because of the development of glomerulonephritis, documented by biopsy, and treated as poststreptococcal glomerulonephritis. The treatment code was broken, and she was in the low-dose vitamin D treatment group.
The average number of sick days per year was the same for all three treatment groups, averaging 2 d/yr. There was no effect of treatment on self-reported incident fractures.
Discussion
Vitamin D supplementation for 1 yr resulted in substantial increments in lean mass, bone area, and bone mass in girls ages 10–17 yr and was well tolerated. There was a trend for the increments in bone mass to be larger at the high dose, especially in the subgroup of premenarcheal girls.
A high prevalence of hypovitaminosis D has been reported in children and adolescents worldwide (2–10). Its importance was underscored at a recent conference organized by the United States National Institutes of Health, during which “an alarming prevalence of low circulating levels of vitamin D” was noted (27). The most well-recognized function of vitamin D is to increase dietary calcium and phosphate absorption (1, 16), but the impact of hypovitaminosis D, as opposed to severe deficiency, on musculoskeletal health in children and adolescents is still unclear. A beneficial effect of vitamin D replacement in this group had not been established, to our knowledge, before this trial.
Preliminary results from a 1-yr, randomized, placebo-controlled trial conducted in Danish girls (mean age, 11 yr) revealed no significant effect of vitamin D, given in relatively low doses of 200 and 400 IU/d, on whole-body and lumbar spine BMC (28). The differences in treatment effect between that trial and the current one may have been due to differences in the baseline characteristics of the study subjects, including mean calcium intake and severity of hypovitaminosis D, the differences in doses, or a combination of both. The doses of vitamin D used in the Danish trial were substantially lower than the high dose used in our trial, the dose at which the most consistent treatment effect was noted. The small increments in serum 25(OH)D levels achieved in the Danish trial, averaging 3–4 ng/ml, may potentially explain the failure to detect any impact of therapy on BMC (28). Although we noted a comparably small serum 25(OH)D response in the subjects receiving the equivalent of 200 IU/d, the dose was taken weekly and would have resulted in pulses of serum 25(OH)D that may have different effects from taking a daily dose of 200 IU.
The beneficial treatment effect noted in the overall group of girls was paralleled by even more substantial increments in BMC in premenarcheal girls, whereas no effect was detected in postmenarcheal girls. This is consistent with observations from calcium and exercise trials demonstrating an impact of the intervention when administered to younger girls (29–31) and defining the most substantial benefit to occur before or within a narrow time window around menarche (29, 32, 33). It is also possible that a putative protective effect of vitamin D on bone may have been overshadowed by the powerful effects of puberty on skeletal growth.
As anticipated, the most substantial increments in bone mass were in subjects with the lowest vitamin D levels at entry for the high-dose arm, but not the low-dose arm, at the primary end points, spine BMD and subtotal body BMC. The beneficial effect of vitamin D on bone mass in girls may be mediated though one or more physiological pathways. Although intestinal calcium absorption was not assessed in this trial, this effect of vitamin D is unequivocal (34). The relationship among vitamin D, muscle function, and body weight are well established in the elderly (12), but we are unaware of any such observations in young adolescents. The increments in lean mass noted in this trial are consistent with a direct effect of vitamin D on muscle, in part mediating its beneficial effect on BMD and BMC. Our group and others have observed close correlations between lean mass or muscle mass and bone mass (35–37). The lack of a detectable effect of treatment on grip strength could be explained by the low sensitivity of that measurement (38). To our knowledge, there are no studies relating vitamin D supplementation to changes in bone size. Previous studies evaluating the effect of calcium or calcium and vitamin D have reported increases in bone area or height (30, 31, 39, 40), suggesting an effect of calcium on bone modeling (31). An increased intake of protein and an increase in growth factors could explain the anabolic effect of milk intervention on bone (31, 40). The presence of treatment differences in bone area at cortical sites and the trend for treatment differences in height are consistent with an effect of vitamin D on modeling and bone growth. This may be explained by a direct effect of vitamin D on periosteal apposition or indirectly through lean mass/muscle mass, thus exerting an anabolic effect on long bones. The decrements in the magnitude of the β estimates relating the impact of vitamin D to changes in BMD and BMC when adjusting for lean mass, bone area, or both, further underscore the roles of these predictors in the causal pathway between vitamin D and bone mass. The improved bone health may have been due to increases in 1,25(OH)2D levels, 25(OH)D levels, or both. 1,25(OH)2D can be produced locally, thus rendering it impossible to dissect the above possibilities based on the observed changes in serum levels of these substances (41).
The positive skeletal response to vitamin D replacement in girls contrasts with the lack of any positive response in boys (20). The sexual dimorphism in response to vitamin D supplementation may have several explanations. Boys had a higher calcium intake and exercised more than girls. There were also gender differences in the severity of hypovitaminosis D at baseline, differences in the serum 1,25(OH)2D levels achieved, and the lack of an increase in lean mass and bone area in boys, contrary to what was observed in girls (20). Furthermore, sex differences in the hormonal profiles achieved during puberty could explain the differences in the relationship between muscle and bone in boys and girls (18, 37).
Treatment was well tolerated overall. Compliance, as estimated by the volume of drug left in the returned bottles, was excellent. It is possible that subjects may have manipulated the volume returned, discarding the study drug, thus leading to an overestimation of the compliance. This is unlikely due to the fact that subjects were contacted every 2 wk to remind them to take the study drug. Although a few subjects had high serum 25(OH)D levels, there was no evidence of vitamin D toxicity. In the three subjects with high levels of vitamin D, not a single one experienced concomitant hypercalcemia.
Our study has several limitations. Dual-energy x-ray absorptiometry was used to evaluate the effect of the intervention on areal BMD and BMC, measures affected by bone size and growth (42). There is currently no consensus on how to best adjust for bone size when measuring bone mass using dual-energy x-ray absorptiometry, but suggestions have included adjustments in height, bone area, lean mass, pubertal stage, and bone age (42). Although it is clear that these adjustments are essential to evaluating data from studies of pathological conditions in children, they are less crucial in randomized trials of healthy children. Indeed, we studied normal subjects whose baseline characteristics, including height, weight, lean mass, bone mass, bone area, and pubertal stages, were all matched at baseline. Adjustments in changes in lean mass and bone area in response to the intervention were made only to gain insight into the possible mechanisms underlining the beneficial effect of vitamin D on bone. The increments in lean mass and bone mass could have been more robust had the subjects received concomitant calcium, in light of their suboptimal intake (40). However, the aim of the trial was to ascertain the impact of vitamin D per se, rather than calcium and vitamin D, on musculoskeletal health. Other limitations include the lack of assessment of dietary vitamin D intake, the relatively short duration of the trial, precluding conclusions regarding the sustainability of the benefit, and the low power to demonstrate beneficial effect at all skeletal sites in the subgroup analyses by pubertal stage. Nevertheless, this trial demonstrates the importance of vitamin D for musculoskeletal health in girls during a critical time for growth. This has important implications in terms of public health intervention measures.
Acknowledgments
We thank the administrators, school nurses, parents, and students from the American Community School, the International College, the Amlieh School, and the Ashbal Al Sahel School for their support in making this study possible. We thank Mrs. U. Usta for her assistance with preparing the vitamin D solutions and implementing the randomization protocol, Mrs. S. Mroueh for her expert technical assistance with the acquisition and analyses of the BMD scans, and Mrs. C. Hajj Shahine for her tireless efforts in running the hormonal assays.
This work was supported in large part by an educational grant from the Nestle Foundation and a grant from Merck KGaA.
Abbreviations:
- BMC,
Bone mineral content;
- BMD,
bone mineral density;
- CV,
coefficient of variation;
- 1,
25(OH)2D, 1,25-dihydroxyvitamin D;
- 25(OH)D,
25-hydroxyvitamin D.
