


Abstract
Context
Persons with type 2 diabetes have increased fracture risk that existing fracture risk assessment tools underestimate.
Objective
Identify fracture predictors in persons with type 2 diabetes and overweight or obesity, considering traditional and diabetes-related risk factors
Methods
This is a secondary analysis of a multicenter US study, the Look AHEAD: Action for Health in Diabetes randomized clinical trial, with randomization from 2001 to 2004 and fracture follow-up until 2015. Participants were men and women 45 to 75 years old with type 2 diabetes and body mass index ≥ 25 kg/m2. Potential fracture predictors ascertained at randomization included traditional and diabetes-related risk factors (diabetes duration, diabetic neuropathy, antidiabetic medication use, hemoglobin A1c, and renal function). Total hip bone mineral density (BMD) was measured in a subcohort. Primary outcome was all incident clinical fractures, ascertained by self-report and centrally adjudicated with medical records review.
Results
Over a median 12.2-year follow-up, 649 of the 4703 participants experienced at least one clinical fracture. Thiazolidinedione use (hazard ratio [HR] 1.22; 95% CI, 1.02-1.46) and insulin use (HR 1.34, 95% CI, 1.08-1.66) were significant diabetes-related predictors of all clinical fractures. When measured in a subcohort (n = 1285), total hip BMD was the strongest modifiable predictor of all clinical fractures (per 1 SD = 0.1 g/cm2 increase, HR 0.47; 95% CI, 0.39-0.58).
Conclusion
Thiazolidinedione and insulin use predict clinical fracture in middle-aged and older persons with type 2 diabetes and overweight or obesity. Evaluating BMD is advisable if these medications are prescribed. Fracture risk prediction tools may consider including thiazolidinedione and insulin use to refine prediction in this population.
Type 2 diabetes is an independent risk factor for fracture, including hip, vertebral, proximal humeral, and major osteoporotic fractures (1, 2). Fractures cause significant morbidity, mortality, and healthcare costs (3, 4). Fractures are a rising health concern in a growing population of persons with type 2 diabetes who are increasingly older (1, 5).
Persons with type 2 diabetes experience fractures at higher bone mineral density (BMD) than other persons (6). Commonly used fracture risk assessment tools in clinical practice, validated in the general population and incorporating traditional fracture risk factors (age, sex, race/ethnicity, smoking, alcohol use, prevalent fracture, parental hip fracture history, glucocorticoid use, rheumatoid arthritis, and BMD) (7) underestimate fracture risk in persons with type 2 diabetes (8).
Longer duration of diabetes (9), hemoglobin A1c (HbA1c) (10, 11), and comorbidities of renal impairment and peripheral neuropathy (12) are associated with fracture in persons with type 2 diabetes. Antidiabetic drugs modulate fracture risk (13, 14). When adjusted for BMD, obesity is a risk factor for fracture in older men and women (15, 16), and the combination of obesity and type 2 diabetes may augment fracture risk (17). Consideration of fracture risk factors related to type 2 diabetes itself may help to refine fracture risk prediction in the population of persons with type 2 diabetes and overweight or obesity.
The primary objective of this study was to determine predictors of incident fracture for persons with type 2 diabetes and overweight or obesity using longitudinal data from the Look AHEAD: Action for Health in Diabetes (Look AHEAD) randomized controlled trial (RCT) and the Look AHEAD Continuation Study (Look AHEAD-C), with simultaneous consideration of both traditional and diabetes-related fracture risk factors.
Methods
Study Participants
Data from Look AHEAD (Clinicaltrials.gov ID no.: NCT00017953) and Look AHEAD-C were supplied by the National Institute of Diabetes and Digestive and Kidney Diseases Central Repository (NIDDK-CR, version 9). The design and methods of Look AHEAD, which recruited from 16 sites across the United States, have been previously described (18) and the protocol is available (www.lookaheadtrial.org). Look AHEAD primarily examined whether randomization to an intensive lifestyle intervention (ILI) designed to result in weight loss reduced cardiovascular morbidity and mortality compared to diabetes support and education (19) in persons with type 2 diabetes and overweight or obesity. Fracture was a key secondary outcome. Randomization occurred from August 2001 through April 2004. The trial intervention ended in 2012, but participants were followed for fracture through January 1, 2015, in Look AHEAD-C.
Major eligibility criteria for Look AHEAD included: age 45 to 75 years; type 2 diabetes; body mass index (BMI) ≥ 25.0 (≥ 27.0 if taking insulin); HbA1c ≤ 11%; systolic blood pressure < 160 mmHg; diastolic blood pressure < 100 mmHg; triglyceride level < 600 mL/dL; ability to complete a valid maximal exercise test; and having a primary care provider. Look AHEAD participants from Native American sites were excluded, per consent limitations, from the NIDDK-CR. We also excluded participants who underwent bariatric surgery during Look AHEAD, which may alter the fracture risk (20).
All participants provided informed consent for Look AHEAD and re-consent for Look AHEAD-C. Local Institutional Review Boards (IRBs) approved Look AHEAD at all clinical sites. The present study was exempt from IRB approval as data from NIDDK-CR were de-identified.
Clinical Predictors
Clinical risk factors were selected as potential predictors based on their association with incident fractures in the general and/or type 2 diabetic populations and were ascertained prior to randomization (baseline). Look AHEAD treatment arm was considered as a risk factor given that the ILI was found to increase risk of frailty fracture (21). Questionnaires collected demographic characteristics (age, sex, race/ethnicity), medical history (cardiovascular disease, rheumatoid arthritis, age at menopause, duration of type 2 diabetes), smoking history, and alcohol use. Race categories were self-reported. Tobacco smoking was considered categorically (never, former, or current smoking) and as total pack-year history. Alcohol use was evaluated as use or nonuse in the past year and as usual drinks per week (0, 1-3, or 4+ drinks/week). Weight and height were measured at baseline and annually with a digital scale and a standard wall-mounted stadiometer, respectively, and BMI was calculated.
The Michigan Neuropathy Screening Instrument (MNSI) 15-item questionnaire assessed diabetic neuropathy, scored 0 to 15; higher scores indicate more neuropathy features (22). We considered both MNSI total score and a binary indicator of diabetic neuropathy (MNSI score ≥ 4 indicates neuropathy is present) (22).
Participants brought all prescription medications to the research clinic for a medication inventory, from which bone-active medication use (divided as bone-positive and bone-negative medications) and antidiabetic medication use was derived. Bone-negative medications were defined as: loop diuretics, selective serotonin reuptake inhibitors (SSRIs), tricyclic antidepressants (TCAs), thyroid medications, anticonvulsants, benzodiazepines, sedatives, proton pump inhibitors (PPIs), other hormone-negative medication use (aromatase inhibitors, leuprolide, and medroxyprogesterone acetate), glucocorticoids, and muscle relaxants. Bone-positive medications were defined as: thiazide diuretics, androgens, calcium, bisphosphonates, calcitonin, estrogen, and selective estrogen receptor modulators (SERMs). Antidiabetic medications were defined as: thiazolidinediones, sulfonylureas (subdivided as first-generation [chlorpropramide, tolazamide, tolbutamide] and second-generation [glyburide, glibenclamide, glimepiride, glipizide, gliclazide]), meglitinides, biguanides, insulin (any form), and bile acid sequestrants.
Laboratory Predictors
Blood work was completed after an overnight fast and was analyzed by the Central Biochemistry Laboratory (Northwest Lipid Research Laboratories, University of Washington, Seattle, WA, USA) using standardized laboratory procedures. HbA1c was considered as a continuous (%; mmol/mol) or categorical (< 6.0, 6.0-6.5, 6.5-7.0, 7.0-8.0, 8.0-9.0, and > 9.0) metric because evidence suggests both extremes of HbA1c may increase fracture risk (10, 11). Estimated glomerular filtration rate (eGFR) was calculated using the 2021 CKD-EPI creatinine equation (23). The eGFR was considered as a continuous (mL/min/1.73 m2) or categorical metric (by eGFR categories, in mL/min/1.73 m2: G1: ≥ 90, G2: 60-89, G3a: 45-59, G3b-G4: 15-44), the eGFR categories specified in the 2021 Kidney Disease Improving Global Outcomes (KDIGO) Clinical Practice Guideline (24). G3b and G4 were combined due to small sample sizes. Albuminuria was categorized according to the urine albumin to creatinine ratio (ACR) as macroalbuminuria (> 300 mg/g), microalbuminuria (30-300 mg/g), and no albuminuria (<30 mg/g) (24). The KDIGO classification of renal failure progression risk was also considered, calculated from eGFR and ACR according to the 2021 KDIGO Clinical Practice Guideline (24).
Bone Mineral Density Measurement
In a substudy of Look AHEAD, total hip BMD was obtained at baseline, year 1, and year 4 visits at 5 clinical sites (Baton Rouge, LA; Boston, MA; Houston, TX; Los Angeles; CA; and Seattle, WA) using a Hologic fan beam densitometer (dual-energy x-ray absorptiometry). Longitudinal performance was centrally monitored for quality of acquisition and analysis, with regular scanning of cross calibration phantoms on each densitometer, and longitudinal corrections were applied to total hip BMD results at the Los Angeles site.
Fracture Outcomes
Every 6 months, Look AHEAD staff queried participants about all medical events and hospitalizations, including incident fractures either at an in-person visit or by telephone. Hospital and outpatient medical records and x-ray reports were subsequently obtained, reviewed, and centrally adjudicated for incident fracture events according to standard criteria by a central review committee of blinded trained physicians until January 1, 2015. Self-reported fractures of the fingers, toes, face, cervical spine, sternum, ribs, and skull were not centrally adjudicated and were not considered clinical fractures in this study.
A major osteoporotic fracture (MOF) was defined as the first occurrence of hip, thoracic/lumbar vertebra, lower arm/wrist, or upper arm/shoulder/clavicle fracture. Shoulder and clavicle fractures were included in MOF because upper arm/shoulder/clavicle fracture data were only available as a composite site in the NIDDK-CR Look AHEAD dataset.
A frailty fracture was defined as the first occurrence of hip, pelvis, or upper arm/shoulder/clavicle fracture. Frailty fracture was selected because prior data from Look AHEAD and the Study of Osteoporotic Fractures (SOF) have shown that weight loss was associated with frailty fracture using this definition (21, 25).
Study Design
The primary outcome was the first incident clinical fracture. Three secondary fracture outcomes were specified a priori: MOF, frailty fracture, and lower leg/ankle fracture. Lower leg/ankle fracture was selected, as this site is particularly vulnerable to fracture in overweight or obesity, and the only site with higher fracture rates in the diabetes support and education (DSE) study arm than in the ILI arm (21). All of the above clinical and laboratory predictors were considered in univariate and multivariate models for the primary and secondary analyses.
For the primary analysis (all clinical fractures), we performed prespecified sensitivity analyses to further consider the additional potential predictors of (a) total hip BMD and (b) weight change, respectively. Sensitivity analysis (a) was performed in the subcohort of participants with a baseline BMD measurement and was performed overall and stratified by sex. Sensitivity analysis (b) was performed in the subcohort of participants who also had a valid weight measurement at follow-up 1 year after baseline. In sensitivity analysis (b), the annualized weight change was calculated by taking the weight measurement at the first annual follow-up visit and subtracting the baseline weight measurement. Weight measurements beyond the first annual follow-up visit were not considered.
Additional post hoc sensitivity analyses recapitulated the primary and secondary fracture analyses as well as fracture sensitivity analysis (b) including also annualized weight change, stratifying by sex. Further, the association of key antidiabetic medications (thiazolidinediones, sulfonylureas, and insulin use in any form) with longitudinal change in BMD over 1 year and 4 years of follow-up were assessed in post hoc sensitivity analyses.
Statistical Analyses
Baseline characteristics by incident fracture status were presented as means and SD or frequencies (percentages). Incident fracture rates including all clinical fractures and by site, were determined.
Kaplan–Meier estimates were used to calculate the cumulative proportion of participants with all clinical fracture, MOF, frailty fracture, and lower leg/ankle fracture-free survival. Cox hazard models were used to calculate hazard ratios (HRs) and 95% CIs for incident fracture. In the primary analytic cohort and baseline BMD analysis subcohort, fracture follow-up started at the participant's baseline. Fracture follow-up in the annualized weight change analysis subcohort started 1 year after baseline, ie, after the second weight measurement contributing to the calculation of annualized weight change. In the primary analysis and prespecified sensitivity analyses in the baseline BMD and annualized weight change subcohorts, participants were followed until their first incident clinical fracture (at any site), death, loss to follow-up, or January 1, 2015, whichever was first. Subsequent fractures in any individual participant after their first incident clinical fracture during the specified follow-up period were not considered. In site-specific fracture analyses (MOF, frailty fracture, and lower leg/ankle fracture), fracture follow-up started at the participant's baseline and ended at first site-specific fracture (their first MOF, frailty fracture, or lower leg/ankle fracture, respectively), death, loss to follow-up, or January 1, 2015, whichever was first.
First, a univariate (unadjusted) model was fit for each potential predictor. Then, considering all potential predictors, a multivariate Cox hazard model was selected with optimal least absolute shrinkage and selection operator (LASSO) penalty to maximize the Harrell C-index. The HRs and 95% CIs from this model were presented as the final multivariate model for each analysis. Analogous methods to above were followed for the sex-stratified post hoc sensitivity analyses, simply limiting the relevant cohort to each sex, respectively.
In post hoc sensitivity analyses to assess the associations of key antidiabetic medications with longitudinal change in BMD, first 1-year and 4-year change in BMD cohorts were constructed from participants with valid total hip BMD measurements from year 1 and baseline or year 4 and baseline, respectively. In univariate analyses for each medication and each longitudinal change in BMD outcome (1 or 4 years), change in BMD for participants with medication use and nonuse were computed and compared with a two-sided t test, and P values were derived. These analyses were repeated, stratified by sex. Finally, a multivariate regression model was constructed to simultaneously assess the association thiazolidinedione use, sulfonylurea use, and insulin use (any form) with each longitudinal change in BMD outcome, respectively, controlling or key covariates from the prespecified analyses: age, sex, race/ethnicity category, and duration of diabetes.
All statistical analyses were performed using R (26). No adjustments were made for multiple comparisons. An alpha level of 0.05 was considered statistically significant.
Results
Baseline Characteristics
Of 5145 Look AHEAD participants, 4703 were included in these analyses (Fig. 1). Over a median follow-up of 12.2 years, 682 first clinical fractures occurred among 649 participants (345 fractures among 322 ILI participants, 337 fractures among 327 DSE participants). The mean participant age was 59 years (SD 7) and the majority were women (58%). Participants were 5% Hispanic White, 17% non-Hispanic Black, 66% non-Hispanic White, and 13% other or mixed race/ethnicity. Baseline characteristics of the study population overall, by sex, and by incident fracture status are shown in Table 1.

Study flow diagram.
Baseline characteristics of study population, all participants combined, by sex, and by incident fracture status
| Characteristic | All participants [n = 4703] | By sex | By incident fracture status | ||
|---|---|---|---|---|---|
| Men [n = 1986] | Women [n = 2717] | Without clinical fracture [n = 4054] | With clinical fracture [n = 649] | ||
| Treatment arm | |||||
| Intensive Lifestyle Intervention (ILI) | 2350 (50.0) | 992 (49.9) | 1358 (50.0) | 2028 (50.0) | 322 (49.6) |
| Diabetes support and education | 2353 (50.0) | 994 (50.1) | 1359 (50.0) | 2026 (50.0) | 327 (50.4) |
| Age (years) | 59.1 ± 6.7 | 60.2 ± 6.7 | 58.4 ± 6.7 | 59.0 ± 6.7 | 59.8 ± 6.9 |
| Female sex | 2717 (57.8) | 0 (0.0) | 2717 (100.0) | 2258 (55.7) | 459 (70.7) |
| Race/ethnicity | |||||
| Hispanic White | 223 (4.7) | 72 (3.6) | 151 (5.6) | 198 (4.9) | 25 (3.9) |
| Non-Hispanic Black | 778 (16.5) | 185 (9.3) | 593 (21.8) | 718 (17.7) | 60 (9.2) |
| Non-Hispanic White | 3100 (65.9) | 1549 (78.0) | 1551 (57.1) | 2612 (64.4) | 488 (75.2) |
| Other or mixed race/ethnicity | 602 (12.8) | 180 (9.1) | 422 (15.5) | 526 (13.0) | 76 (11.7) |
| Height (cm) | 167.6 ± 9.7 | 176.0 ± 6.7 | 161.4 ± 6.5 | 167.7 ± 9.7 | 166.5 ± 9.6 |
| Weight (55) | 100.4 ± 18.9 | 108.7 ± 18.3 | 94.3 ± 16.9 | 100.6 ± 18.9 | 99.1 ± 19.1 |
| BMI (kg/m2) | 35.7 ± 5.7 | 35.1 ± 5.4 | 36.1 ± 5.9 | 35.7 ± 5.8 | 35.6 ± 5.5 |
| Tobacco smoking category | |||||
| Never | 2323 (49.5) | 749 (37.8) | 1574 (58.0) | 1999 (49.4) | 324 (49.9) |
| Former | 2167 (46.2) | 1141 (57.6) | 1026 (37.8) | 1873 (46.3) | 294 (45.3) |
| Current | 203 (4.3) | 90 (4.5) | 113 (4.2) | 172 (4.3) | 31 (4.8) |
| Pack-years tobacco smoking | 10.2 ± 18.1 [n = 4670] | 14.9 ± 21.5 [n = 1970] | 6.74 ± 14.1 [n = 2700] | 10.2 ± 18.3 [n = 4028] | 9.8 ± 16.5 [n = 642] |
| Any alcohol use in the past year | 2900 (61.7) | 1423 (71.7) | 1477 (54.4) | 2491 (61.5) | 409 (63) |
| Alcohol use (usual drinks/week) | |||||
| 0 drinks/week | 1322 (45.7) | 460 (32.4) | 862 (58.5) | 1124 (45.2) | 198 (48.4) |
| 1-3 drinks/week | 952 (32.9) | 484 (34.1) | 468 (31.8) | 814 (32.8) | 138 (33.7) |
| 4 + drinks/week | 620 (21.4) | 477 (33.6) | 143 (9.7) | 547 (22.0) | 73 (17.8) |
| Bone-positive medication use | 397 (9.8) | 74 (11.4) | |||
| Thiazide | 252 (5.4) | 81 (4.1) | 171 (6.3) | 210 (5.2) | 42 (6.5) |
| Androgen | 7 (0.1) | 7 (0.4) | 0 (0.0) | 7 (0.2) | 0 (0.0) |
| Calcium | 36 (0.8) | 6 (0.3) | 30 (1.1) | 30 (0.7) | 6 (0.9) |
| Bisphosphonate | 21 (0.4) | 2 (0.1) | 19 (0.7) | 15 (0.4) | 6 (0.9) |
| Calcitonin | 0 (0.0) | 0 (0.0) | 0 (0.0) | 0 (0.0) | 0 (0.0) |
| Estrogen | 227 (4.8) | 0 (0.0) | 227 (8.4) | 196 (4.8) | 31 (4.8) |
| SERM | 13 (0.3) | 0 (0.0) | 13 (0.5) | 9 (0.2) | 4 (0.6) |
| Bone-negative medication use | 334 (8.2) | 66 (10.2) | |||
| Loop diuretics | 55 (1.2) | 17 (0.9) | 38 (1.4) | 49 (1.2) | 6 (0.9) |
| SSRI | 123 (2.6) | 36 (1.8) | 87 (3.2) | 98 (2.4) | 25 (3.9) |
| TCA | 34 (0.7) | 13 (0.7) | 21 (0.8) | 24 (0.6) | 10 (1.5) |
| Thyroid | 147 (3.1) | 35 (1.8) | 112 (4.1) | 128 (3.2) | 19 (2.9) |
| Anticonvulsants | 8 (0.2) | 3 (0.2) | 5 (0.2) | 8 (0.2) | 0 (0.0) |
| Benzodiazepines | 28 (0.6) | 9 (0.5) | 19 (0.7) | 24 (0.6) | 4 (0.6) |
| Sedatives | 8 (0.2) | 3 (0.2) | 5 (0.2) | 6 (0.1) | 2 (0.3) |
| PPI | 107 (2.3) | 35 (1.8) | 72 (2.6) | 87 (2.1) | 20 (3.1) |
| Other hormone-negative medication usea | 16 (0.3) | 1 (0.1) | 15 (0.6) | 13 (0.3) | 3 (0.5) |
| Glucocorticoids | 1 (0.0) | 1 (0.1) | 0 (0.0) | 1 (0.0) | 0 (0.0) |
| Muscle relaxants | 11 (0.2) | 2 (0.1) | 9 (0.3) | 11 (0.3) | 0 (0.0) |
| Presence of prevalent CVD | 675 (14.4) | 425 (21.4) | 250 (9.2) | 586 (14.5) | 89 (13.7) |
| Presence of prevalent rheumatoid arthritis | 234 (5.0) | 84 (4.2) | 150 (5.5) | 202 (5.0) | 32 (4.9) |
| Age at menopause (years) [in postmenopausal women only] | 45.8 ± 7.9 [n = 2275] | n/a | 45.8 ± 7.9 [n = 2275] | 45.9 ± 7.8 [n = 1887] | 45.2 ± 8.2 [n = 388] |
| Duration of diabetes (years) | 6.8 ± 6.5 [n = 4674] | 7.1 ± 6.4 [n = 1973] | 6.5 ± 6.5 [n = 2701] | 6.6 ± 6.4 [n = 4028] | 7.4 ± 6.4 [n = 646] |
| Diabetes medication use | |||||
| Thiazolidinediones | 1221 (26.8) | 580 (30.1) | 641 (24.4) | 1028 (26.2) | 193 (30.5) |
| Sulfonylureas | 2131 (46.5) | 988 (50.9) | 1143 (43.3) | 1846 (46.8) | 285 (44.9) |
| First-generation sulfonylureas | 277 (6.1) | 121 (6.3) | 156 (5.9) | 241 (6.1) | 36 (5.7) |
| Second-generation sulfonylureas | 1840 (40.3) | 860 (44.5) | 980 (37.2) | 1593 (40.5) | 247 (39.0) |
| Meglitinides | 137 (3.0) | 76 (4.0) | 61 (2.3) | 113 (2.9) | 24 (3.8) |
| Biguanides | 2828 (61.3) | 1238 (63.5) | 1590 (59.7) | 2434 (61.2) | 394 (61.6) |
| Insulin (any form) | 856 (18.2) | 363 (18.3) | 493 (18.1) | 711 (17.5) | 145 (22.3) |
| Bile acid sequestrants | 24 (0.5) | 10 (0.5) | 14 (0.5) | 24 (0.6) | 0 (0.0) |
| Hemoglobin A1c (%) | 7.3 ± 1.2 | 7.3 ± 1.2 | 7.3 ± 1.1 | 7.2 ± 1.1 | 7.3 ± 1.2 |
| Hemoglobin A1c (%) category | |||||
| < 6.0 | 351 (7.5) | 168 (8.5) | 183 (6.7) | 308 (7.6) | 43 (6.6) |
| 6.0-6.5 | 851 (18.1) | 347 (17.5) | 504 (18.5) | 749 (18.5) | 102 (15.7) |
| 6.5-7.0 | 971 (20.6) | 414 (20.8) | 557 (20.5) | 837 (20.6) | 134 (20.6) |
| 7.0-8.0 | 1455 (30.9) | 601 (30.3) | 854 (31.4) | 1248 (30.8) | 207 (31.9) |
| 8.0-9.0 | 709 (15.1) | 300 (15.1) | 409 (15.1) | 602 (14.8) | 107 (16.5) |
| > 9.0 | 366 (7.8) | 156 (7.9) | 210 (7.7) | 310 (7.6) | 56 (8.6) |
| Michigan Neuropathy Screening Instrument, total scoreb | 1.8 ± 2.0 [n = 4673] | 1.8 ± 1.9 [n = 1973] | 1.8 ± 2.0 [n = 2700] | 1.8 ± 2.0 [n = 4032] | 2.0 ± 1.9 [n = 641] |
| Presence of diabetic neuropathyc | 802 (17.2) | 323 (16.4) | 479 (17.7) | 670 (16.6) | 132 (20.6) |
| eGFR (mL/min/1.73 m2)d | 94.8 ± 21.4 | 98.5 ± 26.7 | 92.1 ± 15.9 | 95.2 ± 21.5 | 92.6 ± 20.4 |
| eGFR category | |||||
| G1 (≥ 90 mL/min/1.73 m2) | 2752 (58.5) | 1098 (55.3) | 1654 (60.9) | 2384 (58.8) | 368 (56.7) |
| G2 (60-89 mL/min/1.73 m2) | 1765 (37.5) | 819 (41.2) | 946 (34.8) | 1509 (37.2) | 256 (39.4) |
| G3a (45-59 mL/min/1.73 m2) | 172 (3.7) | 63 (3.2) | 109 (4.0) | 149 (3.7) | 23 (3.5) |
| G3b (30-44 mL/min/1.73 m2) | 13 (0.3) | 6 (0.3) | 7 (0.3) | 11 (0.3) | 2 (0.3) |
| G4 (15-29 mL/min/1.73 m2) | 1 (0.0) | 0 (0.0) | 1 (0.0) | 1 (0.0) | 0 (0.0) |
| KDIGO Albuminuria category | |||||
| No albuminuria (ACR < 30 mg/g) | 3839 (84.0) | 1552 (80.4) | 2287 (86.7) | 3321 (84.3) | 518 (82.1) |
| Microalbuminuria (30 mg/g ≤ ACR ≤ 300 mg/g) | 608 (13.3) | 307 (15.9) | 301 (11.4) | 513 (13.0) | 95 (15.1) |
| Macroalbuminuria (ACR > 300 mg/g) | 123 (2.7) | 72 (3.7) | 51 (1.9) | 105 (2.7) | 18 (2.9) |
| KDIGO classification of renal failure/CKD progression risk | |||||
| Low risk | 3698 (80.9) | 1508 (78.1) | 2190 (83.0) | 3199 (81.2) | 499 (79.1) |
| Moderate risk | 708 (15.5) | 331 (17.1) | 377 (14.3) | 600 (15.2) | 108 (17.1) |
| High risk | 149 (3.3) | 83 (4.3) | 66 (2.5) | 126 (3.2) | 23 (3.6) |
| Very high risk | 15 (0.3) | 9 (0.5) | 6 (0.2) | 14 (0.4) | 1 (0.2) |
Values are n (%) for categorical and mean ± SD for continuous variables; [n] is indicated for continuous variables where n is not the entire population.
Abbreviations: ACR, albumin to creatinine ratio; BMI, body mass index; CKD, chronic kidney disease; CVD, cardiovascular disease; eGFR, estimated glomerular filtration rate; KDIGO, Kidney Disease Improving Global Outcomes.; n/a: not applicable; PPI, proton pump inhibitor; SERM, selective estrogen receptor modulator; SSRI, selective serotonin reuptake inhibitor; TCA, tricyclic antidepressant.
aOther hormone-negative medications include aromatase inhibitors, leuprolide (Lupron), and medroxyprogesterone acetate (Depo-Provera).
bThe Michigan Neuropathy Screening Instrument consists of a 15-item questionnaire scored from 0 to 15, with higher scores indicating more features suggestive of diabetic neuropathy (22).
cPresence of neuropathy as determined by the Michigan Neuropathy Screening Instrument 15-item questionnaire with a total score of ≥ 4 indicating presence of diabetic neuropathy (22).
deGFR calculated from the 2021 CKD-EPI creatinine equation.
Fracture Outcomes
Of those 649 participants with at least one clinical fracture, 620 participants (96%) had a single fracture. The most common fracture sites were MOF (n = 317), lower leg/ankle (n = 196), frailty (n = 172), lower arm/wrist (n = 120), and upper arm/shoulder/clavicle (n = 120). Hip (n = 38) and vertebral (n = 46) fractures were uncommon. Incidence rates of all clinical fractures by site and treatment assignment are shown in Supplementary Table S1 (27). The Kaplan–Meier fracture-free survival curve for all clinical fractures, MOF, frailty fracture, and lower leg/ankle fracture are shown in Fig. 2, and by treatment assignment in Supplementary Figs. S1 and S2 (27).
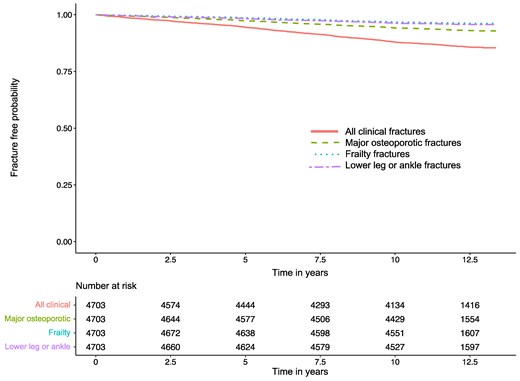
Kaplan–Meier fracture-free survival curve in persons with type 2 diabetes mellitus and overweight or obesity.
Primary Analysis of All Clinical Fractures
In the final multivariate model for all clinical fractures (C-index: 0.62), older age (per 1 SD = 7 years increase; HR 1.14 [95% CI, 1.05-1.24]), female sex (HR 2.19 [95% CI, 1.83-2.63]), thiazolidinedione use (HR 1.22 [95% CI, 1.02-1.46]), and insulin use (in any form) (HR 1.34 [95% CI, 1.08-1.66]) were associated with higher clinical fracture incidence. All race/ethnicity categories were associated with lower clinical fracture incidence compared to non-Hispanic White race/ethnicity (Hispanic White: HR 0.61 [95% CI, 0.40-0.93]; non-Hispanic Black: HR 0.36 [95% CI, 0.27-0.49]; other/mixed: HR 0.70 [95% CI, 0.55-0.90]) (Table 2).
Hazard ratios for all clinical fractures, major osteoporotic fractures, frailty fractures, and lower leg/ankle fractures in persons with type 2 diabetes mellitus and overweight or obesity, all participants
| Fracture site | All clinical fracture | Major osteoporotic fracturea | Frailty fractureb | Lower leg/ankle fracture | ||||
|---|---|---|---|---|---|---|---|---|
| Characteristic | Univariate HR (95% CI) | Multivariate HR (95% CI) | Univariate HR (95% CI) | Multivariate HR (95% CI) | Univariate HR (95% CI) | Multivariate HR (95% CI) | Univariate HR (95% CI) | Multivariate HR (95% CI) |
| Treatment arm: Intensive Lifestyle Interventionc | 0.98 (0.84-1.14) | n/a | 1.18 (0.94-1.47) | 1.18 (0.94-1.49) | 1.30 (0.96-1.76) | n/a | 0.70 (0.53-0.93) | 0.73 (0.54-0.98) |
| Age (per 1 SD = 7 years increase) | 1.13 (1.05-1.22) | 1.14 (1.05-1.24) | 1.27 (1.14-1.42) | 1.28 (1.13-1.44) | 1.34 (1.15-1.55) | 1.24 (1.05-1.46) | 1.01 (0.88-1.16) | n/a |
| Female sex | 1.83 (1.55-2.17) | 2.19 (1.83-2.63) | 1.66 (1.30-2.10) | 2.29 (1.74-3.02) | 1.57 (1.13-2.16) | 1.93 (1.37-2.71) | 2.10 (1.53-2.90) | 2.40 (1.69-3.39) |
| Race/ethnicity | ||||||||
| Hispanic White | 0.69 (0.46-1.03) | 0.61 (0.40-0.93) | 0.55 (0.29-1.04) | 0.55 (0.29-1.04) | 0.59 (0.26-1.35) | 0.58 (0.25-1.31) | 1.03 (0.54-1.95) | n/a |
| Non-Hispanic Black | 0.47 (0.36-0.61) | 0.36 (0.27-0.49) | 0.36 (0.24-0.55) | 0.26 (0.16-0.43) | 0.25 (0.13-0.50) | 0.17 (0.07-0.39) | 0.82 (0.55-1.24) | n/a |
| Non-Hispanic White | Referent | Referent | Referent | Referent | Referent | Referent | Referent | n/a |
| Other or Mixed race/ethnicity | 0.79 (0.62-1.001) | 0.70 (0.55-0.90) | 0.76 (0.54-1.08) | 0.69 (0.48-0.998) | 0.66 (0.40-1.08) | 0.57 (0.34-0.95) | 0.88 (0.96-1.004) | n/a |
| Height (per 1 SD = 10 cm increase) | 0.88 (0.82-0.96) | n/a | 0.89 (0.80-0.998) | n/a | 0.93 (0.80-1.08) | n/a | 0.90 (0.79-1.04) | n/a |
| Weight (per 1 SD = 19 kg increase) | 0.93 (0.86-1.005) | n/a | 0.95 (0.85-1.06) | 1.07 (0.94-1.22) | 0.94 (0.81-1.10) | n/a | 0.97 (0.84-1.11) | n/a |
| BMI (per 1 SD = 6 kg/m2 increase) | 0.99 (0.92-1.07) | n/a | 1.01 (0.90-1.13) | n/a | 0.97 (0.83-1.13) | n/a | 1.04 (0.90-1.19) | n/a |
| Smoking category | ||||||||
| Never | Referent | n/a | Referent | n/a | Referent | n/a | Referent | n/a |
| Former | 0.98 (0.83-1.14) | n/a | 0.98 (0.78-1.23) | n/a | 0.94 (0.69-1.28) | n/a | 0.98 (0.73-1.30) | n/a |
| Current | 1.10 (0.76-1.60) | n/a | 1.10 (0.65-1.86) | n/a | 0.91 (0.42-1.97) | n/a | 1.05 (0.53-2.08) | n/a |
| Pack-years smoking (per 1 SD = 18 pack-years increase) | 0.98 (0.91-1.06) | n/a | 0.96 (0.85-1.08) | n/a | 0.93 (0.79-1.10) | n/a | 1.00 (0.87-1.15) | n/a |
| Any alcohol use in the past year | 1.06 (0.90-1.24) | n/a | 0.94 (0.75-1.17) | n/a | 0.96 (0.63-1.16) | n/a | 1.25 (0.93-1.69) | 1.49 (1.09-2.04) |
| Alcohol use (usual drinks/week) | ||||||||
| 0 drinks/week | Referent | n/a | Referent | n/a | Referent | n/a | Referent | n/a |
| 1-3 drinks/week | 0.96 (0.77-1.19) | n/a | 0.88 (0.64-1.23) | n/a | 1.12 (0.73-1.72) | n/a | 1.12 (0.77-1.65) | n/a |
| 4+ drinks/week | 0.77 (0.59-1.01) | n/a | 0.76 (0.51-1.12) | n/a | 0.63 (0.35-1.15) | n/a | 0.99 (0.63-1.56) | n/a |
| Bone-positive medication use, any | 1.11 (0.87-1.42) | n/a | 0.86 (0.59-1.26) | n/a | 0.76 (0.44-1.31) | n/a | 1.33 (0.88-2.02) | n/a |
| Thiazide | 1.17 (0.86-1.60) | n/a | 0.96 (0.59-1.56) | n/a | 0.82 (0.41-1.68) | n/a | 1.32 (0.77-2.27) | n/a |
| Androgen | NE | n/a | NE | n/a | NE | n/a | NE | n/a |
| Calcium | 1.19 (0.53-2.65) | n/a | NE | n/a | 0.73 (0.10-5.21) | n/a | 1.31 (0.33-5.30) | n/a |
| Bisphosphonate | 2.21 (0.99-4.94) | n/a | 2.94 (1.10-7.88) | 1.98 (0.62-6.26) | 1.23 (0.17-8.81) | n/a | 1.12 (0.16-7.99) | n/a |
| Calcitonin | NE | n/a | NE | n/a | NE | n/a | NE | n/a |
| Estrogen | 0.95 (0.66-1.36) | n/a | 0.61 (0.32-1.14) | 0.46 (0.23-0.92) | 0.56 (0.23-1.37) | n/a | 1.25 (0.70-2.24) | n/a |
| SERM | 2.38 (0.89-6.37) | n/a | 1.08 (0.15-7.72) | n/a | 2.05 (0.29-14.63) | n/a | 3.81 (0.95-15.33) | 2.63 (0.65-10.69) |
| Bone-negative medication use, any | 1.18 (0.91-1.52) | n/a | 1.16 (0.80-1.67) | n/a | 0.92 (0.53-1.59) | n/a | 1.12 (0.70-1.80) | n/a |
| Loop diuretics | 0.75 (0.33-1.67) | n/a | 1.04 (0.39-2.78) | n/a | 1.47 (0.47-4.61) | n/a | 0.42 (0.06-2.98) | n/a |
| SSRI | 1.48 (0.99-2.21) | n/a | 1.81 (1.08-3.05) | 1.91 (1.09-3.33) | 1.79 (0.88-3.63) | n/a | 0.75 (0.28-2.02) | n/a |
| TCA | 2.26 (1.21-4.22) | n/a | 2.18 (0.90-5.27) | 2.23 (0.81-6.15) | 0.77 (0.11-5.48) | n/a | 2.96 (1.10-7.96) | 2.71 (0.99-7.41) |
| Thyroid | 0.89 (0.56-1.40) | n/a | 0.66 (0.31-1.40) | 0.62 (0.28-1.34) | 0.35 (0.09-1.40) | n/a | 0.79 (0.32-1.91) | n/a |
| Anticonvulsants | NE | n/a | NE | n/a | NE | n/a | NE | n/a |
| Benzodiazepines | 0.98 (0.37-2.63) | n/a | 1.56 (0.50-4.87) | n/a | 2.97 (0.95-9.29) | 2.89 (0.92-9.09) | 0.82 (0.11-5.83) | n/a |
| Sedatives | 1.85 (0.46-7.42) | n/a | 1.97 (0.28-14.00) | n/a | NE | n/a | 2.86 (0.40-20.41) | n/a |
| PPI | 1.33 (0.85-2.08) | n/a | 1.06 (0.53-2.14) | n/a | 0.73 (0.23-2.30) | n/a | 1.81 (0.89-3.68) | 1.70 (0.83-3.49) |
| Other hormone-negative medication used | 1.39 (0.45-4.33) | n/a | NE | n/a | NE | n/a | 3.17 (0.79-12.79) | 2.51 (0.61-10.21) |
| Glucocorticoids | NE | n/a | NE | n/a | NE | n/a | NE | n/a |
| Muscle relaxants | NE | n/a | NE | n/a | NE | n/a | NE | n/a |
| Presence of prevalent CVD | 0.96 (0.77-1.20) | n/a | 1.14 (0.84-1.54) | n/a | 1.18 (0.78-1.76) | n/a | 0.84 (0.55-1.28) | n/a |
| Presence of prevalent rheumatoid arthritis | 0.98 (0.69-1.39) | n/a | 0.95 (0.56-1.59) | n/a | 1.31 (0.71-2.42) | n/a | 0.91 (0.47-1.78) | n/a |
| Age at menopause (per 1 SD = 8 years increase) [in postmenopausal women only] | 0.93 (0.84-1.02) | n/a | 0.88 (0.77-1.02) | n/a | 0.97 (0.80-1.18) | n/a | 0.88 (0.74-1.03) | n/a |
| Duration of diabetes (per 1 SD = 6 years increase) | 1.11 (1.03-1.19) | 1.04 (0.96-1.13) | 1.14 (1.03-1.25) | n/a | 1.21 (1.07-1.37) | 1.08 (0.93-1.26) | 1.11 (0.98-1.26) | 1.12 (0.98-1.28) |
| Diabetes medication use | ||||||||
| Thiazolidinediones | 1.22 (1.03-1.44) | 1.22 (1.02-1.46) | 1.19 (0.93-1.52) | 1.13 (0.87-1.46) | 1.11 (0.79-1.55) | n/a | 1.58 (1.17-2.12) | 1.58 (1.16-2.16) |
| Sulfonylureas | 0.93 (0.79-1.09) | n/a | 0.93 (0.75-1.16) | n/a | 1.10 (0.81-1.49) | n/a | 0.87 (0.65-1.16) | n/a |
| First-generation sulfonylureas | 0.93 (0.66-1.30) | n/a | 0.78 (0.47-1.31) | n/a | 0.77 (0.38-1.56) | n/a | 1.25 (0.73-2.16) | n/a |
| Second-generation sulfonylureas | 0.94 (0.80-1.10) | n/a | 0.98 (0.78-1.23) | n/a | 1.16 (0.85-1.57) | n/a | 0.82 (0.60-1.10) | n/a |
| Meglitinides | 1.30 (0.87-1.96) | n/a | 1.42 (0.82-2.48) | n/a | 1.21 (0.54-2.74) | n/a | 1.45 (0.71-2.94) | n/a |
| Biguanides | 1.01 (0.86-1.18) | n/a | 1.00 (0.79-1.25) | n/a | 1.11 (0.81-1.52) | n/a | 0.86 (0.64-1.14) | n/a |
| Insulin (any form) | 1.32 (1.10-1.59) | 1.34 (1.08-1.66) | 1.46 (1.13-1.89) | 1.50 (1.14-1.97) | 1.46 (1.03-2.07) | 1.51 (1.02-2.24) | 1.04 (0.73-1.49) | n/a |
| Bile acid sequestrants | NE | n/a | NE | n/a | NE | n/a | NE | n/a |
| Hemoglobin A1c (per 1 SD = 1% increase) | 1.08 (0.999-1.16) | n/a | 1.04 (0.93-1.15) | n/a | 1.11 (0.97-1.28) | n/a | 1.02 (0.89-1.17) | n/a |
| Hemoglobin A1c (%) category | ||||||||
| < 6.0 | Referent | n/a | Referent | n/a | Referent | n/a | Referent | n/a |
| 6.0-6.5 | 0.97 (0.68-1.39) | n/a | 0.88 (0.54-1.42) | n/a | 0.94 (0.46-1.91) | n/a | 1.03 (0.53-2.01) | n/a |
| 6.5-7.0 | 1.13 (0.80-1.60) | n/a | 0.98 (0.61-1.57) | n/a | 1.02 (0.51-2.02) | n/a | 1.33 (0.70-2.51) | n/a |
| 7.0-8.0 | 1.17 (0.84-1.62) | n/a | 0.97 (0.62-1.52) | n/a | 1.29 (0.68-2.46) | n/a | 1.37 (0.74-2.52) | n/a |
| 8.0-9.0 | 1.23 (0.86-1.75) | n/a | 1.17 (0.73-1.89) | n/a | 1.39 (0.70-2.77) | n/a | 1.10 (0.56-2.17) | n/a |
| > 9.0 | 1.25 (0.84-1.86) | n/a | 0.91 (0.51-1.61) | n/a | 1.30 (0.60-2.82) | n/a | 1.18 (0.55-2.53) | n/a |
| Michigan Neuropathy Screening Instrumente (per 1 SD = 2 points increase in total score) | 1.08 (1.01-1.17) | n/a | 1.10 (0.99-1.22) | n/a | 1.20 (1.05-1.37) | n/a | 1.01 (0.88-1.16) | n/a |
| Presence of diabetic neuropathyf | 1.29 (1.06-1.56) | n/a | 1.41 (1.08-1.83) | 1.24 (0.94-1.64) | 1.64 (1.16-2.32) | 1.48 (1.03-2.12) | 1.08 (0.75-1.55) | n/a |
| eGFRg (per 1 SD = 21 mL/min/1.73 m2 increase) | 0.88 (0.81-0.96) | n/a | 0.87 (0.78-0.98) | n/a | 0.86 (0.73-1.005) | n/a | 0.86 (0.74-0.99) | 0.88 (0.75-1.05) |
| eGFR category | ||||||||
| G1 (≥ 90 mL/min/1.73 m2) | Referent | n/a | Referent | n/a | Referent | n/a | Referent | n/a |
| G2 (60-89 mL/min/1.73 m2) | 1.10 (0.94-1.30) | n/a | 1.19 (0.95-1.49) | n/a | 1.10 (0.80-1.50) | n/a | 1.07 (0.80-1.44) | n/a |
| G3a (45-59 mL/min/1.73 m2) | 1.03 (0.67-1.57) | n/a | 1.14 (0.64-2.05) | n/a | 1.75 (0.91-3.36) | n/a | 1.17 (0.57-2.40) | n/a |
| G3b or G4 (15-44 mL/min/1.73 m2) | 1.18 (0.29-4.74) | n/a | 1.15 (0.16-8.24) | n/a | 2.14 (0.30-15.33) | n/a | 1.83 (0.26-13.14) | n/a |
| KDIGO albuminuria category | ||||||||
| No albuminuria (ACR < 30 mg/g) | 1.19 (0.96-1.48) | n/a | Referent | Referent | Referent | n/a | Referent | n/a |
| Microalbuminuria (30 mg/g ≤ ACR ≤300 mg/g) | Referent | n/a | 1.26 (0.93-1.72) | 1.31 (0.95-1.80) | 1.57 (1.07-2.30) | n/a | 0.75 (0.47-1.19) | n/a |
| Macroalbuminuria (ACR > 300 mg/g) | 1.09 (0.68-1.75) | n/a | 1.27 (0.68-2.39) | 1.36 (0.72-2.58) | 0.23 (0.03-1.65) | n/a | 0.74 (0.27-1.99) | n/a |
| KDIGO classification of renal failure/CKD progression risk | ||||||||
| Low risk | Referent | n/a | Referent | n/a | Referent | Referent | Referent | n/a |
| Moderate risk | 1.16 (0.94-1.43) | n/a | 1.25 (0.93-1.67) | n/a | 1.65 (1.15-2.37) | 1.53 (1.04-2.23) | 0.85 (0.56-1.29) | n/a |
| High risk | 1.16 (0.76-1.76) | n/a | 1.27 (0.71-2.27) | n/a | 0.80 (0.30-2.16) | 0.66 (0.24-1.80) | 0.84 (0.37-1.91) | n/a |
| Very high risk | 0.50 (0.07-3.58) | n/a | 1.09 (0.15-7.79) | n/a | NE | n/a | NE | n/a |
Hazard ratios and 95% confidence intervals in bold designate statistically significant associations at an alpha = 0.05 level.
Abbreviations: ACR, albumin to creatinine ratio; BMI, body mass index; CKD, chronic kidney disease; CVD, cardiovascular disease; eGFR, estimated glomerular filtration rate; HR, hazard ratio; KDIGO, Kidney Disease Improving Global Outcomes; NE, not estimable; n/a, not applicable; PPI, proton pump inhibitor; SERM, selective estrogen receptor modulator; SSRI, selective serotonin reuptake inhibitor; TCA, tricyclic antidepressant, as predictor was not included in the best multivariate predictor model for that fracture site.
aMajor osteoporotic fracture is defined as the first occurrence of a hip, thoracic/lumbar vertebrae, lower arm/wrist, or upper arm (humerus)/shoulder/clavicle fracture.
bFrailty fracture is defined as the first occurrence of a hip, pelvis or upper arm (humerus)/shoulder/clavicle fracture.
cReferent group: Diabetes Support & Education.
dOther hormone-negative medications include aromatase inhibitors, leuprolide (Lupron), and medroxyprogesterone acetate (Depo-Provera).
eThe Michigan Neuropathy Screening Instrument consists of a 15-item questionnaire scored from 0 to 15, with higher scores indicating more features suggestive of diabetic neuropathy (22).
fPresence of neuropathy as determined by the Michigan Neuropathy Screening Instrument 15-item questionnaire with a total score of ≥ 4 indicating presence of diabetic neuropathy (22).
geGFR calculated from the 2021 CKD-EPI creatinine equation.
Secondary Analyses of Site-Specific Fracture Outcomes
In the final multivariate model for MOF (C-index: 0.63), age, sex, race/ethnicity, and insulin use had similar significant associations to the primary analysis. Hispanic White race/ethnicity and thiazolidinedione use associations were attenuated and no longer significant. SSRI use (HR 1.91 [95% CI, 1.09-3.33]) was associated with higher and estrogen use (HR 0.46 [95% CI, 0.23-0.92]6) with lower MOF incidence (Table 2).
In the final multivariate model for frailty fracture (C-index: 0.60), age, sex, race/ethnicity, and insulin use had similar significant association to the primary analysis. Hispanic White race/ethnicity association was attenuated and no longer significant. Treatment assignment and thiazolidinedione use were not in the model. Presence of diabetic neuropathy (HR 1.48 [95% CI, 1.03-2.12]) and moderate relative to low risk for renal failure progression (HR 1.53 [95% CI, 1.04-2.23]) were associated with higher frailty fracture incidence (Table 2).
In the final multivariate model for lower leg/ankle fracture (C-index: 0.63), sex and thiazolidinedione use had similar significant associations to the primary analysis. Age and race/ethnicity were no longer in the model. ILI treatment arm assignment was associated with lower rates of lower leg/ankle fracture (HR 0.73 [95% CI, 0.54-0.98]) and any alcohol use in the past year was associated with higher rates of lower leg/ankle fracture (HR 1.49 [95% CI, 1.09-2.04]) (Table 2).
Sensitivity Analyses of the Primary and Secondary Fracture Outcomes Stratified by Sex
In women, findings from the final multivariate models for all clinical fracture (C-index: 0.62), MOF (C-index: 0.633), frailty fracture (C-index: 0.68), and lower leg/ankle fracture (C-index: 0.57) generally mirrored the findings from the total population. Thiazolidinedione use was associated with all clinical fracture (HR 1.27 [95% CI, 1.03-1.58]) and lower leg/ankle fracture (HR 1.57 [95% CI, 1.09-2.26]) in women. Insulin use (in any form) was associated with all clinical fracture (HR 1.30 [95% CI, 1.01-1.68]), MOF (HR 1.67 [95% CI, 1.20-2.30]), and frailty fracture (HR 1.94 [95% CI, 1.22-3.11]) in women. In women only, in contrast to the overall population and men only, HbA1c was associated with all clinical fractures (HR 1.18 [95% CI, 1.07-1.30] per 1% increase) (Table 3).
Hazard ratios for all clinical fractures, major osteoporotic fractures, frailty fractures, and lower leg/ankle fractures in persons with type 2 diabetes mellitus and overweight or obesity, stratified by sex
| Fracture site | All clinical fracture | Major osteoporotic fracturea | Frailty fractureb | Lower leg/ankle fracture | ||||
|---|---|---|---|---|---|---|---|---|
| Multivariate HR (95% CI) | Multivariate HR (95% CI) | Multivariate HR (95% CI) | Multivariate HR (95% CI) | |||||
| Characteristic | Men | Women | Men | Women | Men | Women | Men | Women |
| Treatment arm: Intensive Lifestyle Interventionc | n/a | n/a | n/a | n/a | n/a | n/a | 0.64 (0.35-1.18) | 0.75 (0.53-1.06) |
| Age | n/a | 1.21 (1.10-1.34) per 1 SD = 7 years increase | 1.26 (1.03-1.55) per 1 SD = 7 years increase | 1.27 (1.11-1.47) per 1 SD = 7 years increase | n/a | 1.45 (1.19-1.76) per 1 SD = 7 years increase | n/a | 1.09 (0.90-1.33) Per 1 SD = 7 years increase |
| Race/ethnicity | ||||||||
| Hispanic White | 0.58 (0.21-1.59) | 0.68 (0.42-1.09) | n/a | 0.58 (0.28-1.19) | 1.42 (0.43-4.69) | 0.41 (0.13-1.32) | 0.68 (0.09-5.18) | 1.02 (0.47-2.24) |
| Non-Hispanic Black | 0.51 (0.26-1.01) | 0.32 (0.23-0.45) | n/a | 0.20 (0.11-0.36) | 0.22 (0.03-1.58) | 0.15 (0.06-0.38) | 0.79 (0.27-2.29) | 0.68 (0.42-1.11) |
| Non-Hispanic White | Referent | Referent | n/a | Referent | Referent | Referent | Referent | Referent |
| Other or Mixed race/ethnicity | 0.64 (0.34-1.20) | 0.78 (0.59-1.05) | n/a | 0.70 (0.46-1.08) | 0.94 (0.37-2.37) | 0.61 (0.32-1.34) | 0.31 (0.04-2.31) | 1.25 (0.75-2.10) |
| Height | 1.08 (0.91-1.27) per 1 SD = 7 cm increase | 1.16 (1.05-1.29) per 1 SD = 7 cm increase | n/a | 1.16 (0.998-1.34) per 1 SD = 7 cm increase | n/a | 1.36 (1.11-1.66) per 1 SD = 7 cm increase | 1.33 (0.98-1.81) per 1 SD = 7 cm increase | 1.23 (1.02-1.47) per 1 SD = 7 cm increase |
| Weight | 1.07 (0.92-1.26) per 1 SD = 18 kg increase | n/a | n/a | n/a | n/a | n/a | n/a | n/a |
| BMI | n/a | n/a | n/a | n/a | n/a | n/a | n/a | n/a |
| Smoking category | ||||||||
| Never | n/a | n/a | n/a | n/a | n/a | n/a | Referent | Referent |
| Former | n/a | n/a | n/a | n/a | n/a | n/a | 0.85 (0.40-1.82) | 1.15 (0.75-1.74) |
| Current | n/a | n/a | n/a | n/a | n/a | n/a | 1.61 (0.44-5.84) | 0.93 (0.36-2.41) |
| Pack-years smoking | n/a | n/a | n/a | n/a | n/a | n/a | 0.85 (0.55-1.31) per 1 SD = 22 pack-years increase | 1.14 (0.97-1.34) per 1 SD = 14 pack-years increase |
| Any alcohol use in the past year | n/a | n/a | n/a | n/a | n/a | n/a | 1.51 (0.72-3.17) | 1.40 (0.97-2.02 |
| Alcohol use (usual drinks/week) | ||||||||
| 0 drinks/week | n/a | n/a | n/a | n/a | n/a | n/a | n/a | n/a |
| 1-3 drinks/week | n/a | n/a | n/a | n/a | n/a | n/a | n/a | n/a |
| 4 + drinks/week | n/a | n/a | n/a | n/a | n/a | n/a | n/a | n/a |
| Bone-positive medication use, any | n/a | n/a | n/a | n/a | n/a | n/a | n/a | n/a |
| Thiazide | 1.45 (0.81-2.62) | n/a | n/a | n/a | n/a | n/a | n/a | 1.40 (0.75-2.63) |
| Androgen | n/a | n/a | n/a | n/a | n/a | n/a | n/a | n/a |
| Calcium | n/a | n/a | n/a | n/a | n/a | n/a | 3.51 (0.43-28.48) | n/a |
| Bisphosphonate | n/a | n/a | n/a | n/a | n/a | n/a | n/a | n/a |
| Calcitonin | n/a | n/a | n/a | n/a | n/a | n/a | n/a | n/a |
| Estrogen | n/a | n/a | n/a | 0.50 (0.25-0.98) | n/a | n/a | n/a | n/a |
| SERM | n/a | n/a | n/a | n/a | n/a | n/a | n/a | 2.72 (0.65-11.38) |
| Bone-negative medication use, any | n/a | n/a | n/a | n/a | n/a | n/a | n/a | n/a |
| Loop diuretics | n/a | n/a | n/a | n/a | n/a | n/a | n/a | n/a |
| SSRI | 2.30 (1.12-4.73) | n/a | 3.68 (1.49-9.11) | n/a | 3.67 (1.20-11.21) | n/a | n/a | 0.55 (0.16-1.83) |
| TCA | 1.88 (0.59-5.95) | n/a | n/a | n/a | n/a | n/a | 2.42 (0.31-19.03) | 3.08 (0.91-10.37) |
| Thyroid | n/a | n/a | n/a | n/a | n/a | n/a | n/a | 0.47 (0.16-1.37) |
| Anticonvulsants | n/a | n/a | n/a | n/a | n/a | n/a | n/a | n/a |
| Benzodiazepines | n/a | n/a | n/a | n/a | 2.71 (0.31-23.44) | n/a | n/a | n/a |
| Sedatives | n/a | n/a | n/a | n/a | n/a | n/a | n/a | 5.31 (0.69-41.12) |
| PPI | n/a | n/a | n/a | n/a | n/a | n/a | 2.25 (0.51-9.86) | 2.09 (0.87-5.01) |
| Other hormone-negative medication used | n/a | n/a | n/a | n/a | n/a | n/a | n/a | 3.17 (0.76-13.16) |
| Glucocorticoids | n/a | n/a | n/a | n/a | n/a | n/a | n/a | n/a |
| Muscle relaxants | n/a | n/a | n/a | n/a | n/a | n/a | n/a | n/a |
| Presence of prevalent CVD | n/a | n/a | n/a | n/a | n/a | n/a | n/a | n/a |
| Presence of prevalent rheumatoid arthritis | n/a | n/a | n/a | n/a | n/a | n/a | 2.38 (0.84-6.73) | 0.66 (0.27-1.62) |
| Age at menopause [in postmenopausal women only] | n/a | n/a | n/a | n/a | n/a | n/a | n/a | n/a |
| Duration of diabetes | n/a | 1.04 (0.94-1.45) per 1 SD = 7 years | n/a | n/a | n/a | 1.08 (0.90-1.28) per 1 SD = 7 years increase | n/a | 1.18 (1.01-1.38) per 1 SD = 7 years increase |
| Diabetes medication use | ||||||||
| Thiazolidinediones | n/a | 1.27 (1.03-1.58) | n/a | 1.29 (0.95-1.75) | n/a | n/a | 1.59 (0.86-2.96) | 1.57 (1.09-2.26) |
| Sulfonylureas | n/a | n/a | n/a | n/a | n/a | n/a | n/a | n/a |
| First-generation sulfonylureas | n/a | n/a | n/a | n/a | n/a | n/a | n/a | n/a |
| Second-generation sulfonylureas | n/a | n/a | n/a | n/a | n/a | n/a | n/a | n/a |
| Meglitinides | n/a | n/a | n/a | n/a | 1.67 (0.58-4.81) | n/a | n/a | 2.65 (1.22-5.77) |
| Biguanides | n/a | n/a | n/a | n/a | n/a | n/a | 0.76 (0.41-1.40) | n/a |
| Insulin (any form) | n/a | 1.30 (1.01-1.68) | n/a | 1.67 (1.20-2.30) | n/a | 1.94 (1.22-3.11) | 0.55 (0.21-1.44) | n/a |
| Bile acid sequestrants | n/a | n/a | n/a | n/a | n/a | n/a | n/a | |
| Hemoglobin A1c | n/a | 1.18 (1.07-1.30) per 1 SD = 1% increase | n/a | n/a | n/a | n/a | 0.72 (0.50-1.04) per 1 SD = 1% increase | 1.16 (0.98-1.37) per 1 SD = 1% increase |
| Hemoglobin A1c (%) category | ||||||||
| < 6.0 | n/a | n/a | n/a | n/a | n/a | n/a | n/a | n/a |
| 6.0-6.5 | n/a | n/a | n/a | n/a | n/a | n/a | n/a | n/a |
| 6.5-7.0 | n/a | n/a | n/a | n/a | n/a | n/a | n/a | n/a |
| 7.0-8.0 | n/a | n/a | n/a | n/a | n/a | n/a | n/a | n/a |
| 8.0-9.0 | n/a | n/a | n/a | n/a | n/a | n/a | n/a | n/a |
| > 9.0 | n/a | n/a | n/a | n/a | n/a | n/a | n/a | n/a |
| Michigan Neuropathy Screening Instrument, total scoree | n/a | n/a | n/a | n/a | n/a | n/a | n/a | n/a |
| Presence of diabetic neuropathyf | 1.57 (1.11-2.23) | n/a | 1.88 (1.19-2.98) | n/a | 1.64 (0.87-3.08) | 1.47 (0.95-2.28) | n/a | n/a |
| eGFRg | n/a | n/a | n/a | n/a | n/a | n/a | 0.89 (0.63-1.24) Per 1 SD = 27 mL/min/1.73 m2 increase | 0.88 (0.71-1.09) Per 1 SD = 16 mL/min/1.7 3 m2 increase |
| eGFR category | ||||||||
| G1 (≥ 90 mL/min/1.73 m2) | n/a | n/a | n/a | n/a | n/a | n/a | n/a | n/a |
| G2 (60-89 mL/min/1.73 m 2) | n/a | n/a | n/a | n/a | n/a | n/a | n/a | n/a |
| G3a (45-59 mL/min/1.73 m2) | n/a | n/a | n/a | n/a | n/a | n/a | n/a | n/a |
| G3b or G4 (15-44 mL/min/1.73 m2) | n/a | n/a | n/a | n/a | n/a | n/a | n/a | n/a |
| KDIGO Albuminuria category | ||||||||
| No albuminuria (ACR < 30 mg/g) | 0.66 (0.46-0.96) | n/a | n/a | n/a | 0.53 (0.28-0.98) | n/a | n/a | 0.94 (0.29-3.06) |
| Microalbuminuria (30 mg/g ≤ ACR ≤300 mg/g) | Referent | n/a | n/a | n/a | Referent | n/a | n/a | Referent |
| Macroalbuminuria (ACR > 300 mg/g) | 0.93 (0.45-1.93) | n/a | n/a | n/a | 0.26 (0.03-2.01) | n/a | n/a | 1.13 (0.09-13.50) |
| KDIGO classification of renal failure/CKD progression risk | ||||||||
| Low risk | n/a | n/a | n/a | n/a | n/a | n/a | Referent | Referent |
| Moderate risk | n/a | n/a | n/a | n/a | n/a | n/a | 1.80 (0.88-3.67) | 0.55 (0.20-1.54) |
| High risk | n/a | n/a | n/a | n/a | n/a | n/a | 1.30 (0.30-5.72) | 0.53 (0.06-4.71) |
| Very high risk | n/a | n/a | n/a | n/a | n/a | n/a | NE | NE |
| C-index of model | 0.55 | 0.62 | 0.56 | 0.63 | 0.50 | 0.68 | 0.52 | 0.57 |
Hazard ratios and 95% confidence intervals in bold designate statistically significant associations at an alpha = 0.05 level.
Abbreviations: ACR, albumin to creatinine ratio; BMI, body mass index; CKD, chronic kidney disease; CVD, cardiovascular disease; eGFR, estimated glomerular filtration rate; HR, hazard ratio; KDIGO, Kidney Disease Improving Global Outcomes; PPI, proton pump inhibitor; NE, not estimable; n/a, not applicable; SERM, selective estrogen receptor modulator; SSRI, selective serotonin reuptake inhibitor; TCA, tricyclic antidepressant, as predictor was not included in the best multivariate predictor model for that fracture site.
aMajor osteoporotic fracture is defined as the first occurrence of a hip, thoracic/lumbar vertebrae, lower arm/wrist, or upper arm (humerus)/shoulder/clavicle fracture.
bFrailty fracture is defined as the first occurrence of a hip, pelvis or upper arm (humerus)/shoulder/clavicle fracture.
cReferent group: Diabetes Support & Education.
dOther hormone-negative medications include aromatase inhibitors, leuprolide (Lupron), and medroxyprogesterone acetate (Depo-Provera).
eThe Michigan Neuropathy Screening Instrument consists of a 15-item questionnaire scored from 0 to 15, with higher scores indicating more features suggestive of diabetic neuropathy (22).
fPresence of neuropathy as determined by the Michigan Neuropathy Screening Instrument 15-item questionnaire with a total score of ≥ 4 indicating presence of diabetic neuropathy (22).
geGFR calculated from the 2021 CKD-EPI creatinine equation.
In men, findings from the final multivariate models were divergent from those of the overall population. In men, thiazolidinedione use and insulin use were included only in the lower leg/ankle fracture model, and here they were not statistically significant. In men, SSRI use was associated with all clinical fractures (HR 2.30 [95% CI, 1.12-4.73]), MOF (HR 3.68 [95% CI, 1.49-9.11]), and frailty fractures (HR 3.67 [95% CI, 1.20-11.21]) (Table 3); in the overall population, SSRI use was only associated with MOF. Sulfonylurea use was not included in any final multivariate models in men or women (Table 3).
Sensitivity Analyses of the Baseline BMD Subcohort
The baseline BMD subcohort comprised 1285 participants (Fig. 1), 161 with clinical fractures (32 men, 129 women). Baseline characteristics by incident fracture status are in shown in men, in women, and combined in Supplementary Tables S2, S3, and S4, respectively (27). In combined analyses, those with fractures had lower average baseline total hip BMD (0.96 g/cm2, SD 0.13) compared to those without fractures (1.06 g/cm2, SD 0.14). Fracture sites mirrored the primary cohort, with the most frequent being MOF (n = 82), lower leg/ankle (n = 46), frailty (n = 49), and upper arm/shoulder/clavicle (n = 36) (Supplementary Table S5) (27). In the final multivariate model for all clinical fractures (C-index: 0.70), total hip BMD was the strongest modifiable predictor (per 1 SD = 0.1 g/cm2 increase, HR 0.47 [95% CI, 0.39-0.58]). Sex and non-Hispanic Black race/ethnicity had similar significant associations to the primary analysis. Female sex was the strongest predictor of all potential predictors (HR 3.15 [95% CI, 2.03-4.88]). Here, “strongest” predictor was defined as the potential predictor with the largest absolute change in hazard of incident fracture after standardizing coefficients, considering the most conservative end of the predictor's 95% CI estimate. Higher weight (per 1 SD = 17 kg increase, HR: 1.34, 95% CI: 1.11-1.62) and biguanide use (HR: 1.52, 95% CI: 1.09-2.14) were associated with higher clinical fracture incidence (Table 3).
In sex-stratified prespecified analyses, BMD remained a statistically and clinically significant predictor of clinical fracture among men and women. In men, the final multivariate model (C-index: 0.65), higher weight (per 1 SD = 15 kg increase, HR 1.47 [95% CI, 1.01-2.13]), SSRI use (HR 13.05 [95% CI, 3.50-48.71]), and sulfonylurea use (HR 2.73 [95% CI, 1.23-6.02]) were associated with higher clinical fracture incidence (Table 4), but cell sizes were small (Supplementary Table S2) (27). In the final multivariate model in women (C-index: 0.68), there were no other significant predictors of clinical fracture besides total hip BMD (Table 3).
Hazard ratios for all clinical fractures in persons with type 2 diabetes mellitus and overweight or obesity in multivariate sensitivity analyses: baseline bone mineral density analysis subcohort and annualized weight change analysis subcohort, combined sexes analyses and stratified by sex
| Sensitivity analysis characteristic | Baseline bone mineral density | Annualized weight change | ||||
|---|---|---|---|---|---|---|
| Combined sexes: Multivariate HR (95% CI) | Men: Multivariate HR (95% CI) | Women: Multivariate HR (95% CI) | Combined sexes: Multivariate HR (95% CI) | Men: Multivariate HR (95% CI) | Women: Multivariate HR (95% CI) | |
| Total hip BMD | 0.47 (0.39-0.58) per 1 SD = 0.1 g/cm2 increase | 0.43 (0.27-0.69) per 1 SD = 0.1 g/cm2 increase | 0.46 (0.37-0.57) per 1 SD = 0.1 g/cm2 increase | ___ | ___ | ___ |
| Annualized weight change | — | — | — | 1.04 (0.96-1.14) per 1 SD = 8 kg increase | n/a | 1.07 (0.97-1.19) per 1 SD = 7 kg increase |
| Treatment Arm: Intensive lifestyle interventiona | n/a | n/a | n/a | n/a | n/a | n/a |
| Age | 1.10 (0.92-1.32) per 1 SD = 7 years increase | 1.23 (0.82-1.84) per 1 SD = 6 years increase | 1.09 (0.90-1.32) per 1 SD = 6 years increase | 1.15 (1.04-1.27) per 1 SD = 7 years increase | n/a | 1.16 (1.03-1.30) per 1 SD = 7 years increase |
| Female sex | 3.15 (2.03-4.88) | — | — | 3.60 (2.68-4.83) | — | — |
| Race/ethnicity | ||||||
| Hispanic White | 0.46 (0.14-1.47) | n/a | n/a | 0.70 (0.45-1.09) | 0.55 (0.17-1.73) | 0.72 (0.44-1.16) |
| Non-Hispanic Black | 0.33 (0.16-0.70) | n/a | n/a | 0.32 (0.23-0.45) | 0.55 (0.27-1.12) | 0.28 (0.19-0.41) |
| Non-Hispanic White | Referent | n/a | n/a | Referent | Referent | Referent |
| Other or Mixed race/ethnicity | 0.75 (0.99-1.04) | n/a | n/a | 0.84 (0.64-1.11) | 0.70 (0.37-1.36) | 0.89 (0.63-1.17) |
| Height | n/a | n/a | 1.21 (0.99-1.49) per 1 SD = 7 cm increase | 1.30 (1.13-1.49) per 1 SD = 10 cm increase | 1.13 (0.96-1.34) | 1.20 (1.08-1.34) per 1 SD = 7 cm increase |
| Weight | 1.34 (1.11-1.62) per 1 SD = 17 kg increase | 1.47 (1.01-2.13) per 1 SD = 15 kg increase | 1.18 (0.94-1.47) per 1 SD = 16 kg increase | n/a | n/a | n/a |
| BMI | n/a | n/a | n/a | n/a | n/a | n/a |
| Smoking category | ||||||
| Never | Referent | Referent | Referent | Referent | n/a | Referent |
| Former | 1.23 (0.88-1.73) | 1.12 (0.51-2.44) | 1.89 (0.77-1.83) | 1.11 (0.92-1.33) | n/a | 1.18 (0.91-1.53) |
| Current | 1.78 (0.91-3.48) | 3.11 (0.84-11.54) | 1.41 (0.61-3.28) | 1.32 (0.86-2.04) | n/a | 1.37 (0.79-2.37) |
| Pack-years smoking | n/a | n/a | 1.05 (0.88-1.25) per 1 SD = 11 pack-years increase | n/a | n/a | 1.00 (0.89-1.12) per 1 SD = 14 pack-years increase |
| Any alcohol use in the past year | 1.33 (0.95-1.87) | n/a | 1.64 (1.14-2.36) | n/a | n/a | n/a |
| Alcohol use (usual drinks/week) | ||||||
| 0 drinks/week | n/a | n/a | n/a | n/a | n/a | n/a |
| 1-3 drinks/week | n/a | n/a | n/a | n/a | n/a | n/a |
| 4 + drinks/week | n/a | n/a | n/a | n/a | n/a | n/a |
| Bone-positive medication use, any | n/a | n/a | n/a | n/a | n/a | n/a |
| Thiazide | n/a | n/a | n/a | n/a | n/a | n/a |
| Androgen | n/a | n/a | n/a | n/a | n/a | n/a |
| Calcium | n/a | n/a | n/a | n/a | n/a | n/a |
| Bisphosphonate | n/a | n/a | n/a | 1.71 (0.70-4.19) | n/a | 1.97 (0.80-4.82) |
| Calcitonin | n/a | n/a | n/a | n/a | n/a | n/a |
| Estrogen | n/a | n/a | n/a | 0.58 (0.37-0.93) | n/a | 0.62 (0.39-0.99) |
| SERM | 3.72 (0.45-30.38) | n/a | n/a | n/a | n/a | n/a |
| Bone-negative medication use, any | n/a | n/a | n/a | n/a | n/a | n/a |
| Loop diuretics | n/a | n/a | n/a | n/a | n/a | n/a |
| SSRI | 1.34 (0.63-2.84) | 13.05 (3.50-48.71) | n/a | 1.30 (0.81-2.06) | 2.21 (0.98-5.01) | n/a |
| TCA | n/a | n/a | n/a | 2.17 (0.995-4.72) | n/a | 2.88 (1.12-7.42) |
| Thyroid | n/a | n/a | n/a | 0.75 (0.44-1.27) | n/a | 0.58 (0.30-1.10) |
| Anticonvulsants | n/a | n/a | n/a | n/a | n/a | n/a |
| Benzodiazepines | 1.50 (0.34-6.54) | n/a | 2.13 (0.50-9.03) | n/a | n/a | n/a |
| Sedatives | n/a | n/a | n/a | n/a | n/a | n/a |
| PPI | n/a | 3.36 (0.78-14.57) | n/a | 1.93 (1.18-3.15) | n/a | 2.10 (1.67-3.77) |
| Other hormone-negative medication useb | n/a | n/a | n/a | n/a | n/a | n/a |
| Glucocorticoids | n/a | n/a | n/a | n/a | n/a | n/a |
| Muscle relaxants | n/a | n/a | n/a | n/a | n/a | n/a |
| Presence of prevalent CVD | n/a | n/a | n/a | n/a | n/a | 0.76 (0.52-1.12) |
| Presence of prevalent rheumatoid arthritis | n/a | n/a | n/a | n/a | n/a | n/a |
| Age at menopause [in postmenopausal women only] | n/a | n/a | n/a | n/a | n/a | n/a |
| Duration of diabetes | 1.10 (0.93-1.31) per 1 SD = 6 years increase | n/a | 1.16 (0.96-1.39) per 1 SD = 6 years increase | 1.01 (0.92-1.11) per 1 SD = 7 years increase | n/a | 1.04 (0.93-1.17) per 1 SD = 7 years increase |
| Diabetes medication use | ||||||
| Thiazolidinediones | n/a | 1.94 (0.91-4.16) | n/a | 1.16 (0.95-1.40) | n/a | 1.14 (0.91-1.45) |
| Sulfonylureas | n/a | 2.73 (1.23-6.02) | n/a | n/a | n/a | n/a |
| First-generation sulfonylureas | n/a | n/a | n/a | n/a | n/a | n/a |
| Second-generation sulfonylureas | n/a | n/a | n/a | n/a | n/a | n/a |
| Meglitinides | 0.15 (0.02-1.02) | n/a | 0.25 (0.03-1.83) | n/a | n/a | n/a |
| Biguanides | 1.52 (1.09-2.14) | n/a | 1.40 (0.96-2.05) | n/a | n/a | 1.13 (0.91-1.40) |
| Insulin (any form) | 1.18 (0.77-1.80) | n/a | 1.26 (0.79-2.01) | 1.20 (0.95-1.52) | n/a | 1.29 (0.98-1.71) |
| Bile acid sequestrants | n/a | n/a | n/a | n/a | n/a | n/a |
| Hemoglobin A1c | 1.17 (0.98-1.38) per 1 SD = 1% increase | n/a | 1.13 (0.94-1.35) per 1 SD = 1% increase | 1.12 (1.02-1.23) per 1 SD = 1% increase | n/a | 1.17 (1.05-1.30) per 1 SD = 1% increase |
| Hemoglobin A1c (%) category | ||||||
| < 6.0 | n/a | n/a | n/a | n/a | n/a | n/a |
| 6.0-6.5 | n/a | n/a | n/a | n/a | n/a | n/a |
| 6.5-7.0 | n/a | n/a | n/a | n/a | n/a | n/a |
| 7.0-8.0 | n/a | n/a | n/a | n/a | n/a | n/a |
| 8.0-9.0 | n/a | n/a | n/a | n/a | n/a | n/a |
| > 9.0 | n/a | n/a | n/a | n/a | n/a | n/a |
| Michigan Neuropathy Screening Instrument,c by 1 unit increase in total score | n/a | n/a | n/a | n/a | n/a | n/a |
| Presence of diabetic neuropathyd | n/a | n/a | n/a | 1.18 (0.95-1.47) | 1.54 (1.04-2.26) | 1.09 (0.84-1.42) |
| eGFRe | n/a | 0.72 (0.47-1.08) per 1 SD = 26 mL/min/1.73 m2 increase | n/a | 0.95 (0.85-1.05) per 1 SD = 21 mL/min/1.73 m2 increase | n/a | 0.86 (0.75-0.98) per 1 SD = 16 mL/min/1.73 m2 increase |
| eGFR category | ||||||
| G1 | n/a | n/a | n/a | n/a | n/a | n/a |
| G2 | n/a | n/a | n/a | n/a | n/a | n/a |
| G3a | n/a | n/a | n/a | n/a | n/a | n/a |
| G3b or G4 | n/a | n/a | n/a | n/a | n/a | n/a |
| KDIGO Albuminuria category | ||||||
| No albuminuria (ACR < 30 mg/g) | Referent | n/a | Referent | Referent | n/a | Referent |
| Microalbuminuria (30 mg/g ≤ ACR ≤ 300 mg/g) | 1.55 (0.56-4.31) | n/a | 3.15 (0.72-13.77) | 1.22 (0.95-1.57) | n/a | 2.14 (1.04-4.42) |
| Macroalbuminuria (ACR > 300 mg/g) | 1.22 (0.11-13.95) | n/a | NE | 1.27 (0.76-2.11) | n/a | 4.31 (0.77-23.94) |
| KDIGO classification of renal failure/CKD progression risk | ||||||
| Low risk | Referent | n/a | Referent | n/a | n/a | Referent |
| Moderate risk | 0.98 (0.37-2.57) | n/a | 0.59 (0.14-2.46) | n/a | n/a | 0.57 (0.29-1.12) |
| High risk | 0.57 (0.07-5.00) | n/a | NE | n/a | n/a | 0.26 (0.05-1.24) |
| Very high risk | NE | NE | NE | n/a | n/a | NE |
Hazard ratios and 95% confidence intervals in bold designate statistically significant associations at an alpha = 0.05 level.
Abbreviations: ACR, albumin to creatinine ratio; BMD, bone mineral density; BMI, body mass index; CKD, chronic kidney disease; CVD, cardiovascular disease; eGFR, estimated glomerular filtration rate; HR, hazard ratio; KDIGO, Kidney Disease Improving Global Outcomes; n/a, not applicable; NE, not estimable; PPI, proton pump inhibitor; SERM, selective estrogen receptor modulator; SSRI, selective serotonin reuptake inhibitor; TCA, tricyclic antidepressant, as predictor was not included in the best multivariate predictor model.
aReferent group: Diabetes Support & Education.
bOther hormone-negative medications include aromatase inhibitors, leuprolide (Lupron), and medroxyprogesterone acetate (Depo-Provera).
cThe Michigan Neuropathy Screening Instrument consists of a 15-item questionnaire scored from 0 to 15, with higher scores indicating more features suggestive of diabetic neuropathy (22).
dPresence of neuropathy as determined by the Michigan Neuropathy Screening Instrument 15-item questionnaire with a total score of ≥ 4 indicating presence of diabetic neuropathy (22).
eeGFR calculated from the CKD-Epi equation.
Sensitivity Analysis of the Annualized Weight Change Subcohort
The annualized weight change subcohort contained 3993 participants (Fig. 1), 514 with clinical fractures. Baseline characteristics by incident fracture status are in Supplementary Table S6 (27). Average annualized weight loss (year 1 minus baseline) was similar between those with (−5.08, SD 7.60) and without fracture (−4.76, SD 7.52), as was average annualized weight change percent (−4.66%, SD 6.99% in those with fracture; −4.98%, SD 7.16% in those without fracture). In the final multivariate model (C-index: 0.63), annualized weight change was not significantly associated with clinical fracture (per 1 SD = 8 kg increase, HR 1.04 [95% CI, 0.96-1.14]). Age, sex, and race/ethnicity had similar significant associations to the primary analysis. The associations Hispanic race/ethnicity, other or mixed race/ethnicity, thiazolidinedione, and insulin use were attenuated and no longer significant. Taller height (per 1 SD = 10 cm increase, HR 1.30 [95% CI, 1.13-1.49]), PPI use (HR 1.93 [95% CI, 1.18-3.15]), and higher HbA1c (per 1 SD = 1% increase, HR 1.12 [95% CI, 1.02-1.23]) were associated with higher and estrogen use (HR 0.58 [95% CI, 0.37-0.93]) with lower clinical fracture incidence (Table 4).
In sex-stratified post hoc analyses, in women, the results largely mirrored findings from the overall population. The association of PPI with clinical fracture was attenuated but the association of microalbuminuria with clinical fracture was accentuated such that it was now statistically significant in women only (HR 2.14 [95% CI, 1.04-4.42]) (Table 4). In men, there were far fewer predictors than in the overall population model. Annualized weight change was not a predictor included in the final multivariate model, in contrast to in women only and the overall population. In men, presence of diabetic neuropathy was significantly associated with clinical fracture in the annualized weight change cohort (HR 1.54 [95% CI, 1.04-2.26]) (Table 4), as in the primary analytic cohort of men only (Table 3).
Sensitivity Analyses of Longitudinal BMD Outcomes
One-year total hip BMD loss (g/cm2) was greater in thiazolidinedione users compared to nonusers (P value .02), but this relationship is attenuated in men and women when analyzed separately, and no longer significant. There is no association of thiazolidinedione use and 4-year change in total hip BMD. In univariate analyses, there is no association of sulfonylurea use and 1-year change in total hip BMD. However, 4-year loss in total hip BMD was statistically significantly greater in sulfonylurea users compared to nonusers in the overall population (P value .00), in men (P value .04), and in women (P value .01). Insulin use (in any form) was not associated with longitudinal change in BMD at 1 year or 4 years (Table 5).
1-year and 4-year change in total hip BMD (g/cm2) by selected diabetes medication use, combined sexes analyses for all participants and stratified by sex
| Response variable | All participants | Men | Women | ||||||
|---|---|---|---|---|---|---|---|---|---|
| Medication use: mean (SD) [n] | Medication nonuse: mean (SD) [n] | P valuea | Medication use: mean (SD) [n] | Medication nonuse: mean (SD) [n] | P valuea | Medication use: mean (SD) [n] | Medication nonuse: mean (SD) [n] | P valuea | |
| Thiazolidinedione | |||||||||
| 1-year ΔBMD | −0.014 (0.036) [n = 233] | −0.008 (0.029) [n = 983] | 0.02 | −0.012 (0.036) [n = 115] | −0.007 (0.026) [n = 356] | 0.15 | −0.015 (0.035) [n = 118] | −0.008 (0.031) [n = 627] | 0.07 |
| 4-year ΔBMD | −0.034 (0.051) [n = 216] | −0.033 (0.048) [n = 886] | 0.81 | −0.012 (0.036) [n = 102] | −0.007 (0.026) [n = 309] | 0.23 | −0.039 (0.053) [n = 114] | −0.039 (0.051) [n = 577] | 0.99 |
| Sulfonylurea | |||||||||
| 1-year ΔBMD | −0.009 (0.031) [n = 584] | −0.009 (0.031) [n = 632] | 0.96 | −0.009 (0.027) [n = 248] | −0.008 (0.031) [n = 223] | 0.68 | −0.009 (0.033) [n = 336] | 0.010 (0.030) [n409] | 0.75 |
| 4-year ΔBMD | −0.038 (0.048) [n = 519] | −0.030 (0.048) [n = 583] | 0.00 | −0.028 (0.040) [n = 210] | −0.020 (0.042) [n = 201] | 0.04 | −0.045 (0.052) [n = 309] | −0.035 (0.050) [n = 382] | 0.01 |
| Insulin (any form) | |||||||||
| 1-year ΔBMD | −0.012 (0.033) [n = 202] | −0.009 (0.030) [n = 1016] | 0.22 | −0.009 (0.036) [n = 82] | −0.008 (0.027) [n = 389] | 0.90 | −0.014 (0.031) [n = 120] | −0.009 (0.032) [n = 627] | 0.12 |
| 4-year ΔBMD | −0.033 (0.051) [n = 188] | −0.034 (0.048) [n = 916] | 0.83 | −0.023 (0.052) [n = 72] | −0.024 (0.039) [n = 339] | 0.85 | −0.039 (0.050) [n = 116] | −0.040 (0.052) [n = 577] | 0.95 |
P values in bold are statistically significant at an alpha = 0.05 level.
Abbreviation: ΔBMD, change in bone mineral density.
aP values were derived from a 2-sided t test.
In multivariate analyses, 1-year total hip BMD loss (g/cm2) was greater in thiazolidinedione users and 4-year total hip BMD loss was greater in sulfonylurea users. Insulin use (any form) was not associated with either longitudinal BMD outcome (Table 6).
Estimated change in total hip bone mineral density regression coefficients for predictor variables from multivariate best predictive model results for 1-year and 4-year change in total hip bone mineral density, all participants
| 1-year change in total hip BMD (g/cm2) β (95% CI) | 4-year change in total hip BMD (g/cm2) β (95% CI) | |
|---|---|---|
| Diabetes medication use | ||
| Thiazolidinediones | −0.006 (−0.010, −0.001) | −0.004 (−0.011, 0.004) |
| Sulfonylureas | −0.001 (−0.004, 0.003) | −0.006 (−0.012, −0.001) |
| Insulin (any form) | −0.003 (−0.008, 0.002) | 0.004 (−0.005, 0.012) |
| Age (years) | −0.004 (−0.006, 0.002) | −0.003 (−0.005, 0.001) |
| Female sex | −0.004 (−0.007, 0.0001) | −0.015 (−0.021, −0.009) |
| Race/ethnicity | ||
| Hispanic White | 0.006 (−0.004, 0.017) | 0.003 (−0.015, 0.022) |
| Non-Hispanic Black | 0.006 (0.001, 0.012) | 0.007 (−0.002, 0.017) |
| Non-Hispanic White | Referent | Referent |
| Other or mixed race/ethnicity | 0.000 (−0.004, 0.004) | −0.021 (−0.028, −0.014) |
| Duration of diabetes (years) | 0.000 (−0.002, 0.002) | −0.002 (−0.005, 0.002) |
Beta coefficient estimates and 95% confidence intervals in bold designate statistically significant associations at an alpha = 0.05 level.
Abbreviations: β, beta regression coefficient estimate; BMD, bone mineral density.
Discussion
In this secondary analysis of the Look AHEAD RCT, before adjustment for total hip BMD, thiazolidinedione use and insulin use in any form were significant risk factors for all clinical fractures in persons with type 2 diabetes and overweight or obesity, in addition to traditional fracture risk factors of older age, female sex, and non-Hispanic White race/ethnicity (7, 13). In site-specific secondary analyses, before adjustment for total hip BMD, thiazolidinedione use was a significant risk factor for lower leg/ankle fractures, whereas insulin use in any form was a significant risk factor for MOF and frailty fracture.
Thiazolidinedione use has been associated with increased fracture risk in RCTs in women, independent of age and duration of thiazolidinedione exposure (28). A meta-analysis of observational studies has further shown thiazolidinediones to be associated with fracture in both men and women (14). However, other observational studies have shown no association of thiazolidinediones and fracture in men with type 2 diabetes (29). In our study, we found that thiazolidinedione use was associated with all clinical fracture and lower leg/ankle fracture in the overall study population and in women, but thiazolidinedione use was not associated with fracture in men.
Preclinical data demonstrate that thiazolidinediones activate peroxisome proliferator-activated receptors (PPARs), which shift mesenchymal stem cell differentiation from osteoblast to adipocyte, leading to net bone loss (1). In a meta-analysis of RCTs, thiazolidinedione use for 3 to 24 months was associated with decreased BMD at the lumbar spine, total hip, and forearm in the range of 0.7% to 1.1% (30). Congruent with this literature, we found that 1-year total hip BMD loss (g/cm2) was greater in thiazolidinedione users than nonusers in our overall study cohort. Tramontana et al have shown that in men with type 2 diabetes, thiazolidinedione use was significantly associated with greater bone BMD loss at the total hip (31). If there are sex differences in the association of thiazolidinedione use and fracture risk, that risk may not be mediated entirely by the effects of thiazolidinedione use on BMD. Finally, our findings are consistent with existing literature that thiazolidinedione use increases fracture risk more at peripheral than central sites (14), as we found a significant association of thiazolidinedione use with all clinical fractures and lower leg/ankle fractures but not MOF or frailty fracture.
Observational studies demonstrate that insulin use in type 2 diabetes is associated with increased fracture risk (13, 14, 29, 32), in agreement with our findings that insulin use in any form is a predictor of all clinical fractures, MOF, and frailty fracture. Preclinical evidence suggests that insulin is anabolic in bone, preserving or increasing BMD and bone strength (33). We found no association of insulin use with change in BMD at 1-year or 4-year intervals, compatible with the preclinical evidence. The mechanisms by which insulin use may increase fracture risk are less likely mediated by accelerated BMD loss but are not certain. Insulin use may increase fracture risk via nonskeletal mechanisms, such as increased falls from hypoglycemia (34). We did not have fall data from the NIDDK-CR to examine this further. However, Napoli et al have shown that in men with type 2 diabetes, those who used insulin had increased risk of nonvertebral fractures even after controlling for fall history and BMD (29). Alternatively, the association of insulin use and fracture may be explained by unmeasured confounders, such as worse physical function or other unmeasured comorbidities that influence patient-clinician antidiabetic medication selection. In our study, we found that that insulin use was associated with all clinical fractures, MOF, and frailty fracture in women but there was no association of any fracture subgroup and insulin use in men.
In our study, we found no association of all clinical fractures or any fracture subgroup with sulfonylurea use in the overall population, in men, or in women in the primary analytic cohort. However, we did see that, after controlling for total hip BMD in subset analysis, men with type 2 diabetes who used sulfonylureas had increased risk for all clinical fracture. This association was not seen in the overall population or in women in our study. There is conflicting evidence on the effects of sulfonylureas on BMD and fracture risk (35, 36). However, other observational cohorts have demonstrated an association of sulfonylurea use and increased risk of nonvertebral fractures after controlling for BMD, corroborating our findings (29). We found greater 4-year total hip BMD loss in sulfonylurea users compared to nonusers at baseline. Tramontana et al found similarly that there was greater bone BMD loss at the total hip in men with type 2 diabetes and use of sulfonylureas over an average 4.6-year interval. Together, this data suggests increased fracture risk with sulfonylurea use may be mediated at least in part by BMD loss. However, others suggest the association of sulfonylureas with fracture risk is due to high rate of hypoglycemic events and falls related to the use of these medications (35, 36). We did not have fall data or hypoglycemia data from the NIDDK-CR to examine this further.
In clinical practice, clinicians use various methods to adapt existing fracture risk assessment tools validated in the general population (most commonly FRAX®) to improve fracture prediction in persons with type 2 diabetes (37). An updated version of FRAX, the FRAXplus (fraxplus.org), now incorporates an adjustment for duration of diabetes in addition to traditional fracture risk factors, with or without BMD input. While longer duration of diabetes was statistically significantly associated with first incident clinical fracture, first MOF, and first frailty fracture in univariate analyses, surprisingly, duration of diabetes was not a statistically significant predictor in any of the multivariate models in our study. There is substantial evidence that duration of diabetes is a risk factor for fracture (9, 37-39). In our multivariate models where we simultaneously consider a robust set of potential predictors reflecting the severity of diabetes in a multitude of ways, duration of diabetes appears to not be as impactful as other predictors, such as insulin use. In fact, Vandenput et al discuss that insulin use, as a surrogate for type 2 diabetes severity, was considered in the efforts to update the FRAX algorithm, but ultimately was not included in FRAXplus (40).
In persons with type 1 diabetes, longer duration of diabetes and higher HbA1c are both associated with fragility fracture risk (41). In persons with type 2 diabetes, studies have shown longer duration of diabetes is likewise associated with fracture risk, independent of falls and insulin use (9, 37, 38). The mechanism may be through advanced glycosylation end-products (AGEs); AGEs accumulate in the organic bone matrix in the setting of chronic hyperglycemia, negatively altering the biomechanics of collagen cross-linking (38, 42). In our study, we did not find duration of diabetes to be a significant predictor of any fracture subtype in the primary analytic cohort after controlling for other covariates, including antidiabetic medications and microvascular complications such as peripheral neuropathy. However, longer duration of diabetes was a significant predictor of increased risk of lower leg/ankle fractures in women only in sex-stratified analyses. Duration of diabetes was furthermore not associated with change in total hip BMD in multivariate analyses in our cohort.
Despite the proposed impact of AGEs accumulation in reduced bone quality (42), the role of glycemic control in fracture is conflicting in type 2 diabetes. Oei et al showed increased fracture risk with baseline HbA1c above 7.5% (11). Eckert et al showed highest fracture risk in type 2 diabetes with HbA1c below 6.5% after controlling for hypoglycemic events (10). Longitudinal HbA1c data has shown no difference in fracture risk on standard vs intensive glycemic control however, the standard therapy group still had a relatively low HbA1c (mean 7.5%) (43). Our study showed HbA1c was not a significant predictor of all clinical fracture, MOF, frailty fracture, or lower leg/ankle fracture in the primary overall cohort. However, higher HbA1c was a significant predictor of all clinical fracture in women only. In the subgroup controlling for annualized change in weight, HbA1c was associated with all clinical fracture overall and in women.
Our study suggests fracture risk assessment tools in persons with type 2 diabetes and overweight and obesity may be improved by including antidiabetic medication profile, in particular thiazolidinedione use and insulin use, in the risk assessment rather than or in addition to other diabetes-related risk factors. Leveraging antidiabetic medication prescription data for fracture prediction is a convenient approach as this data is readily available in administrative and electronic health record (eHR) data for incorporation into automated risk assessment tools imbedded in the eHR. Further studies are needed to determine if sex-specific fracture risk models would improve prediction, since our data are inconclusive and may lack sufficient power in men where sample size was smaller and fracture rates lower.
Total hip BMD was the central modifiable factor for fracture risk stratification in our study of persons with type 2 diabetes and overweight or obesity. This is consistent with several reports showing that BMD discriminates fracture risk as well in persons with type 2 diabetes as in persons without type 2 diabetes (44-46). However, persons with type 2 diabetes experience fractures at higher BMD than persons without type 2 diabetes for a given FRAX probability or BMD T-score and age (6, 8, 42, 44). Therefore, prediction of absolute fracture risk assessment using our final multivariate model with inclusion of BMD may still underestimate absolute fracture risk in persons with type 2 diabetes and overweight or obesity. The lack of assessment of calibration of our final multivariate model including BMD, due to relatively small number of fractures in the BMD analysis subcohort, is a limitation of this study.
The association of higher weight with all clinical fractures after controlling for BMD is consistent with existing literature reporting that obesity is a risk factor for fracture after adjusting for BMD (15, 16). Nielson et al demonstrated obesity is associated with nonspine fracture compared to normal weight in older men, and this is at least partially explained by worse physical function (15). Johansson et al showed in their meta-analysis that, before controlling for BMD, lower BMI is protective of lower leg fracture and high BMI is a risk factor for upper arm fracture. After controlling for BMD, they demonstrated that high BMI was a risk factor for both upper arm and all osteoporotic fracture. Given that more than half of the fractures (51%) in the BMD subcohort were upper arm/shoulder/clavicle or lower leg/ankle, our study is consistent with the prior work of Johansson et al, which found that higher weight is significantly associated with all clinical fractures after controlling for BMD.
Most literature suggests biguanide (ie, metformin) use is either neutral or protective with respect to fracture risk (1, 13, 14, 47). Biguanides have an overall anabolic effect on bone in mechanistic studies, activating osteoblasts leading to enhanced bone formation and exerting an anticatabolic effect on osteoclasts inhibiting bone resorption (48). A large, longitudinal study on changes in BMD among women in mid-life found no differences in BMD between initiators and noninitiators of metformin over a median 3 years of follow-up (49). Therefore, we were surprised to find that biguanide use was a predictor of all clinical fractures after controlling for BMD. To our knowledge, there is only one other observational study showing metformin as a risk factor for fracture: a national South Korean cohort study by Choi et al (50). In the study by Choi et al, the authors compared metformin users to nonusers of any antidiabetic medication and concluded that metformin nonusers were likely in mild early-stage diabetes with less complications, explaining the increased fracture risk they saw with metformin use (50). This explanation is not applicable to our study where, in contrast to Choi et al, biguanide use was found to be an independent predictor of all clinical fractures regardless of the simultaneous use or nonuse of insulin in any form and/or other antidiabetic medication use and controlling for other diabetes-related risk factors, such as glycemic control, duration of diabetes, and comorbidities like diabetic neuropathy. Further investigation as to whether biguanide use may increase fracture risk via nonskeletal fracture mechanisms, such as sarcopenia (51) or falls from neuropathy secondary to metformin-induced vitamin B12 deficiency (52), are needed. More likely, biguanide users in our study were subject to confounding by unmeasured risk factors in patient-clinician antidiabetic medication selection decision. It is possible that biguanides were prescribed more frequently for patients with pre-existing high fall and/or fracture risk, such that they were not considered good candidates for alternate antidiabetic medications like insulin, sulfonylureas, or thiazolidinediones. Finally, given this finding was in a small sensitivity analysis only, our results must be viewed in context.
Our study has several strengths, including a well-characterized, multi-ethnic, US national longitudinal cohort of middle-aged and older men and women with type 2 diabetes and overweight or obesity. We had detailed assessment of many potentially important traditional (smoking, alcohol use) and diabetes-related potential fracture risk factors (duration of diabetes in years, validated assessment of diabetic neuropathy) that were not available in prior studies using administrative data (13). A similar secondary analysis for predictors of fracture from the Fenofibrate Intervention and Event Lowering in Diabetes (FIELD) trial was recently published, but did not contain as robust a list of potential antidiabetic and bone-active medication predictors as our study or BMD (32), which were ultimately the most interesting risk factor associations we found in our analyses. Dufour et al have also reported on risk factors for fracture in type 2 diabetes, simultaneously considering traditional and diabetes-related risk factors and BMD in participants in the Framingham Heart Study (53). The study by Dufour et al was smaller, with only 106 incident fractures. Dufour et al considered oral antidiabetic medication use in aggregate only, as opposed to our assessment of individual antidiabetic medications as potential predictors, but they did consider other potentially important predictors (falls, prior fractures, functional sarcopenia measured by grip strength) that were not included in our study. The multivariate models in Dufour et al adjusted for a limited covariate set (age, sex, study cohort assignment, height, weight, current smoking, type 2 diabetes duration) to assess other potential predictors, but they did not construct an optimal model considering all predictors simultaneously as in our study.
Limitations of the current study include its observational, nonrandomized nature with respect to antidiabetic medication use. Under-ascertainment of fractures is possible because Look AHEAD relied on self-report to prompt medical record review for fracture adjudication, and this may disproportionately affect fracture sites less likely to present clinically (ie, vertebral). Our predictor set was restricted to baseline characteristics and was not necessarily reflective of long-term glycemic control or immediate diabetes-related factors at the time of fracture. Look AHEAD randomization occurred between 2001 and 2004, and newer antidiabetic medications that may impact skeletal health (sodium-glucose cotransporter-2 inhibitors, glucagon-like peptide-1 analogues, dipeptidyl peptidase-4 inhibitors) were not considered. Findings from this RCT population may not be generalizable to the larger population of persons with type 2 diabetes and overweight or obesity as persons who had the inability to walk 2 blocks, a history of nontraumatic leg amputation, or the presence of a significant abnormality on a maximum exercise stress test, and therefore some potential participants with clinically significant diabetic neuropathy, may have been excluded prior to randomization in Look AHEAD. Persons with bariatric surgery, on dialysis, or status post kidney transplant were excluded from Look AHEAD. Bone turnover markers were not measured in study participants. There were a relatively small number of fractures in the BMD analyses subcohort, and therefore, it was not possible to determine whether predictors identified in the primary analytic cohort without BMD consideration, in particular thiazolidinedione use and insulin use, remained as significant predictors once BMD was simultaneously considered. Finally, we lack an assessment of the ability of our models to correctly predict absolute fracture risk, ie, calibration, rather than discrimination.
In conclusion, in this secondary analysis of the Look AHEAD RCT, older age, female sex, non-Hispanic White race/ethnicity, thiazolidinedione use, and insulin use in any form were independent predictors of all clinical fracture among a robust group of traditional and diabetes-related clinical predictors before controlling for BMD. Total hip BMD was by far the most important predictor of all clinical fractures in persons with type 2 diabetes and overweight or obesity, when measured. These results suggest that, for middle-aged or older patients with type 2 diabetes and overweight or obesity prescribed thiazolidinediones or insulin in any form, one should strongly consider ordering a dual-energy x-ray absorptiometry (DXA) assessment for ascertainment of BMD and risk stratification for bone preservation medications. Future fracture risk prediction tools could consider inclusion of thiazolidinedione and insulin use to help refine fracture risk prediction in the population of persons with type 2 diabetes and overweight or obesity.
Funding
Look AHEAD was conducted by the Look AHEAD Research Group and supported by the National Institute of Diabetes and Digestive and Kidney Diseases (NIDDK); the National Heart, Lung, and Blood Institute (NHLBI); the National Institute of Nursing Research (NINR); the National Institute on Minority Health and Health Disparities (NIMHD); the Office of Research on Women's Health (ORWH); and the Centers for Disease Control and Prevention (CDC). The data from Look AHEAD were supplied by the NIDDK Central Repository. This manuscript was not prepared under the auspices of the Look AHEAD and does not represent analyses or conclusions of the Look AHEAD Research Group, the NIDDK Central Repository, or the NIH. The work for this manuscript was supported in part by the Career Development Scholars Program of the Medical College of Georgia at Augusta University.
Author Contributions
R.E.E. conceived the idea for the manuscript, helped analyze the data, and wrote the first draft of the manuscript. H.X. performed statistical analysis and contributed to the intellectual content of the manuscript. L.D.C., C.I., Y.D., and K.C.J. helped with conceptualization of the project, helped analyze the data, reviewed the manuscript for intellectual content and edited the manuscript. K.C.J. supervised collection of the data and obtained funding for Look AHEAD. All authors approved the final version of the manuscript.
Disclosures
None of the authors declares a financial or intellectual conflict of interest.
Data Availability
Data from the Look AHEAD: Action for Health in Diabetes [(V9)/https://doi.org/10.58020/wr3g-1218) reported here are available for request at the NIDDK Central Repository (NIDDK-CR) website, Resources for Research (R4R), https://repository.niddk.nih.gov/.
Clinical Trial Information
Clinicaltrials.gov ID no. NCT00017953.
References
Abbreviations
- AGEs
advanced glycosylation end-products
- BMD
bone mineral density
- BMI
body mass index
- HbA1c
glycated hemoglobin
- ILI
intensive lifestyle intervention
- Look AHEAD
Look AHEAD: Action for Health in Diabetes
- Look AHEAD-C
Look AHEAD Continuation Study
- NIDDK-CR
National Institute of Diabetes and Digestive and Kidney Diseases Central Repository
- PPI
proton pump inhibitor
- RCT
randomized controlled trial
- SSRI
selective serotonin reuptake inhibitor
