


Abstract
Context
The adverse skeletal effects of type 1 diabetes (T1D) include deficient bone accrual and lifelong increased fracture risk. The contributors to impaired bone accrual in people with T1D are incompletely understood.
Objective
To determine if urinary calcium excretion is associated with impaired bone accrual in youth with T1D and to characterize the contribution of glycemic control and markers of bone mineral metabolism to urinary calcium excretion.
Design
Observational study.
Participants
Fifty participants with T1D aged 6 to 20 years completed a 12-month longitudinal study of bone accrual. A second cohort of 99 similarly aged participants with T1D completed cross-sectional 24-hour urine and blood collections.
Main Outcome Measure
Whole body less head bone mineral content (WBLH BMC) velocity Z-score and fractional excretion of calcium (FeCa).
Results
Participants in the bone accrual cohort had lower WBLH BMC velocity compared to a healthy reference dataset (Z-score −0.3 ± 1.0, P = .03). FeCa was negatively associated with WBLH BMC velocity Z-score, ρ = −0.47, P = .001. In the urinary calcium excretion cohort, intact PTH (β = −0.4, P = .01), beta c-telopeptide (β = 0.35, P = .007), and either hemoglobin A1c (β = 0.08, P = .03) or urine fractional glucose excretion (β = 0.07, P = .03) were associated with FeCa in multivariable regression models that included known determinants of urinary calcium excretion.
Conclusion
Urinary calcium excretion was negatively associated with bone accrual in this cohort of youth with T1D. Mechanistic studies are needed to determine if interventions to reduce urinary calcium excretion could increase bone accrual and reduce skeletal fragility in people with T1D.
Children and adults with type 1 diabetes (T1D) have impaired bone health that is characterized by deficits in bone mineral density (BMD) (1), abnormalities in bone structure (2), and an increased risk of fracture (3). Evidence of low bone mass in affected children (4) and young adults (5), coupled with findings that childhood-onset T1D has been associated with greater deficits in bone density compared to adult-onset disease (6), suggest that bone accrual prior to the attainment of peak bone mass may be disrupted in people with T1D. There is a growing body of evidence supporting an association between hyperglycemia and adverse skeletal outcomes including impaired bone mineral accrual (7), lower bone mineral density (8), and greater fracture risk (9). The mechanism(s) by which T1D and/or hyperglycemia adversely affect the skeleton remain incompletely understood and are likely multifactorial (10).
Hypercalciuria is commonly cited as a potential contributor to impaired bone health in T1D (11) and urine calcium excretion has been shown to be inversely associated with BMD in other disorders (12). Historically, excess urinary calcium loss has been described as a characteristic of uncontrolled T1D (13). The mechanism of urinary calcium loss in T1D is not entirely understood and has been variably ascribed to be a consequence of an osmotic diuresis driven by glucosuria (14) or the result of intestinal hyperabsorption of calcium (15). The clinical care of T1D has changed dramatically since the aforementioned studies, and contemporary urinary calcium excretion data in individuals with T1D managed according to the principle of intensive glycemic control are lacking. Furthermore, the relationship between urinary calcium and bone accrual during childhood has not been adequately described.
In a recent pilot study that utilized a dual-stable calcium isotope method to investigate calcium absorption in adolescent females with T1D, we found that a quarter of participants were in negative calcium balance at a time when bone mineral accrual should be ongoing (16). Moreover, the calcium deficit appeared to be driven by excess urinary calcium excretion rather than impaired gastrointestinal absorption. The objectives of this study were to further investigate the impact of these prior findings to determine if urine calcium excretion is associated with impaired bone accrual and to investigate the contribution of glycemic control to urine calcium excretion in contemporary youth with T1D.
Methods
Participants
Children and adolescents aged 5 to 20 years with T1D duration of at least 1 year were eligible. This age range was selected to include participants capable of performing 24-hour urine collections and who had not yet achieved peak bone mass (17). Exclusion criteria included body mass index >99th percentile for age and sex, recent use of bone active medications (corticosteroids, diuretics, hormonal contraceptives, antiepileptic drugs, proton-pump inhibitors, GH), or presence of conditions associated with impaired bone mineral metabolism (thyroid, celiac, or chronic kidney disease). Participants were recruited from the Pediatric Diabetes Clinic at the University of Rochester (URMC). The study was approved by the URMC Institutional Review Board. Written informed consent and assent (children aged 8-17 years) were obtained for all participants.
Study Design
The study design is illustrated in Fig. 1 and consisted of 2 components: a longitudinal study of bone accrual with 2 study visits at baseline and 12 months and a cross-sectional study of the determinants of 24-hour urine calcium excretion. Recruitment into the bone accrual study continued until 60 participants completed the baseline study visit. Recruitment into the 24-hour urine study continued until 100 participants returned adequate urine samples. Participants were allowed to enroll in both studies.
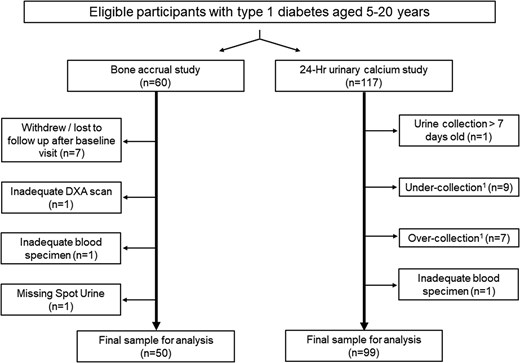
Study flow chart. Individuals with type 1 diabetes of at least 1 year and between the ages of 5 and 20 years were eligible to participate. Recruitment into the DXA study continued until 60 participants completed the first study visit; recruitment into the determinants for 24-hour urine calcium study continued until 100 participants returned complete urine collections. The final sample of urine collections for analysis included data from 44 subjects who completed the DXA study. 1Adequacy of 24-hour urine collections based on age and sex-specific data for 24-hour urine creatinine excretion in children and young adults (18).
Abbreviations: DXA, dual-energy X-ray absorptiometry.
Dual Energy X-Ray Absorptiometry
Whole body (WB) and regional dual-energy X-ray absorptiometry (DXA) scans were performed on a Hologic (Hologic Inc., Bedford, MA) Horizon W densitometer, software version 13.6.04 in the Clinical Research Center at URMC. Participants were scanned in hospital scrubs and were asked to remove all potentially radiopaque objects including insulin pumps and continuous glucose monitors (CGMs). Subregions were created for pumps/CGMs that could not be removed and visible in soft tissue on WB scans (8 scans). Subregion BMC was then subtracted from whole body less head (WBLH) BMC prior to calculation of Z-scores. The National Health and Nutrition Examination Survey body composition adjustment was not applied. All scans were analyzed by a single analyst (N.R.) using standard techniques with the machine-provided software and reviewed by the principal investigator (D.W.) to ensure that subject positioning and scan analysis conformed with manufacturer specifications and pediatric guidelines (19). Scans with motion artifact, pumps/CGMs overlying bone, or improper positioning affecting region of interest were excluded from analysis (n = 1, 0.9%). Precision for the lab for pediatric WB scans was 1% coefficient of variation, with least significant change of 0.028 g/cm2.
Urine Collections
Twenty-four-hour urine samples were collected at home within 7 days of the study visit. Participants received verbal and written instructions to begin 24-hour urine collection with the second morning void and end after the first morning void the following day. Date and time of collection start and stop were recorded and used to determine collection duration. Adequacy of collection was determined by analysis of 24-hour urine creatinine (mg/kg/day) excretion. Samples with 24-hour urine creatinine excretion rates above or below 2.5 SDs of age- and sex-specific means were excluded (18). Twenty-four-hour urine samples were analyzed for calcium, phosphorus, glucose, sodium, citrate, creatinine, and osmolality at URMC. For the bone accrual study, random spot urine samples were additionally collected at the study visit. Fractional excretion of calcium [FeCa, (urine calcium*serum creatinine) / (urine creatinine*serum calcium)] was used to assess urinary calcium (and other analyte) excretion relative to creatinine.
Bloodwork
Hemoglobin A1c (HbA1c) was determined by high-performance liquid chromatography at URMC. Average HbA1c since diagnosis was calculated from capillary samples obtained at routine clinic visits. Serum calcium, magnesium, and phosphorus were performed by automated clinical chemistry analyzer (Beckman AU680), intact PTH by electrochemiluminescent immunoassay, and 1,25-dihydroxy vitamin D [1,25(OH)2D] and 25-hydroxyvitamin D [25(OH)D] by immunoaffinity extraction and liquid chromatography-tandem mass spectrometry at the University of Washington (20). Total calcium was corrected for serum albumin for analysis [corrected calcium = 0.8*(4 g/dL—albumin)+calcium]. Beta-CrossLaps (β-CTX) and bone-specific alkaline phosphatase (BSAP) were performed at ARUP Laboratories by quantitative electrochemiluminescent immunoassay.
Other Covariates
Covariates were selected from characteristics previously reported to be associated with bone accrual and urinary calcium excretion in children with T1D and those without chronic disease (7, 21, 22). Racial/ethnic group was determined by participant report. Height was assessed by wall-mounted stadiometer and weight by digital scale. Anthropometric measures were converted into Z-scores using US reference data (23). Height velocity was assessed by review of a clinical growth chart over the prior 12 months and reported as cm/yr. Pubertal status was determined by direct inspection/palpation by a pediatric endocrinologist (D.W.). Participants were instructed to record all food, beverage, and supplement intake on the day of the 24-hour urine collection. Participant dietary intake data was reviewed in person by a bionutritionist and analyzed for calcium intake using the Nutrition Data System for Research Software (Nutrition Coordinating Center, University of Minnesota). A revised version of the Short Calcium Questionnaire was used to assess typical calcium intake based upon the number of food/supplement servings consumed in a typical week (24). Dietary calcium insufficiency was determined according to Institute of Medicine guidelines for recommended dietary allowance (25). T1D, fracture, and other medical history were obtained by interview and medical record review.
Statistical Analyses
DXA bone [BMC and areal BMD (aBMD)] and body composition [whole body fat and lean body mass (LBM)] outcomes were converted into sex- and race-specific (Black vs non-Black) Z-scores respective to age using published reference data from the Bone Mineral Density in Childhood Study (BMDCS) (26, 27); BMC and aBMD were then adjusted for height Z-score to address known associations between stature and DXA bone outcomes (26). Bone accrual was primarily assessed by WBLH BMC velocity (change in BMC over study/year), expressed as a sex and pubertal stage-specific Z-score, adjusted for baseline BMC, age, height, height velocity, LBM, and LBM velocity using published reference data from BMDCS (28). Secondary assessments of WBLH BMC velocity Z-scores substituted weight for LBM (to assess expected bone accrual for weight gain) and included only height (to assess expected bone accrual only for linear growth); lumbar spine, total hip, and femoral neck aBMD velocity were also assessed secondarily. The average of baseline and follow-up FeCa samples from spot urine collections was used as the primary exposure variable in the bone accrual cohort. This decision was made because of inadequate 24-hour collections in 36% of participants, based upon findings that spot FeCa was significantly correlated with 24-hour FeCa and that baseline and follow-up FeCa measures were significantly correlated (Supplementary Fig. S1) (29). Sensitivity analyses were performed using alternate measures of urinary analyte excretion (ie, mg/kg/day), restricted to subjects with complete 24-hour collections and using either baseline or 12-month FeCa. FeCa from 24-hour collections was used as the primary outcome variable in the urinary calcium excretion cohort. The prevalence of hypercalciuria among study participants was determined using established definitions for FeCa (>0.02) (30) and 24-hour urine calcium excretion per body weight (>4 mg/kg/24 hours) (31).
Standard descriptive statistics were used to summarize participant characteristics and outcomes. All variables were assessed for normality using the skewness and kurtosis test of normality (sktest command in STATA) and visual inspection of histograms prior to analysis. T-tests or Wilcoxon rank sum tests were used to test group differences, as appropriate. Means were reported ± SD and medians [interquartile range (IQR)]. Group differences in DXA Z-scores between study participants and reference population (BMDCS) were assessed using Student's single sample t-test; all other 2-group comparisons utilized 2-sample t-tests for parametric data or Wilcoxon rank sum for nonparametric data, as appropriate. Correlations were assessed using Pearson's product-moment coefficient (R) or Spearman's rank correlation coefficient (ρ), as appropriate. Multivariable linear regression was used to determine how primary outcomes (bone accrual and FeCa, respectively) associated with clinical characteristics, markers of bone mineral metabolism, and glycemic control. Bivariate modeling was first performed between primary outcomes and factors previously shown to be associated with bone accrual and urinary calcium excretion in children (21). Multivariable regression models were then created by forward selection, using variables with P < .1 on initial bivariate analysis or deemed to be biologically relevant based upon prior literature. Nonparametric variables were log-transformed for inclusion in regression models, as appropriate, when transformation helped achieve assumptions of normality, linearity, and homoscedasticity and improved model fit. Residual and kernel density plots were used to assess linearity and homoscedasticity; goodness of fit was evaluated by Akaike information criterion. Nested regression analysis with F tests was used to determine if the addition of markers of bone mineral metabolism and glycemic control improved the ability to define variability in urinary calcium excretion. FeCa was expressed as percentage [(urine calcium*serum creatinine) / (urine creatinine*serum calcium)*100] for regression analyses to make β-coefficients more readily interpretable. A priori calculations based on an anticipated sample size of 50 participants in the bone accrual study and 100 participants in the urine collection study estimated 80% power at α = 0.05 to detect linear relationships of at least 0.38 between BMC/aBMD velocity and variables of interest and 80% power at alpha 0.05 to detect an additional R2 of 0.06 attributed to HbA1c in multivariable models, respectively. Analyses were conducted using STATA 16 (StataCorp, LP).
Results
Fifty of the 60 participants (83%) enrolled in the bone accrual study completed both DXA scans and yielded evaluable data. A total of 117 participants returned a 24-hour urine collection. Of these, 17 urine collections were excluded due to inadequate collection, and 1 serum sample was excluded due to insufficient blood volume, yielding an evaluable sample of 99 24-hour collections for the urine calcium determinants study. Forty-three participants contributed data to the final samples for both the urine calcium and bone accrual studies. The final evaluable cohorts were predominately male (60% bone accrual study, 54% urine calcium study) and of White racial group (84% bone accrual study, 82% urine calcium study). The T1D and other clinical characteristics of the 2 study cohorts were similar (Table 1). The median T1D duration was 6 years (range 1-18) in both studies. The mean HbA1c was 8.6 ± 1.5 and 8.4 ± 1.4 in the bone accrual and urine calcium studies, respectively. A fracture history was reported by 26% of bone accrual participants and 24% of urine calcium participants. All subjects had serum bicarbonate concentrations within the reference range at the study visit. No subjects reported a history of nephrolithiasis. There were no differences in HbA1c or other relevant clinical characteristics in subjects who completed the bone accrual study compared to those who dropped out after the first visit. Excluded participants in the urine calcium study had greater HbA1c (9.3 ± 1.9, P = .03) compared to evaluable participants but did not differ by age, sex, or racial group.
Characteristics of participants with T1D completing study procedures
| Bone accrual studya | 24-hour urine study | |
|---|---|---|
| n | 50 | 99 |
| Male | 30 (60)b | 53 (53.5) |
| Racial group | ||
| White | 42 (84) | 81 (81.8) |
| Black or African American | 4 (8) | 8 (8.1) |
| Non-White Hispanic | 3 (6) | 8 (8.1) |
| Asian | 1 (2) | 2 (2) |
| Age, year | 15.1 (12.6-18.6)c | 15.2 (6.2-20.9) |
| Pubertal stage | ||
| 1 | 4 (8) | 7 (7) |
| 2-4 | 24 (48) | 46 (46.5) |
| 5 | 22 (44) | 46 (46.5) |
| T1D duration, year | 6.4 (3.5-9.0)d | 6.4 (3.7-9.5) |
| HbA1c, % | 8.6 ± 1.5e | 8.4 ± 1.4 |
| Average HbA1c from diagnosis | 8.3 ± 1.1 | 8.2 ± 1.0 |
| Insulin pump | 42 (84) | 80 (80.8) |
| Daily insulin dose, units/kg/day | 0.9 ± 0.2 | 0.9 ± 0.2 |
| Overweight/obesef | 17 (34) | 32 (32.3) |
| Vitamin D deficientg | 10 (20) | 19 (19.2) |
| Insufficient calcium intakeh | 22 (44) | 37 (39.8) |
| Fracture history | 13 (26) | 24 (24.2) |
Forty-four subjects contributed data to both studies.
Abbreviations: HbA1c, hemoglobin A1c; T1D, type 1 diabetes.
aAs of baseline study visit.
bn (%), all such values.
cMedian (range).
dMedian (interquartile range), all such values not otherwise stated.
eMean ± SD, all such values.
fBody mass index ≥ 85th percentile for age and sex.
g25-hydroxy vitamin D < 20 ng/mL (50 nmol/L).
hCalcium intake by food frequency questionnaire below recommended dietary allowance for age, per Institute of Medicine report.
Bone Density, Growth, and Body Composition Outcomes
The mean baseline and 12-month WBLH BMC Z-scores were −0.2 ± 0.8 and −0.2 ± 0.9, respectively, and did not differ significantly from the reference dataset for healthy children (P = .08 for both; Fig. 2) or from each other (P = .56). The mean height, weight, lean body mass, fat mass, WBLH BMC, and aBMD at all DXA skeletal sites significantly increased from baseline to 12 months over the study period [Supplementary Table S1 (29)]. Weight and fat mass Z-scores were significantly greater, while LBM and femoral neck aBMD Z-scores were significantly lower than the healthy reference datasets.
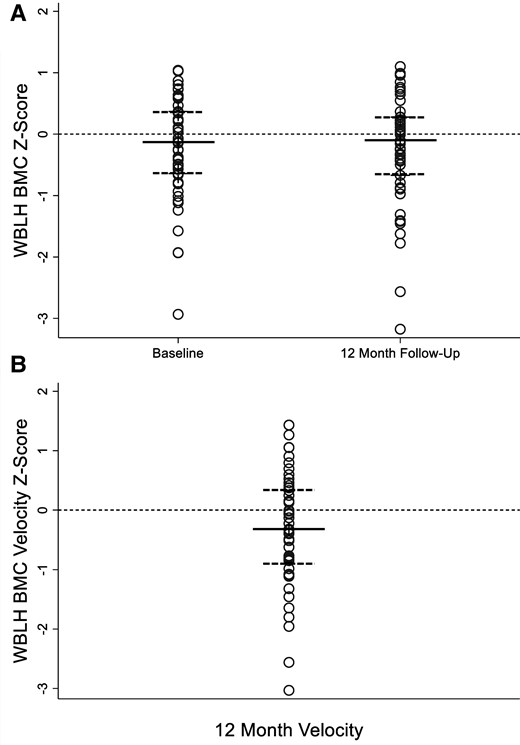
(A) WBLH BMC Z-score at baseline and 12-month follow-up in 50 youths with type 1 diabetes. WBLH BMC Z-score for age and sex adjusted for height Z-score at baseline (−0.2 ± 0.8) and 12-month follow-up (−0.2 ± 0.9) visit did not differ significantly from data for healthy children in the BMDCS from which the Z-scores were derived, P = .08 for both, or from baseline to 12 months, P = .56. Data presented as dot plots to illustrate all data points. Median represented by solid line; 25th and 75th percentile represented by dashed lines. (B) WBLH BMC velocity Z-score of −0.3 ± 1.0 was significantly lower than expected based upon BMDCS data for healthy children, P = .03. WBLH BMC velocity Z-score is sex and pubertal stage specific, adjusted for baseline BMC, age, height, height velocity, lean mass, and lean mass velocity. Data presented as dot plots to illustrate all data points. Median represented by solid line; 25th and 75th percentile represented by dashed lines.
Abbreviations: BMC, bone mineral content; BMDCS, Bone Mineral Density in Childhood Study; WBLH, whole body less head.
Bone Accrual Outcomes
The mean WBLH BMC velocity Z-score was −0.3 ± 1.0, which represents significantly lower bone accrual than expected for age, pubertal status, baseline BMC, growth, and LBM compared to the healthy reference dataset (P = .03). The WBLH BMC velocity Z-score remained significantly lower than the reference dataset if body weight was substituted for LBM in the calculation (Z = −0.3 ± 1.0, P = .03) but was not significant if neither weight nor LBM was included (Z = −0.2 ± 1.0, P = .15).
The WBLH BMC velocity Z-score was significantly lower in subjects who were prepubertal at baseline [n = 4, −1.1 (IQR: −2.2‐0.8)] compared to pubertal participants [n = 46, −0.1 (IQR: −0.8-0.4), P = .02) but did not differ by sex or racial group and was not correlated with height, weight, or LBM. Baseline aBMD Z-scores at secondary skeletal sites ranged from 0 ± 1.0 at the distal 1/3 radius to −0.5 ± 1.0 at the femoral neck; aBMD velocity Z-scores ranged from −0.2 ± 0.9 at the femoral neck to −0.3 ± 1.1 at the total hip [Supplementary Fig. S2 (29)]. Four subjects (8%) sustained a fracture over the course of the study. There were no differences in bone accrual, diabetes characteristics, or markers of bone mineral metabolism between those with either a prevalent or incident fracture compared to participants with no fracture.
Urinary Calcium Excretion and Bone Accrual
Greater spot urinary FeCa was significantly associated with lower WBLH BMC velocity Z-score, ρ = −0.47, P = .001 (Fig. 3). The negative association between spot FeCa and WBLH bone accrual was similar when weight was substituted for LBM in the calculation of WBLH BMC velocity Z-score (ρ = −0.50, P = .001), if neither LBM nor weight was included in the calculation (ρ = −0.48, P = .001), and for the simple association between change in raw WBLH BMC and spot FeCa (ρ = −0.45, P = .001). Sensitivity analyses using baseline or 12-month FeCa rather than average FeCa also revealed negative associations with WBLH BMC velocity Z-scores, ρ = −0.37 (P = .01) and ρ = −0.48 (P = .001), respectively. Additional sensitivity analysis using alternative assessments of urinary calcium on both spot (calcium/creatinine ratio) and 24-hour urine samples [FeCa, calcium/creatine ratio, calcium (mg/kg)] confirmed the significant negative association between urinary calcium excretion and bone accrual [Supplementary Fig. S3 (29)]. Further sensitivity analyses excluding 1 participant with the highest urinary calcium excretion confirmed significant relationships between WBLH BMC velocity Z-score and spot urine FeCA, spot urine calcium/creatinine ratio, and 24-hour FeCa. Significance was lost for 24-hour urine calcium/creatinine ratio and 24-hour calcium (mg/kg); see Fig. 3 and Supplementary Fig. S3 legends (29).
![Urinary FeCa was significantly negatively associated with WBLH BMC velocity Z-score in 50 youths with type 1 diabetes. Spearman's rank coefficient of correlation (ρ) shown. FeCa is the average of baseline and 12 month; WBLH BMC velocity Z-score is sex and pubertal stage-specific, adjusted for baseline BMC, age, height, height velocity, lean mass, and lean mass velocity. Sensitivity analyses using baseline (ρ = −0.37, P = .01) or 12-month (ρ = −0.48, P = .001) FeCa, and excluding the subject in the upper left with very high FeCa (ρ = −0.44, P = .002), all confirm the statistically significant relationship between spot urinary FeCa and WBLH BMC velocity Z-score. FeCa calculated as [(urine calcium*serum creatinine) / (urine creatinine*serum calcium)] and expressed as a percentage. Dashed line represents liner trend between FeCa and WBLH BMC velocity Z-score.](https://oup.silverchair-cdn.com/oup/backfile/Content_public/Journal/jcem/110/6/10.1210_clinem_dgae660/1/m_dgae660f3.jpeg?Expires=1750833731&Signature=2Z25PhffFTSPnpyaWNh8D~rFhvBadNaqv2Ekhg-6sMrCP97Z6EUX8LqnAiIvHOOYhcqwVHkvds4W~UyR5xITNDRjpHdmDnyF-3UnoPek6gL9L7O15xEdU~neFCcW1snsvRJTzfC02T0bW70EQoTbboou7DWbvE743NPrJyTYhDVd~37zOW6LZKvovfVmGOis8P~2eG9~faDjyJ-PQm~6~g5vg85HGoityTgW7cfORpohDlHlW2~eXkJD6HFZuv5v1gGHl7QSadGFU8fp3p8BC4OmZOIqWoabHfimvvubKvRxBdQvk53HA~0J0VFv3h3k~GSiDhu2OffnWxoKmFWd7Q__&Key-Pair-Id=APKAIE5G5CRDK6RD3PGA)
Urinary FeCa was significantly negatively associated with WBLH BMC velocity Z-score in 50 youths with type 1 diabetes. Spearman's rank coefficient of correlation (ρ) shown. FeCa is the average of baseline and 12 month; WBLH BMC velocity Z-score is sex and pubertal stage-specific, adjusted for baseline BMC, age, height, height velocity, lean mass, and lean mass velocity. Sensitivity analyses using baseline (ρ = −0.37, P = .01) or 12-month (ρ = −0.48, P = .001) FeCa, and excluding the subject in the upper left with very high FeCa (ρ = −0.44, P = .002), all confirm the statistically significant relationship between spot urinary FeCa and WBLH BMC velocity Z-score. FeCa calculated as [(urine calcium*serum creatinine) / (urine creatinine*serum calcium)] and expressed as a percentage. Dashed line represents liner trend between FeCa and WBLH BMC velocity Z-score.
Abbreviations: BMC, bone mineral content; FeCa, fractional excretion of calcium; WBLH, whole body less head.
WBLH BMC velocity-Z score was significantly associated with PTH (ρ = 0.33, P = .02); trends toward significance were seen for serum calcium (r = −0.23, P = .10) and 1,25(OH)2D (ρ = 0.27, P = .06). Inclusion of PTH, serum calcium, or 1,25(OH)2D in multivariable models did not alter the significance of the negative association between spot urinary FeCa and WBLH BMC velocity Z-score [Supplementary Table S2 (29)]. There were no significant associations between WBLH BMC velocity Z-score and other covariates of interest including HbA1c, T1D duration, total daily insulin dose, fracture history, calcium intake, 25(OH)D, BSAP, or β-CTX.
Factors Associated With Urine Calcium Excretion
Findings from multiple linear nested regression analyses of variables of interest on urinary calcium excretion in the 99 subjects with complete 24-hour urine collections are reported in Table 2. Characteristics associated with 24-hour FeCa in the base model included White (vs non-White) racial group, height velocity, and fractional excretion of sodium. Intact PTH was negatively associated with FeCa while β-CTX was positively associated with FeCa. Their inclusion in the model resulted in a significantly better model fit (explaining 12% of the remaining variance in FeCa, P < .01). 25-OH vitamin D and BSAP were positively associated with FeCa on univariate analysis; however, they became nonsignificant when intact PTH and height velocity were included in the models, respectively. HbA1c was positively associated with FeCa and further improved model fit (explaining 5% of the remaining variance in FeCa, P = .03). Fractional excretion of glucose was also positively associated with FeCa (explaining 5% of the remaining variance in FeCa, P = .03) when substituted for HbA1c in the model. Urinary citrate excretion was assessed in a subset of participants (n = 76). Hypocitraturia (<320 mg/1.73 m2/24-hr) (32) was present in 12% of participants; however, was neither associated with urine calcium excretion or the presence of hypercalciuria. Age, sex, pubertal stage, fracture history, dietary sodium intake, dietary calcium intake, duration of T1D, urine osmolality, serum calcium, and phosphorus were not associated with urinary calcium excretion.
Clinical determinants of 24-hour urine calcium excretion in 99 youths with T1D
| Multiple linear regression analysis of 24-hour urine calcium excretion (fractional excretion of calcium, %)a | ||||||
|---|---|---|---|---|---|---|
| Model | β (95% CI) | P | Rb | Additional variance explained | AIC | Pb |
| Model 1 | 0.35 | 163 | − | |||
| White vs non-White racial group | 0.40 (0.12, 0.68) | .005 | − | |||
| Height velocity | −0.10 (−0.13, −0.06) | <.001 | ||||
| Fractional excretion of sodium (%) | 8.1 (3.93, 12.24) | <.001 | ||||
| Model 2 (+ markers of bone mineral metabolism) | 0.43 | 12% | 153 | .002 | ||
| White vs non-White racial group | 0.37 (0.10, 0.65) | .002 | ||||
| Height velocity | −0.14 (−0.19, −0.09) | <.001 | ||||
| Fractional excretion of sodium (%) | 7.71 (3.70, 11.71) | <.001 | ||||
| Intact PTHa | −0.38 (−0.66, −0.09) | .010 | ||||
| Beta-c-telopeptidea | 0.35 (0.10, 0.60) | .007 | ||||
| Model 3 (+ HbA1c) | 0.46 | 5% | 151 | .03 | ||
| White vs non-White racial group | 0.45 (0.18, 0.72) | .002 | ||||
| Height velocity | −0.14 (−0.19, −0.09) | <.001 | ||||
| Fractional excretion of sodium (%) | 7.18 (3.22, 11.13) | .001 | ||||
| Intact PTHa | −0.34 (−0.62, −0.06) | .019 | ||||
| Beta-c-telopeptidea | 0.36 (0.11, 0.61) | .005 | ||||
| HbA1c | 0.08 (0.01, 0.15) | .033 | ||||
| Alternate model 3 (+ 24-hour urine glucose) | 0.46 | 5% | 151 | .03c | ||
| White vs non-White racial group | 0.41 (0.14, 0.67) | .003 | ||||
| Height velocity | − 0.13 (−0.18, −0.08) | <.001 | ||||
| Fractional excretion of sodium (%) | 7.06 (3.09, 11.02) | .001 | ||||
| Intact PTHb | −0.40 (−0.68, −0.12) | .006 | ||||
| Beta-c-telopeptideb | 0.33 (0.08, 0.58) | .009 | ||||
| Fractional excretion of glucose (%) | 0.07 (0.01, 0.12) | .028 | ||||
Fractional excretion of calcium calculated as [(urine calcium*serum creatinine) / (urine creatinine*serum calcium)*100].
Abbreviations: AIC, Akaike information criterion; CI, confidence interval; HbA1c, hemoglobin A1c; T1D, type 1 diabetes.
aLog-transformed.
bFor additional variables from nested regression.
cCompared to model 2.
Sensitivity analyses of urinary calcium excretion as mg/kg/day yielded similar results, whereby the addition of HbA1c and urine glucose to models explained 4% (P = .04) and 11% (P = .01) of the remaining variability in urinary calcium excretion, respectively. HbA1c (β = 0.002, P = .02), spot fractional excretion of glucose (log-transformed, β = 0.002, P = .01), and intact PTH (log-transformed, β = −0.01, P < .01) but not β-CTX or BSAP were associated with spot FeCa in the bone accrual cohort (n = 50). HbA1c was not significantly associated with intact PTH, β-CTX, BSAP, or other markers of bone mineral metabolism in either the bone accrual or urinary calcium excretion cohorts.
Hypercalciuria
Hypercalciuria as determined by FeCa was present in 4% of participants in both the bone accrual (2/50) and urinary calcium excretion study (4/99); 2 participants contributed as hypercalciuric to both studies. The prevalence was 4% (2/50) and 11% (11/99), respectively, if hypercalciuria was defined relative to weight [urine calcium >4 mg/kg/24-hr (35 µmol/kg/24-hr]. Participants with hypercalciuria in the bone accrual cohort had significantly greater dietary calcium intake and lower PTH and bone accrual compared to those with normocalciuria [Supplementary Table S3 (29)]. In the urinary calcium excretion cohort, urine glucose excretion was significantly greater in participants with hypercalciuria compared to those with normocalciuria; no other characteristics of interest differed significantly between the 2 groups. HbA1c was nonsignificantly greater in participants with hypercalciuria vs normocalciuria in both cohorts [bone accrual cohort: 10.5 (IQR: 8.0, 12.9) vs 8.4 (IQR: 7.7, 9.4), P = .39; urinary calcium cohort: 10.1 (IQR: 8, 13) vs 8.3 (IQR: 7.5, 9.2), P = .19). Because the definition of hypercalciuria remains unclear, data are also presented by quartile of FeCa [Supplementary Table S4 (29)]. The proportion of White participants was significantly greater at higher vs lower quartiles of FeCa in both cohorts. Bone accrual and PTH were lower at higher vs lower quartiles of FeCa in the bone accrual cohort. Age was significantly greater and BSAP was significantly lower at higher vs lower quartiles of FeCa in the urinary calcium cohort. Numeric increases in both HbA1c and urinary glucose excretion from lower to higher quartiles of FeCa were observed in both cohorts but did not differ statistically.
Discussion
Youths with T1D aged 8 to 20 years in this study had lower bone accrual than expected for age, sex, pubertal stage, lean mass accrual, and growth. Greater urine calcium excretion was associated with a lower rate of bone accrual. Both short (urine glucose concentration) and long (HbA1C) term markers of glycemic control were associated with greater urinary calcium excretion, but neither was directly associated with bone accrual.
Hypercalciuria has long been described as a complication of T1D (33). Studies conducted prior to the modern era of intensive glycemic control reported a prevalence of hypercalciuria in children with T1D of 25% to 50% (34, 35), much greater than the 4% prevalence of hypercalciuria identified in our cohort. Reported mean urine calcium to creatinine ratios were also greater: ∼0.2 in prior studies compared to 0.1 in the present study. The average HbA1c of study participants in the prior studies was between 9% and 10%. This is greater than the 8.5% observed in our overall cohorts but similar to the average HbA1c of the subset of subjects with hypercalciuria. While there may be other clinical factors that differed between the prior and current studies, the finding that urinary calcium excretion is lower in a modern cohort of T1D youth with tighter glycemic control further supports the premise that hyperglycemia is an important determinant of urinary calcium excretion. No participants in our study reported a history of nephrolithiasis. Further studies are needed to determine the risk of stone formation in individuals with T1D with hypercalciuria or hypocitraturia. It is interesting to note that WBLH BMC velocity accrual Z-scores that only accounted for changes in height (and did not account for changes in body weight or LBM) did not differ significantly from the healthy reference dataset. This suggests that there may be a failure to accrue bone mineral in response to increased bone loading from weight and lean mass gains. Further observational or interventional studies to study the relative impacts of changes in growth, weight, and lean mass on bone accrual are needed to clarify these relationships.
Our study is the first to identify a negative relationship between urinary calcium excretion and bone accrual in youth with T1D. The use of BMC and aBMD velocity Z-scores that account for age, sex, pubertal stage, lean mass accrual, and growth rate is a strength of this study as growth and puberty are important determinants of both bone accrual and urinary calcium excretion. Multiple studies conducted in children and adults with other conditions such as idiopathic hypercalciuria and urolithiasis have described associations between excess urinary calcium excretion, low bone mass, and skeletal fragility (36-39). These data are supported by similar findings in rodent models of hypercalciuria (40). Urinary calcium excretion has also been shown to be negatively associated with BMD even in the absence of clinical hypercalciuria or stone disease (41-43). Treatment to reduce urinary calcium excretion with thiazide diuretics and potassium citrate was shown to promote bone accrual in children with idiopathic hypercalciuria (44). Together, these findings suggest that studies of the effect of interventions to reduce urinary calcium excretion on bone outcomes should be considered in youth with T1D.
The mechanism linking urine calcium excretion to impaired bone mineral accrual cannot be fully elucidated from the current study. One hypothesis is that excess calcium losses into the urine may diminish calcium availability for deposition into bone at a time of high BMC accretion. Over time, such a deficit could negatively impact the attainment of peak bone mass (45). Studies in females with T1D have reported positive relationships between calcium intake, BMD, and bone strength, supporting the importance of calcium status to bone density and strength in youth with T1D (46, 47). Our data suggest that an osmotic diuresis does not fully explain the negative relationship between urinary calcium excretion and impaired bone accrual. In that scenario, we would have expected to see a positive relationship between PTH and FeCa, as PTH should rise in response to excess urinary calcium loss. One possible explanation for the absence of a positive relationship between PTH and FeCa is the effect of T1D to cause a relative hypoparathyroidism, which has been proposed previously (48). Further, it is possible that diminished PTH secretion or another effect of T1D to lower bone formation could result in less capacity for the skeleton to deposit calcium. Evidence of low bone formation has been described in both human (49, 50) and preclinical studies of T1D (51). Univariate analysis suggested a negative relationship between BSAP and urine calcium excretion in this study, supporting diminished bone formation as a plausible mechanism; however, this relationship did not remain significant after growth rate (a major determinant of BSAP activity) was included in models. Another possibility is that there is a direct effect of T1D to increase bone resorption, leading to urinary calcium wasting and reduction in PTH secretion. There was a significant positive relationship between FeCa and β-CTX (marker of bone resorption) in our data, but there was no significant relationship between β-CTX and bone accrual. Larger studies powered for mediation analysis will be needed to more completely delineate the relationships between glycemic control, growth, bone mineral metabolism, and bone accrual in T1D. Comparison studies including matched healthy controls will also be important to understand if the relationship between urinary calcium excretion and bone mineral accrual is pathologically altered by T1D or varies across different age, sex, and pubertal groups.
Previous work has shown an association between acidosis and urinary calcium excretion in the setting of diabetic ketoacidosis, thought to be mediated by an imbalance between low bone formation and excess bone resorption (52). Serum bicarbonate was not associated with urinary calcium excretion in our sample, though none of the participants was acidotic at the time of study procedures. Curiously, urine osmolality was not associated with urine calcium on either single or multivariable analysis. Due to budgetary constraints, osmolality was assessed at the end of the study from frozen samples rather than on the day of visit with the other analytes. It is possible that the storage time affected concentration of some (ie, glucose) of the contributors to urine osmolality. Similar to prior studies performed in typically developing children, we identified growth rate, self-identified racial group, dietary calcium intake, and urinary sodium excretion as significant contributors to urinary calcium excretion (21, 43). Notably, we were able to further identify bone turnover and glycemic control as important determinants of urine calcium excretion in T1D youth. Future studies including matched controls will be helpful in determining if the relationships between bone turnover and urine calcium differ between individuals with and without diabetes.
Limitations
Urine collections were not conducted in duplicate. Dietary data from the day of the collection and measurement of urine sodium and glucose were included in analyses to address factors that may be associated with day-to-day variations in urine calcium excretion. There is lack of consensus regarding the optimal means of assessing urinary calcium excretion. Spot urine calcium to creatinine ratio is often used clinically, while there is some evidence suggesting that FeCa is more clinically relevant compared to other measures (30). There is also no consensus on the optimal timing of spot urine collection to assess calcium excretion. Random urine collections have been used to inform the development of most of the pediatric reference data for spot urine calcium to creatinine ratio (53-55), while other studies have reported that either first (56) or second (31) morning samples have the highest correlation with 24-hour excretion. Sensitivity analyses using alternative approaches to assessing urine calcium excretion confirmed relevant findings in this study. The results of the multivariable regression analyses performed in this study were designed to be hypothesis generating for future mechanistic studies and should not be construed as predictive models. Future studies of larger sample size and more robust methods for variable selection are needed for this purpose (57). Bone density, body composition, and bone accrual velocity Z-scores were calculated from reference data obtained from healthy children recruited in the 2000s. We think it unlikely that there would be clinically significantly secular changes in these variables in the pediatric population that would alter the associations identified in our cohort, but a future study including matched healthy controls would be helpful in confirming the findings. Physical activity data was not collected. Finally, the mechanisms underlying low bone accrual and skeletal fragility in T1D are likely multifactorial; assessment of other potentially relevant factors including insulin-like growth factor 1 (58) were beyond the scope of this study.
In conclusion, greater urinary calcium excretion was associated with diminished bone mineral accrual over 1 year in youth with T1D. Both measures of short- and long-term glycemic control were identified as significant determinants of urinary calcium excretion. Further experimental studies to clarify the mechanism underlying the relationships between glycemic control, urinary calcium excretion, and bone accrual in youth with T1D and healthy controls are needed to determine if interventions to reduce urinary calcium or promote bone formation could be effective in reducing skeletal fragility.
Funding
D.R.W. was supported by National Institutes of Health K23DK114477. The project was supported by the University of Rochester CTSA award number UL1 TR002001 from the National Center for Advancing Translational Sciences of the National Institutes of Health.
Author Contributions
D.R.W. was at the University of Rochester when the study was conducted and has subsequently changed institutions and is now faculty at The Children's Hospital of Philadelphia, Perelman School of Medicine at the University of Pennsylvania. L.B. has changed institutions and now works at Lotus Clinical Research. B.G. has changed institutions and is now a pediatric resident at Washington University School of Medicine. G.J.S. is now Emeritus Professor of Pediatrics.
Disclosures
D.R.W. has been a paid consultant for PTC Therapeutics and has been the recipient of research grant funding from Inozyme Pharma. None of the other authors have any disclosures.
Data Availability
Restrictions apply to the availability of some or all data generated or analyzed during this study to preserve patient confidentiality given the single-center study design. The corresponding author will on request detail the restrictions and any conditions under which access to some data may be available for sharing.
