


Abstract
Activation of brown adipose tissue (BAT) thermogenesis improves insulin sensitivity and is beneficial in obesity. Emerging evidence indicates that BAT activation increases lipid mediators that play autocrine and endocrine roles to regulate metabolism and inflammation.
The goal of the study was to determine the relationship between 2 distinct approaches of BAT activation (cold exposure and mirabegron treatment) with lipid mediators in humans.
Healthy female subjects (n = 14) were treated with the β3-adrenergic receptor agonist mirabegron (100 mg) daily for 28 days. A subset of female subjects (n = 8) was additionally exposed to cold temperatures (14-16 °C) for 2 hours using a cooling vest prior to initiating mirabegron treatment. A panel of lipid mediators was assessed in plasma using targeted liquid chromatography-tandem mass spectrometry, and their relationship to anthropometric and metabolic parameters was determined.
Activation of BAT with cold exposure acutely increased levels of lipoxygenase and cyclooxygenase products, including 12-hydroxyeicosapentaenoic acid, 12-hydroxyeicosatetraenoic acid (HETE), 5-HETE, 14-hydroxydocosahexaenoic acid (HDHA), an isomer of maresin 2 (MaR2), 17-HDHA, protectin D1 (PD1), and prostaglandin E2. Mirabegron treatment similarly increased these products acutely, although levels of some mediators were blunted after chronic mirabegron treatment. Selected lipid mediators, including an MaR2 isomer, 17-HDHA, 5-HETE, and 15-HETE, positively correlated with nonesterified fatty acids and negatively correlated with the respiratory quotient, while PD1, 15-HETE, and 5-HETE positively correlated with adiponectin.
These results indicate that selected lipid mediators may serve as biomarkers of BAT activation.
Activation of brown adipose tissue (BAT) by the sympathetic nervous system increases nonshivering thermogenesis via uncoupled mitochondrial respiration (1). This activation can be achieved by exposure to cold temperatures or via synthetic agonists that activate β-adrenergic receptors (β-ARs). In humans and mice, this primarily occurs through selective activation of β3-AR (1, 2). Due to increased utilization of glucose and free fatty acids, activation of BAT is linked to improved insulin sensitivity in the context of obesity (1, 3). Accordingly, activation of BAT could represent an approach to therapeutic management of obesity and type 2 diabetes.
In addition to the well-documented roles of BAT in increasing energy expenditure and thereby improving systemic metabolism, emerging evidence indicates that BAT can produce bioactive mediators that have both autocrine and endocrine roles in the context of obesity (1). For instance, we and others have previously shown that lipid-derived mediators including 12,13-dihydroxy-octadecaenoic acid (12,13-diHOME) and 12-hydroxy-eicosapentaenoic acid (12-HEPE) are increased by cold exposure and regulate fatty acid and glucose uptake in BAT, respectively (1, 4-6). Additional studies have demonstrated that BAT activation increases other “batokines” including interleukin-6 and fibroblast growth factor-21 that contribute to interorgan communication between BAT and other metabolic tissues such as the skeletal muscle, liver, and heart (1, 7). Recently, we found that BAT activation during cold exposure resolves systemic inflammation in obesity due in part to increasing levels of proresolving lipid mediator, maresin 2 (MaR2) (8). Importantly, the levels of batokines in the circulation can be increased via cold exposure or β3-adrenergic stimulation (1, 4, 5, 7, 8). These results suggest that BAT activation induces a metabolic program that mediates interorgan communication to both resolve inflammation and improve systemic metabolism in obesity.
Lipid mediators are generated from polyunsaturated fatty acids (PUFAs), such as arachidonic acid (AA), eicosapentaenoic acid (EPA), and docosahexaenoic acid (DHA) via lipoxygenase (LOX) and cyclooxygenase (COX) enzymes. They are rapidly generated upon cellular activation and regulate both the initiation and resolution phases of inflammation. For instance, AA-derived leukotrienes and prostaglandins are generally proinflammatory and regulate pain sensitization, blood flow, and leukocyte recruitment/activation during acute inflammation, while EPA and DHA-derived resolvins, maresins, and protectins dampen inflammatory signaling, blunt leukocyte recruitment, and stimulate phagocyte-mediated clearance of dead cells (9-13). In murine models of obesity, proinflammatory leukotrienes play a causal role in inflammation-induced insulin resistance, while proresolving lipid mediators improve systemic metabolism by resolving inflammation in metabolic tissues such as the white adipose tissue (WAT) and liver (14-16). Notably, both prostaglandins (eg, PGE2) and proresolving mediators (ie, maresin 1) also facilitate thermogenesis in BAT, as well as in beige/brite fat within WAT depots (17-19).
Here, we sought to understand the relationship between BAT activation and lipid mediator levels in humans. We examined levels of LOX and COX-derived lipid mediators in plasma of a cohort of female subjects with documented BAT activation (3). We used 2 distinct approaches to activate BAT, namely cold exposure and β3-AR agonism with mirabegron acutely, and additionally evaluated the effects of chronic mirabegron treatment on lipid mediator levels.
Materials and Methods
Protocol Design and Cohort Characteristics
In this clinical trial, we assessed BAT activation over 2 different time frames, acutely and chronically. The study design and sample size calculations have been described in detail previously (3). In brief, we recruited generally healthy women between ages 18 and 40 years. Exclusion criteria were as described (https://clinicaltrials.gov/ct2/show/NCT03049462). Twenty-two subjects were enrolled in the study, and all 14 subjects who ultimately initiated the study completed it. For acute activation, we used mild cold exposure and then the next day mirabegron, a highly selective β3-AR agonist (20). There was not expected to be any meaningful impact of cold exposure on the subsequent mirabegron-stimulated BAT activity because we have shown that cold exposure of this short duration is long enough for BAT activity to return to baseline (21). With mirabegron, 100 mg was administered orally; 4 hours later, at the predicted peak of its plasma concentration (Tmax), [18F]-2-fluoro-D-2-deoxy-D-glucose (18F-FDG) was administered intravenously, and 60 minutes later positron emission tomography/computed tomography (PET/CT) imaging was done to assess BAT. For chronic BAT activation, only mirabegron was used: 100 mg mirabegron was utilized as an experimental therapeutic intervention and given daily over 4 weeks to determine the effects of chronic mirabegron treatment on BAT activity and multiple other physiological parameters. At the end of the chronic mirabegron treatment, the amount of BAT activity was measured acutely using 18F-FDG for PET/CT as above.
Metabolic Activity and Clinical Parameters
Healthy volunteers who passed screening were admitted to the Metabolic Clinical Research Unit at the NIH Hatfield Clinical Research Center the evening before testing at initiation (Day 1) and completion (Day 28) of the study. The goal was to study all subjects on Days 1-3 and Days 28 to 30, on the same day of their menstrual cycles. Inpatient rooms were kept at 24 °C, and the subjects were asked to go to sleep at the same time each night. Clothing was standardized during each metabolic chamber stay as described previously (3, 22).
The subjects fasted from 00:00 hours until completion of testing later that day. On Day 1/Day 30, the subjects went from their rooms to the metabolic chambers where blood was drawn to measure baseline blood metabolite levels. They entered the metabolic chamber set to an ambient temperature of 20 °C. Resting energy expenditure (REE) and substrate source as reflected by the respiratory quotient (RQ) were measured during a 30-minute period where the subjects were asked to remain still in a chair. Four hours after entering the chamber, we perfused water (14-16 °C) through the tubing of a vest worn by the subjects. One hour later, blood was drawn a second time to measure changes in blood metabolites in response to acute cold exposure. Subjects were then injected with a bolus of 185-MBq (5 mCi) 18F-FDG for PET/CT scanning, after which they spent an additional 60 minutes inside the chamber with limited physical activity to allow for uptake of the radioactive tracer. PET/CT images were acquired and analyzed as described previously (3). Finally, body composition was measured via dual-energy x-ray absorptiometry scan (iDXA, GE Healthcare).
Study Days 3 and 29 consisted of acute activation of BAT via 100 mg of mirabegron. To prevent cold activation, subjects entered the metabolic chamber set to 26 °C at 18:00 the day prior to mirabegron administration. Blood was drawn at 08:00 to measure baseline blood metabolites. 100 mg mirabegron was administered orally at 09:00. The remaining protocol followed the same timing as the days with cold exposure: REE was measured over a 30-minute interval, and blood was drawn at 13:00, followed by 18F-FDG administration, and PET/CT imaging. Study Days 2 and 28 consisted of metabolic testing not reported here.
Measurement of metabolites, hormones, and adipokines were done as described and were reported previously (3). Glucose, insulin, nonesterified fatty acids (NEFAs), glucagon, growth hormone, total triiodothyronine, free thyroxine, thyroid-stimulating hormone (TSH), adrenocorticotropic hormone (ACTH), parathyroid hormone (PTH), total protein, creatine kinase, pyruvate, lactate, cortisol, norepinephrine, epinephrine, and dopamine were measured at the NIH's Department of Laboratory Medicine. For epinephrine and dopamine concentrations that were below the assay detection limit, the half-minimum value was imputed. Lipid profiles (total cholesterol, high-density lipoprotein [HDL] cholesterol, low-density lipoprotein [LDL] cholesterol, and triglycerides), were measured using the Roche Cobas 6000 analyzer (Roche Diagnostics).
Sample Processing and Targeted Liquid Chromatography Tandem Mass Spectrometry Analysis
Plasma was combined with 1 mL ice cold methanol containing deuterated internal standards (MeOH + IS; 500 pg each of d8-5S-HETE, d8-12S-HETE, d8-15S-HETE, d5-17S-HDHA, d4-LTB4, d4-PGE2, d5-LXA4, d5-17R-RvD1, d5-RvD2, d5-RvD3, d5-MaR1, d5-MaR2, and d4-RvE1). Samples were incubated at −80 °C for a minimum of 2 hours. Protein precipitates were then separated by centrifugation at 17 000g for 10 minutes at 4 °C. The supernatants were subjected to C18 solid-phase extraction as in (23). Briefly, C18 columns were placed on a vacuum manifold, washed with methanol, and conditioned with water. Acidified water (pH 3.5, using acetic acid) was added to the samples at 9:1 (v/v) ratio, and the entire volume was loaded onto the C18 columns. Columns were washed with hexane to remove neutral lipids, then products were eluted using methyl formate. These fractions were collected and the solvent was evaporated using a gentle stream of nitrogen, followed by suspension in 50 µL phase (50:50, methanol:water). Samples were vortexed and centrifuged at 200g for 60 seconds at 4 °C, then transferred to 1.5 mL centrifuge tubes. Samples were further centrifuged at 17 000g for 10 minutes at 4 °C to pellet any residual precipitate, and then transferred to amber vials for injection into the liquid chromatography tandem mass spectrometry (LC-MS/MS) system. Alongside each set of samples, a control of MeOH + IS that did not undergo solid-phase extraction was injected to quantify extraction recovery.
Lipid mediators were analyzed using a high-performance liquid chromatography system (Shimadzu) equipped with a Poroshell 120 EC-C18 reverse-phase column (Agilent Technologies; 100 × 4.6 mm, 2.7μm) maintained at 50 °C using a column oven. A mobile phase of methanol:water:acetic acid was used over a gradient ranging from 50:50:0.01 (v/v/v) to 98:2:0.01 (v/v/v) at a constant flow rate of 0.5 mL/minute. The high-performance liquid chromatography system was coupled with a QTrap5500 mass spectrometer (AB Sciex) operating in negative ionization mode. Lipid mediators were identified and quantified using scheduled multiple reaction monitoring transitions optimized for each mediator, as well as by comparison with MS/MS spectra matching with respective synthetic standards in selected samples using enhanced product ion mode scanning. The software used were Analyst (v.1.6.2) for data acquisition and SCIEX OS (v1.7) for analysis.
Standard curves were prepared using synthetic standards (Cayman Chemicals) relating chromatogram peak area to lipid mediator quantity. A minimum of 4 technical replicates were assessed to calculate the coefficient of variation. The lower limit of quantification for each mediator and multiple reaction monitoring transition was defined as the lowest amount injected to obtain a coefficient of variation <20% based on peak area. For peak identification, the chromatographic retention time of lipid mediators in samples were matched with those of synthetic standards that were acquired in parallel (±0.1 minute). For all quantified lipid mediators, the criteria of a signal:noise ratio >5 and above the lower limit of quantification of each mediator was met. Spectral matching was additionally carried out between lipid mediators identified in selected samples compared with synthetic standards that were preuploaded into the software library. Extraction recovery during the solid-phase extraction was measured using the control MeOH + IS sample, with each mediator being matched to a deuterated internal standard with similar chromatographic retention time. Lipid mediator concentrations were then normalized using plasma volume.
Statistics
Paired Student's t-tests were used to compare levels of lipid mediators in each individual subject before and after cold exposure or mirabegron treatment acutely. Paired Student's t-tests were also used to compare day 3 vs day 29 postmirabegron treatment for each subject. Due to a technical acquisition error, monohydroxy products were not able to be quantified in 1 “post-mirabegron” sample (subject 111) at day 3. To calculate Pearson's correlations between lipid mediator concentrations and other physiological and biochemical endpoints, outliers were first removed to limit false correlations. Within each time point, treatment group, and mediator, outlier values were excluded if they exceeded the value of Q3 + 1.5 (IQR) and are indicated in each figure legend. Within a treatment group, the mediator was excluded if it was missing in more than 50% of the samples for purposes of calculating Pearson's correlations. Only correlations < −.5 or >.5 were tested for statistical significance (P < .05). No correction for multiple testing was done. All statistical analysis was completed using Graphpad Prism (v. 9).
Study Approval
This clinical trial was registered with Clinicaltrials.gov (NCT03049462) and has the FDA Investigational New Drug registration number 116246. This study was approved by the Human Studies Institutional Review Board of the NIDDK and the NIH Radiation Safety Committee. Healthy volunteers were recruited by word of mouth or through the Patient Recruitment and Public Liaison Office of the Clinical Center and provided written informed consent according to Declaration of Helsinki principles.
Results
Activation of BAT by Cold Exposure or β3-AR Agonism
Overall, we evaluated 14 healthy women with the following baseline characteristics: diverse ethnicity, 27.5 ± 1.1 year, and body mass index (BMI) 25.4 ± 1.2 kg/m2 (3). Acute measurement of baseline BAT activity was done using mirabegron (n = 14) and mild cold exposure (n = 8 of the 14) as described in Fig. 1A (3, 24). For cold exposure, the 8 subjects’ blood was drawn at 8:00 to obtain a baseline plasma sample after which they entered a metabolic chamber set to 20 °C (Fig. 1B). After 4 hours in the chamber, additional cooling was initiated by turning on the flow of water (14-16 °C) into the tubing of a vest that the subjects were wearing. At 13:00, 5 hours after entering the chamber and 1 hour after the vest cooling was initiated, we drew blood again to permit the measurement of blood metabolites in response to cooling. For mirabegron treatment, all 14 healthy female subjects entered the metabolic chamber set to 26 °C at 18:00 and stayed overnight until 8:00 when blood was drawn for baseline measurements. Mirabegron (100 mg) was ingested orally at 9:00, and blood was drawn at 13:00 to assess acute and chronic effects of mirabegron (Fig. 1B, lower panel). Using this protocol, we have previously reported that mirabegron treatment for 27 days increases BAT activity in this cohort, as assessed via 18F-FDG PET/CT (3). As reported, the acute dose of mirabegron on both Day 1 and Day 28 lowered the RQ (−0.069 ±0.007 and −0.051 ± 0.007, respectively; both P < .001), indicating a net increase in fat oxidation. In addition, we measured levels of 30+ metabolites, hormones, and factors associated with glucose and lipid metabolism, including glucose, NEFA, β-hydroxybutyrate, lactate, and pyruvate (3). Not reported at that time were the results seen before and after cold exposure. In the present study, plasma samples from this cohort (n = 8-14) were utilized to additionally assess lipid mediators and to determine whether their levels correlated with these parameters.
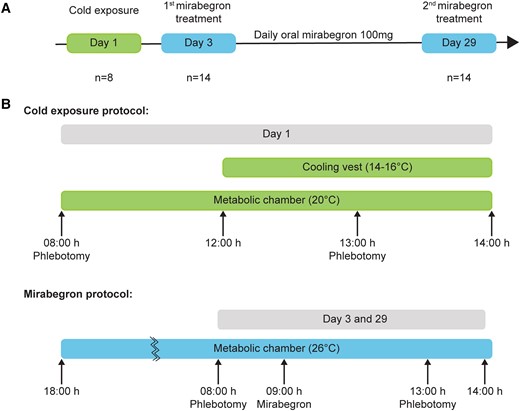
Treatment schemes for cold- and mirabegron-stimulated BAT activation. (A) Flow diagrams outlining the study design. All healthy volunteers (n = 14) were subjected to mirabegron treatment daily for 27 days. A subset of these volunteers (n = 8) were subjected to cold exposure 2 days prior to initiation of mirabegron treatment. (B) For the cold exposure protocol, blood was drawn from subjects prior to entering a metabolic chamber. After 4 hours, the subjects were exposed to cold using a cooling vest and blood was additionally drawn after 1 hour. For mirabegron treatment, subjects completed a dual-energy x-ray absorptiometry scan and then entered the metabolic chamber on Day 3 or 29 for a total of 20 hours, during which blood was drawn prior to and post mirabegron treatment. Mirabegron treatment continued for 27 days.
Cold Exposure and Mirabegron Treatment Increase 12-LOX Products in Plasma
In the original report of the 14 women whose BAT activity had already been quantified (3), we showed that treatment for 4 weeks with mirabegron led to higher levels of BAT metabolic activity, energy expenditure, and insulin sensitivity without any changes in anthropometric measures such as weight or body fat mass. Not measured at the time were the women's acute responses to cold exposure in the subset of 8 women. Cold exposure and mirabegron produce different physiological effects, yet 1 prominent overlapping response is BAT activation (22, 25). Therefore, changes in metabolites that were similar in response to both cold and mirabegron were more likely to be associated specifically with BAT (3, 24).
We initially examined the effects of mirabegron and cold exposure on levels of 12-LOX products following the protocols outlined in Fig. 1 because we have previously shown that 12-LOX products play a role in metabolism and inflammation during BAT activation (4, 8). An overview of the 12-LOX pathway, showing the conversion of substrates AA, EPA, and DHA to their respective 12-LOX products 12-HETE, 12-HEPE, and 14-HDHA, is depicted in Fig. 2A. Of note, 14-HDHA serves as a biosynthetic pathway marker for the maresin pathway that leads to the formation of MaR1, MaR2, and related structural isomers via 14-hydroperoxyDHA and a short-lived 13S,14S-epoxy intermediate (26-28). To assess the impact of BAT activation on 12-LOX products, we carried out targeted LC-MS/MS analysis on plasma collected before and after cold exposure. Cold exposure significantly increased the plasma concentrations of 12-HETE, 12-HEPE, and 14-HDHA (Fig. 2B and Table 1). In our prior study, we identified 2 potential structural isomers of MaR2 in plasma and BAT based on distinct retention times (RTs) in our LC system, but with MS/MS spectra similar to authentic MaR2. We denoted these as MaR2 isomer I (RT + 0.1 minute) and MaR2 isomer II (RT + 0.3 minutes). In the present study, we identified MaR2 isomer II in plasma and found that it increased significantly with cold exposure, whereas MaR2 isomer I was not readily identified (Fig. 2B and Table 1). Next, we investigated the effects of acute mirabegron treatment on levels of products of the 12-LOX pathway. Similar to cold exposure, a single dose of mirabegron acutely increased the levels of 12-HETE, 12-HEPE, 14-HDHA, and MaR2 isomer II (Fig. 2C and Table 2). Subgroup analysis demonstrated that prior cold exposure did not modify the ability of acute mirabegron to increase these products (data not shown). After chronic mirabegron treatment, acute administration of mirabegron increased only 12-HETE and 12-HEPE, whereas levels of 14-HDHA and MaR2 isomer II did not change (Fig. 2D and Table 2). Of note, there was no cumulative effect of mirabegron on 12-HETE and 12-HEPE levels, as no significant differences were observed when comparing day 3 vs day 29 post-mirabegron values for these mediators (Fig. 2D and Table 2).
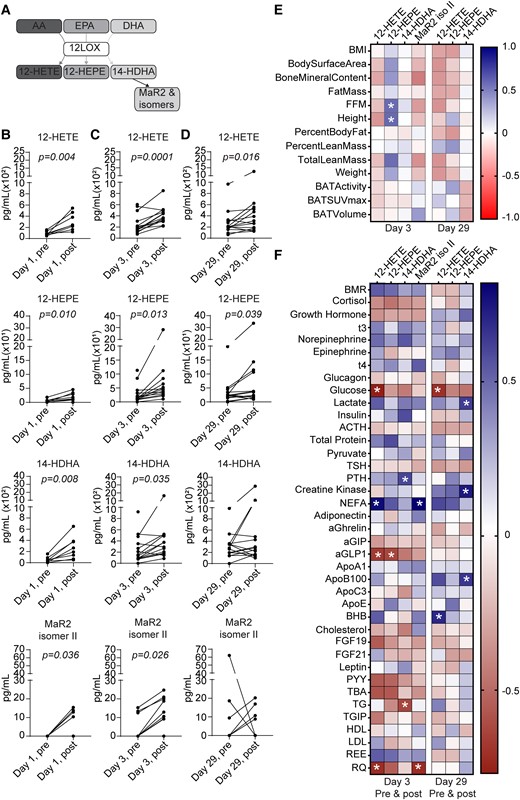
Cold exposure and mirabegron treatment increase 12-LOX products in plasma. (A) Scheme depicting biosynthetic pathways leading to formation of 12-LOX products from arachidonic acid (AA), eicosapentaenoic acid (EPA), and docosahexaenoic acid (DHA). (B-D) Quantification of 12-LOX products 12-HETE, 12-HEPE, 14-HDHA, and MaR2 isomer II was carried out via targeted LC-MS/MS and is presented as pg/mL plasma. Samples were obtained from healthy volunteers before (“pre”; 08:00 hours) and after (“post”; 13:00 hours) cold exposure (B), and before and after daily mirabegron on Days 3 (C) and 29 (D). n = 8 per group (B) or n = 14 per group (C and D). Paired Student's t-tests were carried out for each product and P values of less than .05 are displayed. (E) Heatmap illustrating Pearson's correlations between each 12-LOX product and indicated anthropometric parameters, BAT volume, and activity at Days 3 (n = 12-14) and 29 postmirabegron treatment (n = 11-13). (F) Heatmap illustrating Pearson's correlations between each 12-LOX product and plasma metabolites at Day 3 (n = 11-13) or Day 29 (n = 13) (premirabegron and postmirabegron). BMI, body mass index; FFM, fat-free mass; BMR, basal metabolic rate; NEFA, nonesterified fatty acid; aGIP, glucose-dependent insulinotropic polypeptide; aGLP1, glucagon-like peptide 1; BHB, β-hydroxybutyrate; PYY, peptide YY; TG, triglyceride; TGIP, total glucose-dependent insulinotropic polypeptide; REE, resting energy expenditure; RQ, respiratory quotient. *P < .05.
Quantification of LOX and COX products in plasma of female subjects before and after cold exposure
| Before cold | After cold | |||||
|---|---|---|---|---|---|---|
| Mean | ± | SEM | Mean | ± | SEM | |
| DHA | ||||||
| RvD1 | — | — | ||||
| 17R-RvD1 | — | — | ||||
| RvD2 | — | — | ||||
| RvD3 | — | — | ||||
| 17R-RvD3 | — | — | ||||
| RvD4 | — | — | ||||
| RvD5 | — | — | ||||
| Maresin 1 | — | — | ||||
| Maresin 2 | 5.0 | ± | 5.0 | — | ||
| Maresin 2 isomer I | — | — | ||||
| Maresin 2 isomer II | — | 6.6 | ± | 2.5 | ||
| PD1 | — | 7.9 | ± | 4.9 | ||
| PDX | — | — | ||||
| 17-HDHA | 158.3 | ± | 18.5 | 242.6 | ± | 20.3 |
| 14-HDHA | 58.9 | ± | 19.3 | 265.0 | ± | 71.0 |
| AA | ||||||
| PGE2 | — | 31.5 | ± | 7.9 | ||
| PGD2 | 2.2 | ± | 1.5 | 17.7 | ± | 4.9 |
| PGF2a | 6.9 | ± | 3.2 | 8.6 | ± | 3.4 |
| TXB2 | 102.7 | ± | 27.8 | 567.2 | ± | 114.4 |
| LXA4 | — | — | ||||
| 15R-LXA4 | 2.3 | ± | 2.3 | 3.1 | ± | 3.1 |
| LXB4 | — | — | ||||
| LTB4 | .3 | ± | .3 | — | ||
| 20-OH-LTB4 | — | — | ||||
| 15-HETE | 51.3 | ± | 6.5 | 68.1 | ± | 6.5 |
| 12-HETE | 89.3 | ± | 13.2 | 297.5 | ± | 53.5 |
| 5-HETE | 41.9 | ± | 9.9 | 77.8 | ± | 14.9 |
| EPA | ||||||
| LXA5 | — | — | ||||
| RvE1 | 8.7 | ± | 5.7 | 10.0 | ± | 6.6 |
| RvE2 | — | — | ||||
| RvE4 | — | 3.6 | ± | 3.6 | ||
| 18-HEPE | 115.4 | ± | 26.6 | 134.3 | ± | 15.9 |
| 12-HEPE | 5.0 | ± | 2.1 | 19.8 | ± | 5.4 |
| 5-HEPE | 10.3 | ± | 5.8 | 18.6 | ± | 6.1 |
Values are displayed as pg/mL plasma. Bold text indicates P < .05 by paired Student's t-test (before vs after cold exposure). n = 8.
Abbreviations: AA, arachidonic acid; COX, cyclooxygenase; DHA, docosahexaenoic acid; EPA, eicosapentaenoic acid; HDHA, hydroxydocosahexaenoic acid; HEPE, hydroxyeicosapentaenoic acid; HETE, hydroxyeicosatetraenoic acid; LOX, lipoxygenase; LT, leukotriene; LX, lipoxin; PD, protectin; PG, prostaglandin; Rv, resolvin.
Quantification of LOX and COX products in plasma of female subjects before and after mirabegron treatment
| Day 3 | Day 29 | ||||||||||||
|---|---|---|---|---|---|---|---|---|---|---|---|---|---|
| Before mirabegron | After mirabegron | Before mirabegron | After mirabegron | P value (Day 1 vs Day 28 after mirabegron) | |||||||||
| Mean | ± | SEM | Mean | ± | SEM | Mean | ± | SEM | Mean | ± | SEM | ||
| DHA | |||||||||||||
| RvD1 | — | — | — | — | — | ||||||||
| 17R-RvD1 | — | — | — | — | — | ||||||||
| RvD2 | — | — | — | — | — | ||||||||
| RvD3 | — | — | — | — | — | ||||||||
| 17R-RvD3 | 0.4 | ± | 0.4 | — | — | — | — | ||||||
| RvD4 | — | — | — | — | — | ||||||||
| RvD5 | — | — | — | — | — | ||||||||
| Maresin 1 | — | — | — | — | — | ||||||||
| Maresin 2 | — | — | — | — | — | ||||||||
| Maresin 2 isomer I | — | 14.3 | ± | 14.3 | 4.9 | ± | 4.3 | 1.7 | ± | 1.7 | .402 | ||
| Maresin 2 isomer II | 2.9 | ± | 1.6 | 9.0 | ± | 2.5 | 6.4 | ± | 4.5 | 4.0 | ± | 1.9 | .027 |
| PD1 | 6.2 | ± | 2.4 | 12.7 | ± | 4.0 | 5.5 | ± | 2.2 | 9.3 | ± | 3.2 | .307 |
| PDX | — | — | — | — | — | ||||||||
| 17-HDHA | 539.6 | ± | 319.0 | 842.7 | ± | 348.9 | 504.4 | ± | 285.7 | 467.6 | ± | 121.9 | .168 |
| 14-HDHA | 246.3 | ± | 66.8 | 402.6 | ± | 110.6 | 308.1 | ± | 62.5 | 551.7 | ± | 199.3 | .370 |
| AA | |||||||||||||
| PGE2 | 15.8 | ± | 4.2 | 43.7 | ± | 14.0 | 9.8 | ± | 3.9 | 29.2 | ± | 9.7 | .309 |
| PGD2 | 11.8 | ± | 2.7 | 24.6 | ± | 6.4 | 9.4 | ± | 2.5 | 13.3 | ± | 3.5 | .299 |
| PGF2a | 6.2 | ± | 2.0 | 13.0 | ± | 3.3 | 6.8 | ± | 2.4 | 9.6 | ± | 2.7 | .430 |
| TXB2 | 332.3 | ± | 75.7 | 625.3 | ± | 155.6 | 273.2 | ± | 76.8 | 439.0 | ± | 140.4 | .181 |
| LXA4 | — | — | — | — | — | ||||||||
| 15R-LXA4 | 2.7 | ± | 1.2 | 5.2 | ± | 1.9 | 2.4 | ± | 1.3 | 2.4 | ± | 1.4 | .178 |
| LXB4 | — | — | — | — | — | ||||||||
| LTB4 | .6 | ± | .5 | .4 | ± | .3 | — | .3 | ± | .3 | .831 | ||
| 20-OH-LTB4 | 1.3 | ± | .8 | — | .2 | ± | .2 | .2 | ± | .2 | .336 | ||
| 15-HETE | 74.9 | ± | 8.7 | 151.7 | ± | 20.6 | 70.4 | ± | 10.1 | 124.5 | ± | 18.4 | .402 |
| 12-HETE | 251.9 | ± | 46.8 | 407.4 | ± | 45.4 | 275.3 | ± | 60.0 | 387.3 | ± | 81.6 | .612 |
| 5-HETE | 51.8 | ± | 7.0 | 139.9 | ± | 19.2 | 38.5 | ± | 3.7 | 88.0 | ± | 11.5 | .002 |
| EPA | |||||||||||||
| LXA5 | — | — | — | — | — | ||||||||
| RvE1 | 7.5 | ± | 3.6 | 11.8 | ± | 4.8 | 12.0 | ± | 4.5 | 4.6 | ± | 2.7 | .148 |
| RvE2 | — | — | — | — | — | ||||||||
| RvE4 | — | — | — | 1.5 | ± | 1.5 | .336 | ||||||
| 18-HEPE | 113.8 | ± | 12.8 | 246.0 | ± | 45.9 | 108.8 | ± | 18.2 | 160.2 | ± | 21.7 | .062 |
| 12-HEPE | 28.1 | ± | 8.6 | 65.1 | ± | 19.6 | 36.2 | ± | 13.0 | 65.8 | ± | 23.8 | .716 |
| 5-HEPE | 19.2 | ± | 4.3 | 79.2 | ± | 25.6 | 16.4 | ± | 3.9 | 61.7 | ± | 20.0 | .580 |
Values are displayed as pg/mL plasma. Bold text indicates P < .05 by paired Student's t-test (before vs after mirabegron). Individual P values for Day 3 vs Day 29 “after mirabegron” are shown in the right column, with bold text indicating P < .05. n = 14.
Abbreviations: AA, arachidonic acid; COX, cyclooxygenase; DHA, docosahexaenoic acid; EPA, eicosapentaenoic acid; HDHA, hydroxydocosahexaenoic acid; HEPE, hydroxyeicosapentaenoic acid; HETE, hydroxyeicosatetraenoic acid; LOX, lipoxygenase; LT, leukotriene; LX, lipoxin; PD, protectin; PG, prostaglandin; Rv, resolvin.
We next investigated the relationships between 12-LOX products with physiological and biochemical parameters before and after chronic mirabegron treatment. A heatmap of Pearson's correlations was generated to illustrate the relationships between 12-LOX products post-mirabegron treatment and these outcomes on both day 3 and day 29. As noted above, our prior study with this cohort indicated that BAT activity, as determined by 18F-FDG uptake via PET/CT, was elevated (3). Although 12-LOX products were increased by mirabegron on Day 3 compared with premirabegron administration, there were no significant correlations between BAT activity or BAT volume with 12-LOX products postmirabegron treatment on days 3 or 29 within the “postmirabegron” groups (Fig. 2E). Because BAT activity and volume were only measured after mirabegron treatment, we were not able to assess correlations between 12-LOX products and acute BAT activation compared with baseline. Moreover, there were no significant correlations observed between 12-LOX products and BMI, lean mass, body fat percentage, or body weight. On Day 1 postmirabegron treatment, a positive correlation was found between 12-HEPE and fat-free mass, as well as with height (Fig. 2E). After 27 days of mirabegron treatment, these initial correlations were not observed. Of note, our prior study determined that these anthropometric parameters were not affected by mirabegron treatment (3). When considering plasma levels of lipid mediators both before and after acute mirabegron treatment on Day 3 or Day 29, we observed additional positive correlations between NEFA and 12-HETE, as well as MaR2 isomer II (Fig. 2F). Both products also inversely correlated with the RQ, which was previously observed to significantly decrease upon BAT activation with acute mirabegron treatment and is indicative of increased fatty acid oxidation (3). These results collectively suggest that activation of BAT by 2 distinct but physiologically overlapping approaches increases products of the 12-LOX pathway in females as we have previously observed in male subjects, but that these effects become blunted with chronic mirabegron treatment. The biosynthetic capacity of BAT for 12-LOX products is not directly correlated with anthropometric parameters but is positively correlated with elevated levels of NEFAs.
Products of the 5-LOX and 15-LOX Pathways Are Increased by BAT Activation
The 5-LOX and 15-LOX enzymes are involved in the conversion of PUFA into multiple bioactive lipid mediators including leukotrienes, lipoxins, resolvins, and protectins (9, 13, 29). Of note, monohydroxy products from EPA, DHA, and AA serve as pathway markers of these lipid mediators and are indicative of 5 and 15-LOX activity. Expanding the scope of this study, we further examined the effects of BAT activation on the 5-LOX and 15-LOX pathways. These pathways are illustrated in Fig. 3A. In plasma obtained from individuals before and after exposure to cold, we identified 5-HETE, 15-HETE, 17-HDHA, and protectin D1 (PD1) and found that their levels increase with cold exposure (Table 1). Mirabegron treatment also significantly elevated plasma levels of PD1, 17-HDHA, 5-HETE, and 15-HETE (Table 2). As with 12-LOX products, subgroup analysis demonstrated that most of these products were increased by mirabegron regardless of whether the subjects had prior cold exposure, except for 17-HDHA which was significantly reduced in subjects with prior cold exposure vs those that were not both before and after mirabegron (P = .003 and P = .04, respectively). Acute increases in levels of these mediators persisted after chronic mirabegron treatment, except for 17-HDHA (Table 2). No cumulative effect of chronic mirabegron treatment was observed, as revealed by statistical comparisons between Day 3 and Day 29 postmirabegron values (Table 2). Unlike cold exposure, mirabegron treatment acutely increased 5-HEPE at both Day 3 and Day 29.
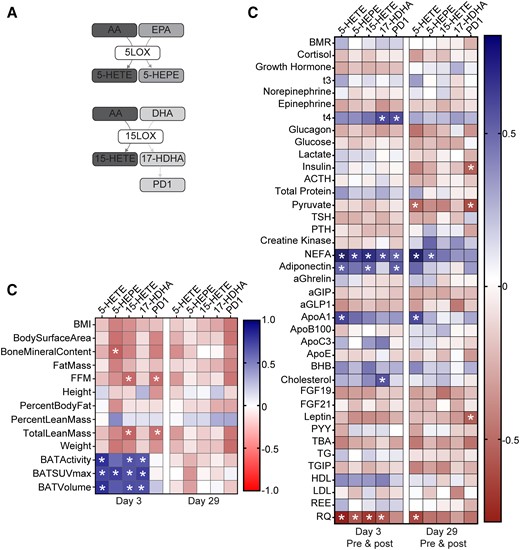
Correlation of 5-LOX and 15-LOX products with anthropometric parameters, BAT activity, and metabolic parameters in plasma of subjects treated with mirabegron. (A) Scheme depicting the biosynthesis pathways leading to formation of 5-LOX and 15-LOX products from AA, EPA, and DHA. (B) Heatmap illustrating Pearson's correlations between each 12-LOX product and indicated anthropometric parameters, BAT volume and activity, and metabolic parameters at Days 3 (n = 12-14) and 29 (n = 11-14) postmirabegron treatment. (C) Heatmap illustrating Pearson's correlations between each product and plasma metabolites at Day 3 (n = 12-14) or Day 29 (n = 11-14) (premirabegron and postmirabegron). BMI, body mass index; FFM, fat-free mass; BMR, basal metabolic rate; NEFA, nonesterified fatty acid; aGIP, glucose-dependent insulinotropic polypeptide; aGLP1, glucagon-like peptide 1; BHB, β-hydroxybutyrate; PYY, peptide YY; TG, triglyceride; TGIP, total glucose-dependent insulinotropic polypeptide; REE, resting energy expenditure; RQ, respiratory quotient. *P < .05.
On Day 3, after acute mirabegron treatment, significant positive correlations were observed between BAT-related parameters (activity, standardized uptake value; SUVmax and volume) and the products 5-HETE, 5-HEPE, 15-HETE, and 17-HDHA (Fig. 3B). These correlations were diminished after chronic mirabegron treatment. Like the 12-LOX products, many of the 5-LOX and 15-LOX products correlated positively with NEFA and inversely with the RQ (Fig. 3C). These correlations were largely reduced after chronic mirabegron treatment. Additional positive correlations were observed between insulin-sensitizing hormone adiponectin and PD1, 15-HETE, and 5-HETE (Fig. 3C). These results demonstrate that BAT activation increases levels of lipid mediators derived from additional LOX pathways that correlate with BAT activity and NEFA. Future studies will be required to understand whether they play causal roles in the physiological effects of BAT activation.
COX-Derived Prostaglandins Are Increased by BAT Activation
COX-derived prostaglandins play diverse roles in inflammation, vascular tone, pain, and thrombosis (12). Emerging evidence indicates that some prostaglandins, such as prostaglandin E2 (PGE2), also play a role in “browning” of WAT depots during obesity (17, 18, 30, 31). Thus, we further assessed the production of AA-derived prostaglandins and prothrombotic thromboxane (measured as its stable metabolite, TXB2) in subjects exposed to cold or mirabegron treatment (see biosynthetic scheme in Fig. 4A). As observed with the LOX products, acute cold exposure significantly increased levels of PGE2, PGD2, and TXB2 in the plasma (Table 1). In contrast, levels of PGF2α were not modulated by cold exposure, indicating selective downstream production of prostaglandins. When acetylated, COX-2 can also convert EPA to 18-HEPE, which is a pathway marker of the E-series resolvins (32). We identified EPA products, including 18-HEPE and resolvin E1 (RvE1) in plasma, although their levels did not change significantly upon cold exposure (Table 1).
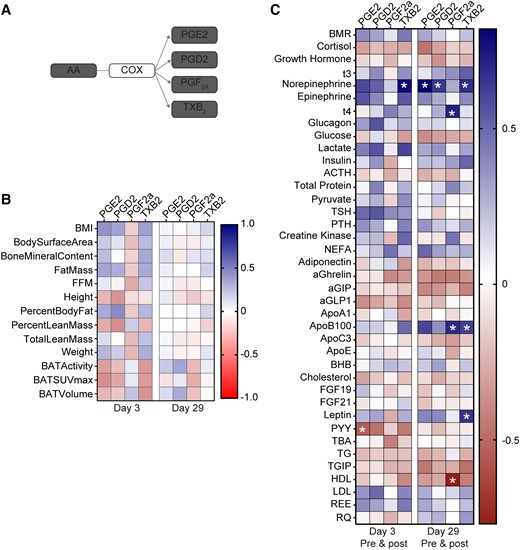
Correlation of COX products with anthropometric parameters, BAT activity, and metabolic parameters in plasma of subjects treated with mirabegron. (A) Scheme depicting biosynthesis pathways leading to formation of AA-derived prostaglandins and thromboxane A2 metabolite, thromboxane B2 (TXB2). (B) Heatmap illustrating Pearson's correlations between each COX product and indicated anthropometric parameters, BAT volume and activity, and metabolic parameters at Days 3 (n = 11-14) and 29 (n = 13-14) postmirabegron treatment. (C) Heatmap illustrating Pearson's correlations between each product and plasma metabolites at Day 3 (n = 11-14) or Day 29 (n = 13-14) (premirabegron and postmirabegron). BMI, body mass index; FFM, fat-free mass; BMR, basal metabolic rate; NEFA, non-esterified fatty acid; aGIP, glucose-dependent insulinotropic polypeptide; aGLP1, glucagon-like peptide 1; BHB, β-hydroxybutyrate; PYY, peptide YY; TG, triglyceride; TGIP, total glucose-dependent insulinotropic polypeptide; REE, resting energy expenditure; RQ, respiratory quotient. *P < .05.
Acute mirabegron treatment significantly increased levels of PGE2 at both Day 3 and 29 (Table 2). Although 18-HEPE was not increased by cold, its levels increased significantly after acute mirabegron treatment at both Day 3 and Day 29 (Table 2). There was no cumulative effect of mirabegron treatment on levels of 18-HEPE nor PGE2 when comparing postmirabegron groups at Days 3 and 29 (Table 2). Moreover, prior cold exposure did not affect the ability of mirabegron to modulate levels of these mediators (data not shown). Mirabegron treatment did not modulate levels of PGF2α or PGD2, while TXB2 was significantly increased after mirabegron treatment on Day 3. As with cold exposure, these results indicate selectivity in downstream production of prostanoids, which is dependent upon specific synthases that convert a common intermediate (ie, PGH2) into distinct mediators.
Unlike the 5-LOX and 15-LOX products, levels of prostaglandins did not correlate with anthropometric parameters or BAT activity or volume (Fig. 4B). However, levels of PGE2 and TXB2 did positively correlate with norepinephrine, which plays an important role in activation of thermogenesis in BAT (Fig. 4C). Also distinct from other LOX products observed in this study, levels of COX-derived prostaglandins did not correlate with NEFA, adiponectin or the RQ (Fig. 4C). Thus, despite several LOX and COX-derived lipid mediators increasing significantly with BAT activation, we observed several distinct correlations with downstream metabolic parameters that may give insight into their potential roles as endocrine mediators of BAT activation.
Discussion
Activation of BAT increases production of an array of mediators that act locally and systemically to regulate metabolism and inflammation (1). Building on our prior work in mice and healthy male subjects, in the present study we sought to determine in healthy women whether bioactive lipid mediators are increased by BAT activation both acutely and chronically. We found that acute BAT activation by either cold exposure or mirabegron treatment increased lipid mediators derived from COX and LOX pathways and that levels of individual mediators distinctly correlated with BAT activity, NEFA levels, the respiratory quotient, and select hormones including adiponectin. These mediators are the most likely to be human “batokines” given that they were elevated in a very distinct subset of conditions: the intersection of cold exposure and mirabegron and BAT activity. After chronic mirabegron treatment, some lipid mediators can still be acutely increased by mirabegron, while the production of others is impaired. Future studies will be required to determine whether this is due to blunted biosynthesis or increased downstream metabolism.
A primary objective of the current study was to further define the relationship between 12-LOX products and BAT activation. We previously found that BAT activation in mice by cold exposure significantly increases both mRNA and protein expression of 12-LOX in BAT, and that BAT-specific loss of Alox12 blunts the ability of cold to increase thermogenesis (4). This is due in part to production of 12-HEPE by brown adipocytes, a product generated from omega-3 PUFA EPA by 12-LOX (4). Administration of 12-HEPE improves glucose tolerance and glucose uptake in BAT and skeletal muscle in obese mice and directly facilitates glucose uptake by brown adipocytes (4). Levels of 12-HEPE correlate with BAT activity in males given mirabegron acutely and increase with cold exposure in humans (4, 6). In the present study, we found that 12-HEPE is increased in female subjects given mirabegron both acutely and chronically compared with baseline, and that acute cold exposure also increases 12-HEPE levels in plasma. Of note, we also observed an increase in omega-6 PUFA AA product 12-HETE with BAT activation by cold or mirabegron treatment and found that its levels correlate with NEFA. This is likely due to the increase in 12-LOX activity observed during BAT activation. Given that 12-HETE has been shown to have proinflammatory effects in obesity (33, 34), it will be important to determine whether dietary modulation (ie, a diet rich in omega-3 FA vs omega-6 FA) can impact the product profile of activated BAT.
In addition to EPA and AA, DHA also serves as a substrate for 12-LOX and gives rise to the maresins (26-28). Specifically, 12-LOX generates a 14-hydroperoxide intermediate that can be reduced to 14-HDHA (a maresin pathway marker) or undergo epoxidation to a 13S, 14S epoxide intermediate that is subsequently converted to either MaR1 or MaR2 (26-28). The latter was previously shown to be a product of enzymatic hydrolysis via soluble epoxide hydrolase (EPHX2), which is induced in BAT upon cold exposure (4, 8, 26). We previously found that 14-HDHA, MaR2, and related structural isomers of MaR2 are increased by cold exposure in mice, as well as in male subjects given mirabegron (8). In this context, levels of both MaR2 (isomer I) and 14-HDHA correlated with BAT activity. Here, we also identified that 14-HDHA is increased by BAT activation in female subjects both by cold and mirabegron treatment acutely, while its levels are blunted after chronic mirabegron treatment. The reasons for this are not clear but may be related to the fact that NEFA levels are also blunted with chronic mirabegron treatment (3). It is also possible that levels of 12-LOX or DHA levels are not maintained after chronic mirabegron treatment, but future studies will be required to investigate this possibility. It is notable that in addition to 14-HDHA, we also detected MaR2 isomer II in plasma of female subjects and found that its levels similarly increase with cold exposure and mirabegron treatment acutely. In our prior study with male subjects, we instead observed an increase in MaR2 isomer I. The reasons for this distinction between these 2 cohorts are not clear but may be related to differential metabolism in males vs females. The identity of the 2 related structural isomers of MaR2 is currently unknown. Although they have distinct retention times on HLPC compared with synthetic MaR2, they display similar MS/MS spectra and thus we hypothesize that they are stereoisomers of MaR2. Nonetheless, the levels of these isomers increase in tandem with 14-HDHA in both humans and mice and thus they are predicted to similarly arise from 12-LOX during BAT activation.
Products of the maresin pathway play important roles in promoting resolution of inflammation (9, 26-28). Indeed, both MaR1 and MaR2 resolve chronic inflammation associated with obesity in both the liver (MaR1, MaR2) and WAT (MaR1). For instance, MaR2 decreases expression of inflammatory genes (eg, Il1b) in the liver of mice with obesity, increases a population of TREM2+ macrophages that play protective roles in liver fibrosis, and decreases systemic levels of proinflammatory cytokine, tumor necrosis factor-α (8). Studies from multiple independent groups have established that treatment of obese mice with MaR1 improves systemic insulin sensitivity, reduces hepatic steatosis and WAT inflammation, and increases adiponectin (35-37). Although we did not identify MaR1 in plasma in the present study, other studies have found that MaR1 is generated in BAT, as well as the liver during obesity (19, 35, 38). Notably, MaR1 was recently found to directly regulate BAT thermogenesis in a manner dependent on its receptor, LGR6 (19). Thus, it is likely that during BAT activation, MaR1 is generated locally in metabolic tissues and contributes to the beneficial effects of 12-LOX. It is also possible that products of further downstream metabolism of MaR1 that were not monitored in our study (ie, 22-hydroxy-MaR1; 14-oxo-MaR1) precluded its identification in the plasma in this context (39).
In addition to the maresin pathway, we also observed an increase in levels of other proresolving lipid mediators and their pathway markers in plasma of individuals with BAT activation. One notable example is 17-HDHA, which is a marker of both the D-series resolvins and protectins that play well-documented roles in resolving inflammation associated with diseases including obesity and type 2 diabetes (10, 14, 29, 32). Both cold exposure and acute mirabegron treatment increased levels of 17-HDHA and PD1, while PD1 levels remained elevated after chronic mirabegron treatment. Levels of PD1 and 17-HDHA positively correlated with NEFA, while PD1 positively correlated with adiponectin. These results are consistent with a prior study which demonstrated that obesity impairs biosynthesis of 17-HDHA and PD1 that are restored with omega-3 PUFAs, leading to reduced WAT inflammation and increased adiponectin levels (40, 41). We also identified that BAT activation increased 18-HEPE, which is a biosynthetic pathway marker of the E-series resolvins. Importantly, omega-3 PUFA supplementation increases 18-HEPE, as well as 17-HDHA and 14-HDHA, in obese individuals (42). This is notable because resolvin E1 improves obesity-associated insulin sensitivity and adiponectin levels in mice (16, 41). Moreover, prior studies in humans and mice have demonstrated that resolvins are produced locally in adipose tissues (14, 43).
An important finding of the present study is the increase in plasma levels of PGE2 upon cold exposure and mirabegron treatment. The increase in PGE2 levels persisted after chronic mirabegron, which contrasts with many of the other lipid mediators identified. Several prior studies have implicated PGE2 in regulation of BAT function and have shown that it contributes to beige/brite adipose emergence within WAT depots (17, 18, 44, 45). Administration of a PGE2 analog increased expression of UCP1 in WAT (30). It is notable that the increase in PGE2 may be related to browning of WAT depots and previous studies have determined that this is dependent upon microsomal prostaglandin E synthase (18, 45). This may also explain the relative selectivity of increased PGE2 levels observed in our study as compared with other COX-derived prostaglandins (eg, PGF2α, PGD2) during mirabegron treatment. We found that PGE2 correlated with norepinephrine levels in plasma after chronic mirabegron treatment but was not significantly correlated with other anthropometric parameters or other plasma metabolites.
One unexpected finding from the current study is the increase in certain potential products of 5-LOX in the plasma of individuals with BAT activation. Particularly, 5-HETE and 5-HEPE are products generated by 5-LOX from AA and EPA, respectively, and both increased in subjects treated with mirabegron. Levels of 5-HETE and 5-HEPE strongly correlated with BAT volume and activity, along with other LOX products, and also positively correlated with NEFA. This was surprising because our prior studies have shown that 5-LOX expression does not increase in BAT of mice exposed to cold and that other 5-LOX products are not elevated with cold exposure in plasma (4, 8). Moreover, in a separate study of cold exposure in humans, levels of some 5-LOX products including 5-HETE decreased, although the exposure protocol used was distinct from our study (6). Thus, it is unclear whether 5-LOX activity in BAT or beige/brite fat is increased in these female subjects, or whether the 5-LOX products are increased because of leukocyte activation or whether they are produced indirectly in another tissue. Of note, we previously observed that both 5-HETE and 5-HEPE are elevated in BAT from long-lived Ames Dwarf mice that have elevated BAT activation and improved insulin sensitivity compared with their littermate controls, and that levels of 5-HEPE negatively correlate with BMI, Homeostatic Model Assessment for Insulin Resistance and TGs (46). While AA-derived 5-LOX products such as leukotriene B4 and 5-HETE are associated with obesity and inflammation, 5-LOX-dependent metabolism of omega-3 PUFAs gives rise to 5-HEPE and certain proresolving lipid mediators that play protective roles in obesity (14, 15, 46). Future studies will be required to determine the role of 5-LOX products in the systemic effects of BAT activation.
While the present results reveal clear relationships between BAT activation and lipid mediator levels, there are some limitations that are worth noting. First, subjects were matched to their own baseline and unlike our prior study with male subjects given mirabegron (4, 8), no placebo group was included. Second, although some lipid mediators correlated with BAT volume and activity, PET/CT was only carried out after mirabegron treatment and thus we were not able to assess correlations before and after BAT activation. Third, many of the lipid mediators targeted in our method are short-lived and subjected to downstream metabolism and thus future studies should assess lipid mediator metabolomes more comprehensively. Given that our study was limited to distinct time points, a more thorough time course of lipid mediator formation following BAT activation is also warranted. Although we identified clear relationships between lipid mediator levels and BAT activation, we cannot exclude other tissue sources as well. Indeed, some of the lipid mediators correlated with NEFA and thus it is possible that their production is linked to WAT. Lastly, the subjects included in the present study were healthy, relatively young, and insulin sensitive and thus we did not observe any significant relationships between lipid mediators and serum glucose or insulin. Although our prior study with chronic mirabegron treatment in these female subjects revealed an improvement in insulin sensitivity, this was evaluated in the context of a frequently sampled intravenous glucose tolerance test that was performed on different days and different conditions compared with the days when the lipid mediators were measured (3). However, baseline insulin and glucose were not changed in these subjects after chronic mirabegron treatment, so there was the potential for no relationship to be detected with the lipid mediators. We are now conducting similar studies in patients with insulin resistance to establish whether the ability of BAT activation to regulate levels of lipid mediators is altered in individuals with obesity or type 2 diabetes, and whether their levels correlate with insulin resistance.
In summary, the present study documents that acute activation of BAT in humans by 2 distinct methods significantly increases levels of lipid mediators in the plasma. These studies lend support to prior work in mouse models of obesity and BAT activation that uncovered distinct signaling roles of both LOX and COX-derived mediators in regulation of systemic metabolism, brown/beige adipose tissue function, and inflammation resolution. This suggests that some of these lipid mediators could selectively mimic certain aspects of BAT activation, which is an attractive therapeutic strategy. These mediators may also serve as useful biomarkers of BAT activation by a variety of stimuli and form the basis for future studies aimed at determining a detailed mechanistic understanding of their formation in BAT, as well as whether their levels are impacted by obesity, type 2 diabetes, or other cardiometabolic diseases.
Funding
This work was supported in part by grants from the Intramural Research Program of the National Institute of Diabetes and Digestive and Kidney Diseases (NIDDK), National Insititues of Health (NIH) (DK075116) and by DK122808 (to M.S. and Y.H.T.).
Author Contributions
A.M.C. oversaw all aspects of the clinical trial and sample collection. A.M.C., Y.H.T., and M.S. were responsible for the experimental design, oversaw the study, and interpreted results. M.E.W. extracted samples and analyzed LC-MS/MS data. M.E.W., S.D.K., and H.A.M. analyzed data, performed statistical analysis, interpreted results, and prepared figures and tables. M.E.W., A.M.C., and M.S. wrote the manuscript. All authors contributed to the editing of the manuscript.
Disclosures
The authors have declared that no conflict of interest exists.
Data Availability
Original data analyzed as part of the study are included in the article.
Clinical Trial Information
Clinicaltrials.gov NCT03049462 (registered February 10, 2017).
References
Abbreviations
- 18F-FDG
[18F]-2-fluoro-D-2-deoxy-D-glucose
- β-AR
β-adrenergic receptor
- AA
arachidonic acid
- ACTH
adrenocorticotropic hormone
- BAT
brown adipose tissue
- BMI
body mass index
- COX
cyclooxygenase
- DHA
docosahexaenoic acid
- EPA
eicosapentaenoic acid
- HEPE
hydroxyeicosapentaenoic acid
- HETE
hydroxyeicosatetraenoic acid
- HDHA
hydroxydocosahexaenoic acid
- HDL
high-density lipoprotein
- LC-MS/MS
liquid chromatography tandem mass spectrometry
- LDL
low-density lipoprotein
- LOX
lipoxygenase
- MaR2
maresin 2
- NEFA
nonesterified fatty acid
- PD1
protectin D1
- PET/CT
positron emission tomography/computed tomography
- PGE2
prostaglandin E2
- PTH
parathyroid hormone
- PUFA
polyunsaturated fatty acid
- REE
resting energy expenditure
- RQ
respiratory quotient
- RT
retention time
- TSH
thyroid-stimulating hormone
- WAT
white adipose tissue
Author notes
Matthew Spite and Aaron M. Cypess share senior authorship.
