


Abstract
Current metabolomics studies in diabetes have focused on the fasting state, while only a few have addressed the satiated state.
We combined the oral glucose tolerance test (OGTT) and metabolomics to examine metabolite-level changes in populations with different glucose tolerance statuses and to evaluate the potential risk of these changes for diabetes.
We grouped participants into those with normal glucose tolerance (NGT), impaired glucose regulation (IGR), and newly diagnosed type 2 diabetes (NDM). During the OGTT, serum was collected at 0, 30, 60, 120, and 180 minutes. We evaluated the changes in metabolite levels during the OGTT and compared metabolic profiles among the 3 groups. The relationship between metabolite levels during the OGTT and risk of diabetes and prediabetes was analyzed using a generalized estimating equation (GEE). The regression results were adjusted for sex, body mass index, fasting insulin levels, heart rate, smoking status, and blood pressure.
Glucose intake altered metabolic profile and induced an increase in glycolytic intermediates and a decrease in amino acids, glycerol, ketone bodies, and triglycerides. Isoleucine levels differed between the NGT and NDM groups and between the NGT and IGR groups. Changes in sarcosine levels during the OGTT in the diabetes groups were opposite to those in glycine levels. GEE analysis revealed that during OGTT, isoleucine, sarcosine, and acetic acid levels were associated with NDM risks, and isoleucine and acetate levels with IGR risks.
Metabolic profiles differ after glucose induction in individuals with different glucose tolerance statuses. Changes in metabolite levels during OGTT are potential risk factors for diabetes development.
According to a recent study, approximately 537 million adults (aged 20-79 years) worldwide had diabetes in 2021; this number is expected to grow to 643 million by 2030 and 783 million by 2045 (1). More than 90% of all types of diabetes cases are type 2 diabetes mellitus (T2DM), for which the incidence is rapidly increasing worldwide (2). T2DM is an endocrine disorder characterized by the body's inability to respond to insulin, which increases the risk of many complications and unwanted outcomes, including renal failure, retinopathy, leg amputation, cardiovascular disease, and stroke (3). Metabolomics is a novel research method that plays an important part in diabetes research and has made notable progress. For instance, it has facilitated the discovery of numerous biomarkers associated with T2DM in the fasting state, such as higher levels of fasting proline, tyrosine, lysine, glutamate, and branched-chain amino acid (BCAAs) (4). These biomarkers can potentially predict the future development of T2DM.
The most common method for assessing insulin resistance and diagnosing diabetes is the oral glucose tolerance test (OGTT) (5), which examines the body's ability to clear circulating glucose after the ingestion of glucose following a period of fasting. The OGTT induces a fasting-to-feeding transition, followed by an adjustment of the body to achieve glucose homeostasis and subsequent changes in various circulating metabolites; accordingly, it can be speculated that insulin-impaired individuals may exhibit a wide range of systemic abnormalities in addition to glucose abnormalities (6, 7). Although changes in insulin and glucose levels during the OGTT have been studied in healthy individuals and diabetic patients, little is known about other metabolic biomarkers such as amino acids, lipoprotein lipid profiles, and ketone bodies (6). Previous studies have combined metabolomics with OGTT; however, most of them were limited to an OGTT of 120 minutes, with less comprehensive studies comparing healthy individuals and those with prediabetes and diabetes (6, 8-12).
In this study, metabolite levels were measured and analyzed at 5 time points during the OGTT in 3 distinct groups: individuals with normal glucose tolerance (NGT, healthy), those with impaired glucose regulation (IGR, prediabetes), and individuals with newly diagnosed T2DM (NDM), to determine the characteristics and differences among the 3 different groups, thus exploring the metabolic abnormalities of the complex disease of diabetes.
Materials and Methods
Study Population
Individuals with a normal medical examination and those who visited the Tianjin Medical University General Hospital for the first time and underwent OGTT were selected to undergo OGTT as required after the appointment. The criteria for inclusion in the T2DM and IGR groups were as follows: (1) patients who had been initially diagnosed with T2DM, impaired fasting glucose (IFG), or impaired glucose tolerance (IGT); (2) aged 18 years or older; and (3) diagnostic criteria based on the World Health Organization 1999 diagnostic criteria. The criteria for defining the 3 glucose tolerance statuses were as follows: (1) IFG: 6.1 mmol/L less than fasting glucose less than 7.0 mmol/L and 2-hour post glucose less than 7.8 mmol/L; (2) IGT: fasting glucose less than 7.0 mmol/L and 7.8 mmol/L less than 2-hour post glucose; and (3) diabetes mellitus: fasting glucose greater than 7.0 mmol/L or 2-hour post glucose greater than 11.11 mmol/L. The control group consisted of individuals with NGT who met the following criteria: (1) absence of specific diseases and malignancies, renal failure, heart disease, thyroid disease, and other inflammatory diseases; (2) NGT: fasting blood glucose less than 6.1 mmol/L and 2-hour postglucose load blood glucose less than 7.8 mmol/L; and (3) no significant abnormalities in blood, urine routine, and biochemical examinations. The exclusion criteria were as follows: (1) previously diagnosed diabetes mellitus, acute and chronic infectious diseases, or a history of severe liver or kidney disease; or (2) pregnancy or lactation. The sample size for final inclusion in the discovery set was 30 participants with NGT, 40 with IGR (including individuals with IFG and IGT), and 43 with NDM. The sample size for the validation set included 20 individuals with NGT, 30 with IGR, and 18 with NDM. All study participants provided informed consent. This study was approved by the ethics committee of Tianjin Medical University General Hospital.
Blood Sample Collection and Storage
Participants fasted overnight (at least 8 hours) before undergoing the OGTT as required by the Chinese Guidelines for the Prevention and Treatment of Type 2 Diabetes (2020 Edition). The following procedures were followed for the OGTT. (1) Starting at 7 to 9 Am, participants orally consumed 75 g of anhydrous glucose powder dissolved in 300 mL of water within 5 minutes. (2) Blood was collected from the forearm prior to and within 3 hours of sugar ingestion. (3) Participants refrained from tea or coffee consumption, smoking, or strenuous exercise during the test period. (4) Blood samples were sent for testing as soon as possible. (5) Daily carbohydrate intake was at least 150 g for 3 days prior to the test. (6) Medications that may affect the OGTT, such as birth control pills, diuretics, or phenytoin sodium, were discontinued 3 to 7 days prior to the test. (7) Blood from the participants was collected in tubes at 0, 30, 60, 120, and 180 minutes, and the supernatant was then collected after centrifugation at 1300g for 12 minutes. Subsequently, the serum samples were stored in a −80 °C freezer for examination.
Metabolomic Analysis
Serum samples were preprocessed and analyzed according to Bruker Standard Operating Procedures for In Vitro Diagnostic Studies (IVDr SOP) at Protein Biotechnology Ltd (13). Frozen serum samples (400 μL) were thawed at room temperature and mixed with an equal volume of buffer (0.075 mM sodium phosphate solution, 6 mM NaN3, 4.6 mM 3-(trimethylsilyl)-2,2,3,3-tetrahydrodeuteriopropionic acid [TSP-d4], pH 7.4). The serum-buffer mixture was transferred into a 5-mm nuclear magnetic resonance (NMR) tube. Serum samples were analyzed using an Avance III HD Ultrashield Plus 600-MHz spectrometer equipped with a 5-mm TCI probe and sampler (Bruker Biospin) for automatic sampling.
In this study, 112 lipoprotein subgroups and 39 small-molecule metabolites were examined. Lipids included serum lipoprotein particle numbers, total cholesterol, triglycerides (TGs), cholesterol, free cholesterol (FC), phospholipids, apolipoprotein A1, apolipoprotein A2, apolipoprotein B, very low-density lipoprotein (VLDL), low-density lipoprotein (LDL), intermediate-density lipoprotein (IDL), and high-density lipoprotein (HDL) classes. In addition, lipoprotein classes were further divided into the following subfractions based to their density: VLDL into VLDL 1 to 6, LDL into LDL 1 to 6, and HDL into HDL 1 to 4. Small-molecule metabolites included glucose, creatinine, ethanol, trimethylamine N-oxide (TMAO), alanine, creatine, glutamate, glutamine, glycine, histidine, isoleucine, leucine, phenylalanine, tyrosine, valine phenylalanine, tyrosine, valine, acetic acid, formic acid, lactic acid, citric acid, 3-hydroxybutyric acid, acetone, pyruvic acid, glycerol, 2-aminobutyric acid, asparagine, lysine, methionine, N,N-dimethylglycine, ornithine, proline, threonine, 2-hydroxybutyric acid, succinic acid, choline, 2-oxoglutaric acid, D-galactose, and dimethyl sulfone.
Data Analysis
Prior to the analysis, metabolites with deletion rates greater than 50% were excluded, and 141 metabolites were finally included in the analysis phase.
Partial least squares discriminant analysis (PLS-DA) was used to identify the metabolic characteristics of participants with NGT, IGR, and NDM at different time points during the OGTT. The analysis was performed using SIMCA-P 14.1.
The metabolic trajectories of different metabolites were analyzed to study the response to the OGTT in the 3 different groups. The percentage change in concentration of metabolites at different time points (30, 60, 120, and 180 minutes) relative to the 0-minute concentration were used as metabolic trajectories using the formula: (concentration 120 minutes − concentration 0 minutes)/concentration 0 minutes × 100%). In this equation, the metabolite concentration results are provided in the original units, for example, mmol/L. Owing to the correlation between metabolic measurements, the significance of within-group changes was assessed using the Wilcoxon rank test, comparing metabolite concentrations at the post-load time point with those at the fasting baseline. The metabolic trajectories were compared between groups using the Mann-Whitney U test. The false discovery rate procedure was used to account for multiple tests.
The generalized estimating equation (GEE) was used to explore the relationship between different metabolite levels and risks of IGR and NDM. We used group classification as the response variable and metabolite levels during OGTT as independent variables. Five models were used: (1) unadjusted model, (2) model adjusted for sex, (3) model adjusted for sex and body mass index (BMI), (4) model adjusted for sex and fasting insulin, and (5) model adjusted for heart rate, smoking status, and blood pressure. The results of the GEE analysis are reported as odds ratios (OR) and 95% CI. For statistical analysis, SPSS 26.0 (IBM Corp) was used, and P less than .05 was considered statistically significant. Images were created using GraphPad Prism version 9 (GraphPad Software Inc; 2012).
Results
Characteristics of the Study Population
The clinical characteristics of the 113 individuals in the discovery group, including 30 patients with NGT, 40 with IGR, and 43 with NDM, are shown in Table 1. Individuals with NDM were older. There were more men among the NDM and IGR individuals than among NGT individuals, which is consistent with previous studies (14, 15) and indicates a higher incidence of diabetes in men than in women. The IGR individuals had a higher BMI than those with other glucose tolerance states, which was consistent with previous reports (16). During the OGTT, blood glucose levels were higher in the NDM and IGR individuals than in the NGT individuals at all time points (Fig. 1). Insulin levels at fasting and 120 minutes were higher in the IGR individuals than in those with other glucose tolerance states; however, the difference was not statistically significant at fasting levels. Insulin levels in the NGT individuals were increased and peaked earlier than those in the IGR and NDM individuals during OGTT. Furthermore, insulin levels were lower in the NDM individuals than in the NGT and IGR individuals during OGTT, reflecting impaired insulin secretion in individuals with diabetes.
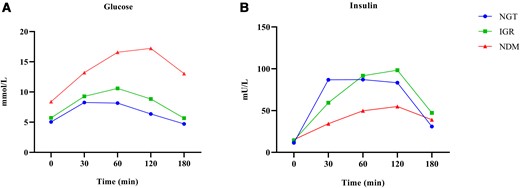
Mean glucose and insulin levels at 0, 30, 60, 120, and 180 minutes during an oral glucose tolerance test. Trajectories of glucose and insulin for normal glucose tolerance (NGT, circle, n = 30), impaired glucose regulation (IGR, squares, n = 40), and newly diagnosed type 2 diabetes (NDM, triangles, n = 43) are shown.
Characteristics of the study population
| NGT | IGR | NDM | P | |
|---|---|---|---|---|
| No. | 30 | 40 | 43 | — |
| Age, y | 35.5 (28-44.0)c | 39 (32.3-51.3) c | 52 (43.0-65.0)a,b | <.001 |
| Men, % | 6.7 | 27.5 | 44.2 | — |
| BMI | 25.8 (21.6-28.1)b | 27.9 (24.8-32.4)a,c | 26.6 (24.2-28.4)b | .02 |
| Fasting glucose, mmol/L | 5.1 (4.7-5.4)b,c | 5.7 (5.2-6.3)a,c | 7.9 (7.5-8.8)a,b | <.001 |
| 2-h glucose, mmol/L | 6.5 (5.6-7.3)b,c | 8.9 (8.3-9.9)a,c | 17.2 (14.8-19.0)a,b | <.001 |
| Fasting insulin, mU/L | 10.4 (6.3-19.9) | 14.8 (11.6-19.0) | 14 (7.5-18.3) | .376 |
| 2-h insulin, mU/L | 77.8 (41.6-135.0)c | 113.4 (69.1-176.3)c | 66 (28.0-92.2)a,b | .003 |
| HOMA-IR | 2.4 (1.5-4.5)b,c | 3.8 (3.0-5.1)a | 4.9 (2.8-6.4)a | <.001 |
HOMA-IR, fasting glucose level (mmol/L) × fasting insulin level (mIU/L)/22.5. Values are presented as median (interquartile range).
Abbreviations: BMI, body mass index; HOMA-IR, homeostasis model assessment of insulin resistance; IGR, individuals with impaired glucose tolerance regulation; NDM, individuals with newly diagnosed type 2 diabetes; NGT, individuals with normal glucose tolerance.
Compared to NGT, aP less than .05; compared to IGR, bP less than .05; and compared to the NDM, cP less than .05.
Different Responses of Metabolites During the Oral Glucose Tolerance Test
The PLS-DA score map was used to distinguish metabolomic patterns in different groups (NGT, IGR, and NDM) during the OGTT (Fig. 2). There was a more pronounced categorization between the samples at each time point. In all 3 groups, baseline levels were significantly distinguishable from those at other time points, indicating systematic changes in metabolite levels during the OGTT. However, at 120 and 180 minutes, the metabolites were not significantly separated in the PLS-DA plots in all 3 groups, suggesting a decline in the metabolite levels by 120 minutes.
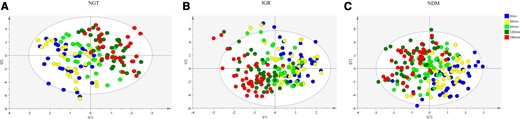
Partial least squares discriminant analysis score plots of metabolites during oral glucose tolerance test (n = 113). A, Normal glucose tolerance (NGT, n = 30); B, impaired glucose regulation (IGR, n = 40); and C, newly diagnosed type 2 diabetes mellitus (NDM, n = 43).
Metabolic Trajectories of Different Groups
Fig. 3 summarizes the partial response of all individuals to OGTT, that is, the false discovery rate–adjusted P less than .05, for changes in metabolite levels at any time point. The results for all metabolites are shown in Supplementary Fig. S1 and Supplementary Tables S1, S2, and S3 (17). During the OGTT, lipid levels decreased in all groups, with the decrease reaching a minimum at 120 minutes and rebounding at 180 minutes but not returning to baseline levels. In the NGT and NDM groups, within-individual changes in lipid levels were similar (see Fig. 3A and 3C and Supplementary Tables S1 and S3 (17)). Changes in nonlipid indicators were generally more variable than those in the lipids. During the OGTT, creatine levels continued to rise in individuals in the NGT group, peaking at 120 minutes (37% higher than baseline). Conversely, acetic acid levels continued to decline, reaching a minimum at 180 minutes (50% lower than that at 0 minutes). This may be due to decreased fatty acid utilization caused by glucose intake. The levels of 3-hydroxybutyric acid, one of the products of fatty acid metabolism, continued to decline during the OGTT. The changes observed in creatine levels were similar among the NGT and NDM individuals. Glycine levels decreased during the OGTT in the NDM individuals. TMAO levels in the NDM individuals were increased during the OGTT, peaking at 120 minutes (116% higher than at 0 minutes). Notably, glycerol levels were decreased by 53, 39, and 60% at 120 minutes throughout the OGTT in the NGT, IGR, and NDM individuals, respectively (see Fig. 3). All results were confirmed in the validation group, except for the IGR individuals, in whom the number of metabolites with differences was too small to be verified (Supplementary Fig. S2A (17)).
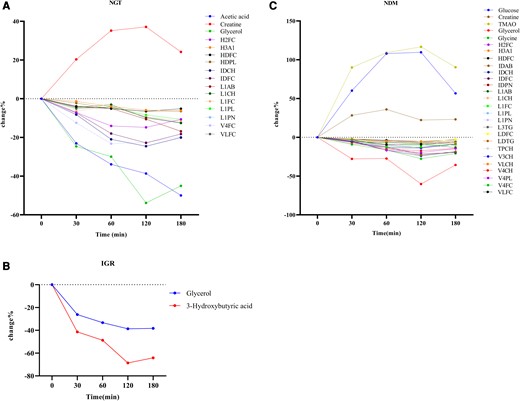
Changes in levels of selected metabolites in glucose-tolerant participants during an oral glucose tolerance test. Dots indicate the median percentage change. The percentage change is the absolute change relative to the fasting state. A, Normal glucose tolerance (NGT); B, impaired glucose regulation (IGR); and C, newly diagnosed type 2 diabetes mellitus (NDM). P less than .05 after false discovery rate adjustment.
Comparison of Metabolic Trajectories Between Different Groups
The metabolic trajectory of NDM individuals was compared to those of NGT individuals (Fig. 4). This analysis was performed to screen for differences in the metabolic trajectories of NDM individuals compared with those of NGT individuals during OGTT. The complete results are available in Supplementary Table S4 (17). Significant differences were observed in several metabolic pathways, including BCAAs (Fig. 4C), short-chain fatty acids (Fig. 4D), amino acids (Fig. 4E), microbial products (Fig. 4F), and TG-related metabolites (Fig. 4G). Typical differences were observed after 60 minutes (except for insulin and glucose). Additionally, individuals with NDM showed a higher rise in glucose levels at 60 minutes; however, they remained high at 120 minutes. At 180 minutes, glucose levels in NGT individuals had decreased to baseline, whereas NDM individuals showed a decrease in glucose levels but had not yet returned to baseline levels. In addition, isoleucine, acetic acid and HDL-4 TG levels exhibited a lower decrease in NGT and NDM individuals (see Fig. 4C, 4D and 4G). In NDM individuals, sarcosine peaked at 120 minutes (69%), whereas in NGT individuals, it was 11% lower at 120 minutes than at 0 minutes. TMAO remained at high levels at 180 minutes., which may be due to altered gut microbiology in the diabetic population (18).
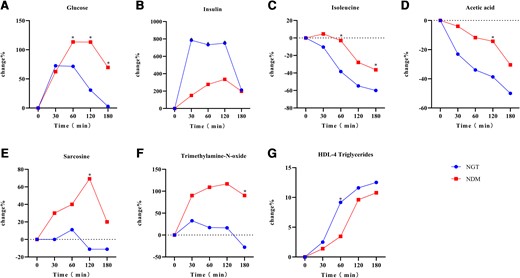
Comparison of metabolic trajectories between normal glucose tolerance (NGT, n = 30) and newly diagnosed type 2 diabetes (NDM, n = 43) individuals. Dots indicate median percentage change. A, Glucose; B, insulin; C, isoleucine; D, acetic acid; E, sarcosine; F, trimethylamine N-oxide; and G, HDL-4 triglycerides. *False discovery rate–adjusted P less than .05 indicates the statistical significance of the percentage change in metabolomics of NGT and NDM individuals at the corresponding time points.
To better determine metabolite changes in prediabetes, we compared the trajectory of metabolite changes during the OGTT in NGT and IGR individuals (Fig. 5; Supplementary Table S5 (17)). Blood glucose levels at 0 minutes were not different between IGR and NGT individuals, which is likely due to the prevalence of IGT rather than IFG among the patients. Moreover, the IGR group displayed significantly higher glucose levels at 120 minutes than the NGT group at baseline (Fig. 5A). IGR individuals had a slower increase in insulin levels than NGT individuals (Fig. 5B), indicating reduced insulin sensitivity. Additionally, IGR individuals exhibited a smaller decrease in isoleucine levels (Fig. 5C). The trajectory of acetic acid was similar between IGR and NGT individuals but significantly differed at 60 minutes and 120 minutes (NGT: 60 minutes, −34%, 120 minutes, −39%; IGR: 60 minutes, −14%, 120 minutes, −15%). Methionine, an essential amino acid, exhibited opposite metabolic trajectories in IGR and NGT individuals. The change in methionine level at 120 minutes (Fig. 5E) was 20% higher than that at 0 minutes in the NGT individuals and 7% lower in IGR individuals. N,N-dimethylglycine in IGR individuals significantly differed from that in NGT individuals at 120 minutes.
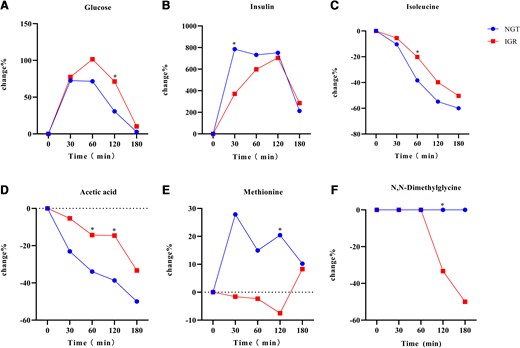
Comparison of metabolic trajectories between the normal glucose tolerance (NGT, n = 30) and impaired glucose regulation (IGR, n = 40) groups. Dots indicate mean percentage change. A, Glucose; B, insulin; C, isoleucine; D, acetic acid; E, methionine; F, N, N-dimethylglycine. *False discovery rate–adjusted P less than .05 indicates the statistical significance of percentage change in metabolomics of NGT and IGR individuals at corresponding time points.
We also compared metabolite changes during OGTT in individuals with IGR and NDM (Fig. 6). The results are presented in Supplementary Table S6 (17). NDM individuals showed a later decrease in glucose levels than IGR individuals and a further decrease in insulin sensitivity (Fig. 6A and 6B). Although glucose levels were elevated in NDM individuals, the levels of lactate, a product associated with the glycolytic pathway, were reduced (Fig. 6C). Alanine levels were slightly decreased at 180 minutes in NDM individuals; however, it differed from that in IGR individuals. The decrease in valine levels was similar in both groups (Fig. 6E). The metabolic trajectories of sarcosine and methionine exhibited opposite patterns in IGR and NDM individuals (Fig. 6F and 6G). Glycerol levels differed between the two groups at 120 minutes (IGR, 38% lower than baseline; NDM, 60% lower than baseline). VLDL-5 FC was decreased continuously in individuals with NDM but increased and then decreased in individuals with IGR (Fig. 6I). All metabolites except TMAO were validated in the validation group (Supplementary Fig. S2B (17)).
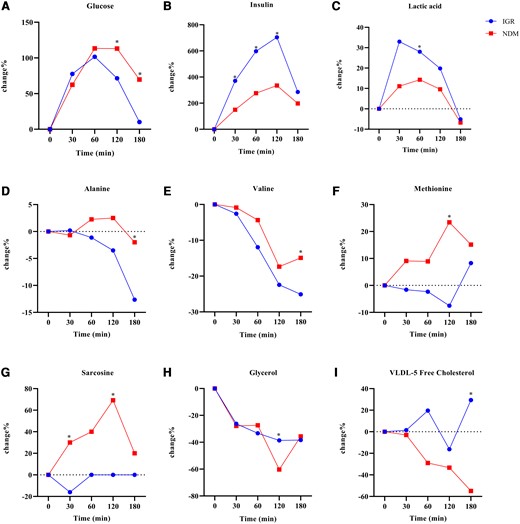
Comparison of metabolic trajectories between the impaired glucose regulation (IGR, n = 40) and newly diagnosed type 2 diabetes mellitus (NDM, n = 43) groups. Dots indicate mean percentage change. A, Glucose; B, insulin; C, lactate; D, alanine; E, valine; F, methionine; G, sarcosine; H, glycerol; I, VLDL-5-free cholesterol. *False discovery rate–adjusted P less than .05 comparing the percentage metabolomic changes between IGR and NDM individuals at the corresponding time points.
Odds Ratio of Metabolite Levels During Oral Glucose Tolerance Test for Newly Diagnosed Type 2 Diabetes and Impaired Glucose Regulation
The analysis of the risk of metabolite levels during the OGTT in NDM and IGR individuals was performed using GEE. However, since TMAO was not validated in the validation cohort, it was not analyzed using GEE. In the initial model, the levels of isoleucine, acetic acid, and sarcosine during OGTT of NDM individuals were significant (Table 2). Additionally, the levels of isoleucine and acetic acid during the OGTT were significantly associated with the risk of IGR (Table 3).
Odds ratios of metabolite levels to newly diagnosed type 2 diabetes during oral glucose tolerance test
| Model 1 | Model 2 | Model 3 | Model 4 | Model 5 | ||||||
|---|---|---|---|---|---|---|---|---|---|---|
| β (95% CI) | P | β (95% CI) | P | β (95% CI) | P | β (95% CI) | P | β (95% CI) | P | |
| H4TG | 1.513 (0.897-2.550) | .120 | 1.65 (0.956-2.847) | .072 | 1.688 (0.956-2.979) | .071 | 1.658 (0.946-2.905) | .077 | 1.526 (0.892-2.612) | .123 |
| Isoleucine | 1.034 (1.017-1.052) | <.001 | 1.031 (1.014-1.048) | <.001 | 1.037 (1.017-1.056) | <.001 | 1.026 (1.010-1.043) | .002 | 1.033 (1.015-1.050) | <.001 |
| Acetic acid | 1.032 (1.000-1.065) | .049 | 1.028 (0.993-1.065) | .115 | 1.015 (0.978-1.054) | .420 | 1.034 (0.998- 1.071) | .063 | 1.034 (1.002-1.066) | .036 |
| Sarcosine | 1.109 (1.013-1.214) | .025 | 1.112 (1.006-1.228) | .037 | 1.117 (1.007-1.239) | .036 | 1.110 (1.004-1.228) | .042 | 1.108 (1.008-1.218) | .033 |
Model 1: unadjusted model; model 2: adjusted for sex; model 3: adjusted for sex and body mass index; model 4: adjusted for sex and fasting insulin; model 5: adjusted for heart rate, smoking status, and blood pressure.
Odds ratios of metabolite levels to impaired glucose tolerance regulation during oral glucose tolerance test
| Model 1 | Model 2 | Model 3 | Model 4 | Model 5 | ||||||
|---|---|---|---|---|---|---|---|---|---|---|
| β (95% CI) | P | β (95% CI) | P | β (95% CI) | P | β (95% CI) | P | β (95% CI) | P | |
| Isoleucine | 1.033 (1.014-1.051) | <.001 | 1.030 (1.012-1.049) | .001 | 1.029 (1.01-1.048) | .003 | 1.029 (1.011-1.047) | .001 | 1.031 (1.013- 1.049) | .001 |
| Acetic acid | 1.060 (1.025-1.096) | <.001 | 1.064 (1.03-1.099) | <.001 | 1.065 (1.031-1.101) | <.001 | 1.066 (1.032-1.101) | <.001 | 1.065 (1.030-1.100) | <.001 |
| Methionine | 1.003 (0.983-1.024) | .746 | 1.009 (0.986-1.032) | .438 | 1.009 (0.987-1.032) | .429 | 1.010 (0.987-1.034) | .400 | 1.006 (0.985-1.028) | .574 |
| N,N-Dimethylglycine | 0.987 (0.647-1.507) | .952 | 0.921 (0.614-1.383) | .692 | 0.928 (0.621-1.387) | .717 | 0.920 (0.612-1.384) | .689 | 0.999 (0.646-1.543) | .995 |
Model 1: unadjusted model; model 2: adjusted for sex; model 3: adjusted for sex and body mass index; model 4: adjusted for sex and fasting insulin; model 5: adjusted for heart rate, smoking status, and blood pressure.
Adjustments for sex, BMI, fasting insulin, smoking status, heart rate, and blood pressure were made in the GEE results. After adjusting for sex, the significance of the levels of acetic acid during the OGTT in NDM individuals disappeared in the comparison between NDM and NGT individuals (Table 2). The metabolic differences associated with IGR and NGT individuals remained unchanged or slightly diminished after adjusting for other factors (Table 3).
Discussion
In this study, serum samples from 43 individuals with NDM, 40 with IGR, and 30 with NGT at 5 time points during the OGTT were collected and analyzed using metabolomics. The changes observed included changes in glycolysis-related metabolites, TG-related metabolites, and amino acids. We found that the pattern of changes in metabolite levels differed among the 3 groups after oral glucose intake, with a delayed and blunted decrease in NDM and IGR individuals, consistent with previous studies (6).
Unexpectedly, although fasting insulin was higher in NDM and IGR individuals than in NGT individuals, there was no significant difference. Previous studies have confirmed that high fasting insulin is a predictor of diabetes (19). This discrepancy can be attributed to the variability within our small data set. The PLS-DA score plots showed that glucose intake influenced metabolite changes in the body. Metabolite levels were altered during the OGTT, particularly at baseline, 120 minutes, and beyond the 120-minute mark, demonstrating that systematic changes in metabolites occurred during the OGTT.
Changes in metabolite levels during the OGTT are consistent with previous findings and support known actions of insulin to promote glucose metabolism (via pyruvate and lactate synthesis) and inhibit protein catabolism (amino acids synthesis), ketone body production (ketone bodies), and lipolysis (glycerol) (10, 20). In addition, we studied the metabolic changes after glucose intake in NGT, IGR, and NDM individuals. In all 3 groups, the concentrations of metabolites related to glycolysis peaked at 120 minutes and decreased at 180 minutes but did not return to their initial levels. The levels of ketone bodies, amino acids, and TGs continued to decrease during the OGTT. Glycerol levels showed significant changes in all 3 groups, reflecting a decrease in lipolysis due to increased insulin levels following glucose intake (21). In addition, glycerol level decreased less in IGR individuals (38%) than in NGT individuals (53%) over 120 minutes owing to reduced lipolysis in the insulin-resistant state (21). However, glycerol reduction at 120 minutes in the NDM group was 60%, which may have been attributed to the variability within our smaller data set.
In the comparison of metabolic trajectories between different groups, differences in isoleucine and acetate acid levels were found between NGT and IGR individuals and between NGT and NDM individuals. In the comparison between IGR and NDM individuals, there was a difference in valine levels. Fasting metabolomics studies (22, 23) have identified increased levels of BCAAs and decreased concentrations of acetic acid in diabetic individuals. In addition, we found greater changes in TMAO in NDM individuals than in NGT individuals. Short-chain fatty acids, BCAAs, and TMAO are involved in the metabolism of gut microorganisms (24). The differences between NGT and NDM individuals may reflect disrupted microbial homeostasis in patients with diabetes. When comparing IGR and NGT individuals, methionine levels were changed in opposite trajectories. Moreover, the metabolic trajectories of methionine and sarcosine exhibited completely opposite patterns in the comparison of metabolic trajectories between IGR and NDM individuals. During the OGTT, sarcosine and methionine levels in the NDM group increased and subsequently decreased. In previous studies, most amino acids levels decreased during the OGTT; however, some studies have confirmed that methionine levels increase after a meal, whereas fewer studies have been conducted on sarcosine (25). Both methionine and sarcosine are involved in the glycine utilization pathway. Methionine is transformed into S-adenosylmethionine by L-methionine S-adenosyltransferase, after which glycine N-methyltransferase catalyzes the transfer of methyl groups from S-adenosylmethionine to glycine to form sarcosine (26). Glycine levels are reduced in insulin-resistant patients; however, sarcosine levels, an intermediate in glycine biosynthesis and degradation, are elevated, possibly because of changes in the urinary excretion of this metabolite (27). In addition, glycine metabolism is related to BCAA metabolism. Glycine acts as a donor to the pyruvate/alanine cycle through the regulation of BCAAs. Therefore, in populations with obesity and diabetes, increased levels of BCAAs also lead to decreased glycine (28). In the present study, metabolites with differential metabolic trajectories in the comparison of the 3 different status groups during the OGTT were also associated with biomarkers identified in previous studies in the fasting state.
GEE was used to investigate the differences in the levels of metabolites during OGTT among NDM, IGR, and NGT individuals. This study is the first to use GEE for analyzing the levels of metabolite during the OGTT in relation to NDM or IGR. Not all metabolites were associated with the risk of diabetes, such as H4TG. Acetic acid, sarcosine, and isoleucine were all significant in association with the risk of diabetes. However, after adjusting for sex, acetic acid was no longer significant. The correlation of sarcosine and isoleucine with the risk of NDM was more stable and independent of other factors. Adjustment for sex attenuated the correlations for all metabolites. This attenuation suggests that sex partially explains the risk of metabolite levels in NDM. Previous studies have found sex to be associated with metabolic profiles (29). Significant differences in isoleucine and acetic acid levels were consistently observed between NGT and IGR individuals. In the results of the GEE study, the levels of isoleucine and acetic acid during the OGTT were significantly correlated with IGR and NDM. The reasons for its significant changes during the OGTT in diabetic and normal individuals should be investigated subsequently.
Our study provides new evidence regarding the development of diabetes and its prodromal stages. Notably, sarcosine, the metabolite of glycine, exhibits a pattern of metabolic changes during the OGTT in diabetic patients that is opposite to the metabolic changes in glycine levels. The level of sarcosine during OGTT is a risk factor for diabetes. There are a few studies on sarcosine in patients with diabetes, and further research should be conducted on the phenomenon of elevated sarcosine levels.
Limitations of this study are as follows. First, owing to the small sample size, our findings may not be generalizable; therefore, future studies should include a larger study population. Second, because the participants were randomly selected, their basic information did not match, resulting in an excessive number of female participants. Third, in this study, IFG and IGT were combined as patients with IGR, although the 2 diseases are independent with different pathologies, and the metabolomic changes in the 2 populations need to be studied in more detail. The present study could not determine whether changes in metabolites during the OGTT could predict the development of T2DM, and prospective studies are needed to verify this hypothesis.
In conclusion, the results of this study showed differences in the levels of metabolite changes between NGT, IGR, and NDM individuals during the OGTT. The different patterns observed in metabolite-level changes in individuals with diabetes and controls have led to a deeper understanding of the development of diabetes. Consequently, gaining a better understanding of postprandial dysfunction in diabetes may aid in the intervention and prevention of diabetes. We believe this is particularly important because most individuals spend their daily activities in a nonfasting state, thereby providing new treatment opportunities.
Funding
This work was supported by the National Key Research and Development Program of China (2022YFE0131400).
Author Contribution
All authors designed, analyzed, wrote the draft of the manuscript, and approved the final version for publication. All authors agreed to accountability for the accuracy and integrity of the work.
Disclosures
The authors report there are no competing interests to declare.
Data Availability
Some or all data sets generated during and/or analyzed during the current study are not publicly available but are available from the corresponding author on reasonable request.
References
Abbreviations
- BCAAs
branched-chain amino acids
- BMI
body mass index
- FC
free cholesterol
- GEE
generalized estimating equation
- HDL
high-density lipoprotein
- IFG
impaired fasting glucose
- IGR
impaired glucose regulation
- IGT
impaired glucose tolerance
- LDL
low-density lipoprotein
- NDM
newly diagnosed type 2 diabetes
- NGT
normal glucose tolerance
- OGTT
oral glucose tolerance test
- PLS-DA
partial least squares discriminant analysis
- T2DM
type 2 diabetes mellitus
- TGs
triglycerides
- TMAO
trimethylamine N-oxide
- VLDL
very low-density lipoprotein
Author notes
Y.L. and X.L. contributed equally to this work.
