


Abstract
Hypothyroidism is often associated with cognitive and emotional dysregulation; however, the underlying neuropathological mechanisms remain elusive.
The study aimed to characterize abnormal alterations in hippocampal subfield volumes and functional connectivity (FC) in patients with subclinical hypothyroidism (SCH) and overt hypothyroidism (OH).
This cross-sectional observational study comprised 47 and 40 patients with newly diagnosed adult-onset primary SCH and OH, respectively, and 53 well-matched healthy controls (HCs). The demographics, clinical variables, and neuropsychological scale scores were collected. Next, the hippocampal subfield volumes and seed-based FC were compared between the groups. Finally, correlation analyses were performed.
SCH and OH exhibited significant alterations in cognitive and emotional scale scores. Specifically, the volumes of the right granule cell molecular layer of the dentate gyrus (GC-ML-DG) head, cornu ammonis (CA) 4, and CA3 head were reduced in the SCH and OH groups. Moreover, the volumes of the right molecular layer head, CA1 body, left GC-ML-DG head, and CA4 head were lower in SCH. In addition, the hippocampal subfield volumes decreased more significantly in SCH than OH. The seed-based FC decreased in SCH but increased in OH compared with HCs. Correlation analyses revealed thyroid hormone was negatively correlated with FC values in hypothyroidism.
Patients with SCH and OH might be at risk of cognitive decline, anxiety, or depression, and exhibited alterations in volume and FC in specific hippocampal subfields. Furthermore, the reduction in volume was more pronounced in SCH. This study provides novel insights into the neuropathological mechanisms of brain impairment in hypothyroidism.
Hypothyroidism is a common pathological phenomenon of thyroid hormone (TH) deficiency (1). Subclinical hypothyroidism (SCH) is diagnosed when free thyroxine (FT4) concentrations are within the normal reference range and thyroid-stimulating hormone (TSH) concentrations are above the reference range. If FT4 concentrations are decreased below the reference range, TSH concentrations are increased above the reference range, the diagnosis of overt hypothyroidism (OH) is made. In about 2% to 5% of cases each year, SCH may progress to OH (2). Previous studies have shown that hypothyroidism can be accompanied by symptoms of cognitive impairment (3), dementia (4), depression, and anxiety (5). However, the underlying neuropathophysiological mechanisms of SCH and OH in abnormal cognition and emotion remain unclear.
Magnetic resonance imaging (MRI) is a noninvasive technique that provides high-quality spatial resolution images and information on functional and tissue properties (6) and is widely used in neuroimaging studies of various diseases including hypothyroidism. Previous MRI studies have shown that patients with SCH or OH possessed brain structural and functional alterations, such as reduced gray matter or white matter volumes (7, 8), and decreased functional connectivity (FC) values (9, 10). However, few studies have combined structural and functional MRI methods to investigate the detailed mechanisms of brain impairment in SCH and OH.
The hippocampus is a central structure involved in learning, memory, and emotion processes (11, 12). As a limbic structure located in the medial temporal lobe, the hippocampus is a TH receptor-rich region of the brain (13). A previous study found that lower FT4 levels were positively associated with hippocampal atrophy (14). In addition, the hippocampal volume of adults with hypothyroidism has been shown to decline (15, 16), and lower hippocampal volume is associated with higher TSH levels (16). Another study using proton magnetic resonance spectroscopy documented changes in metabolites within the hippocampus among individuals with hypothyroidism (17). Nevertheless, it remains unclear whether there is a discrepancy in the effects of SCH and OH on the hippocampus.
The hippocampus is a specialized structure that includes the head, body, and tail (18), and can be divided into multiple subfields (19). Structural MRI offers exquisite anatomical detail and high sensitivity to pathological changes that allow for the assessment of structural changes in the brain (20, 21). FreeSurfer is a suite of tools for analyzing neuroimaging data (22) using probabilistic atlases constructed from ultrahigh resolution MRI data to generate automated segmentation of hippocampal substructures (23) that has been widely used in psychiatric and endocrine disorders such as schizophrenia (19), bipolar disorder (24), depression (24, 25), and diabetes (26). In addition, resting-state functional MRI (rs-fMRI), which reflects the baseline brain neuronal activity based on the blood oxygen level–dependent signals (27), is a promising method for studying FC. It can generate an FC map of the seed region of interest in the brain (28), providing information on which brain regions are functionally linked to the seed regions and to what extent (29). In previous studies, rs-fMRI methods have been used to explore FC in hippocampal subfields in major depression disorder or multiple sclerosis (30, 31). However, whether the structure of specific hippocampal subfields is affected differently by SCH and OH and whether the function of the corresponding damaged subfields is also differentially affected warrants further elucidation.
Therefore, this study explored structural or functional changes in hippocampal subfields in patients with adult-onset primary SCH and OH using FreeSurfer-based hippocampal subfields segmentation combined with resting-state FC analysis based on significantly differential hippocampal subfields as regions of interest. We hypothesized that (1) the volume or FC of specific hippocampal subfields is altered in patients with adult-onset SCH or OH. (2) These alterations may be associated with clinical variables and neuropsychological test scores of patients with adult-onset hypothyroidism.
Materials and Methods
Subjects
Ninety-two newly diagnosed, untreated subjects with adult-onset hypothyroidism (50 subjects with SCH and 42 with OH) were recruited from the Outpatient Department of Endocrinology of Gansu Provincial Hospital from October 2019 to October 2022. In addition, 58 healthy controls (HCs) whose TSH and FT4 levels were in the normal range were recruited from the surrounding communities. In total, 10 subjects (5 HCs, 3 SCH, and 2 OH) were excluded due to abnormal scale data, excessive head movement (mean frame-wise displacement > 0.2), and/or incomplete or missing images (Fig 1). The diagnosis of hypothyroidism was based on the Guidelines for Diagnosis and Management of Hypothyroidism in Adults (2017 Edition) (32). The SCH was defined as serum FT4 levels within the normal reference range (9.01-19.05 pmol/L) and TSH levels above the reference range (0.35-4.94 mIU/L). The OH was defined as lower serum FT4 levels and higher serum TSH levels.

A flowchart shows the subjects selection. HCs, healthy controls; SCH, subclinical hypothyroidism; OH, overt hypothyroidism; mFD, mean framewise displacement.
The participants were Han Chinese, right-handed, with at least 6 years of education, and aged between 18 and 60 years. The exclusion criteria were as follows: a history of neurological or psychiatric disorders, organic lesion of the central nervous system, prior endocrine disease, nonthyroid autoimmune disease (eg, systemic lupus erythematosus, rheumatoid arthritis, and Sjögren syndrome) (33-35), cardiovascular disease, other major chronic diseases, severe visual or hearing impairment, a history of alcohol or psychotropic substance abuse, pregnant or lactating women or women using oral contraceptives, or any contraindications to MRI examination. Detailed inclusion and exclusion criteria were provided in a previous study (36).
This study was approved by the Medical Ethics Committee of Gansu Provincial Hospital (approval number: 2019-196, 2023-500). Written informed consent was obtained from all subjects.
Clinical Variables and Neuropsychological Assessments
All participants underwent comprehensive clinical and neuropsychological evaluation. The following demographic details were recorded: age, sex, and years of education. Venous blood samples were collected at 8:00 Am (after fasting for more than 10 hours), and serum levels of TSH, triiodothyronine (T3), thyroxine (T4), free triiodothyronine (FT3), and FT4 were measured using a magnetic particle–based chemiluminescence immunoassay.
Global cognition was evaluated using the Beijing version of the Montreal Cognitive Assessment (MoCA), which contains some subscales evaluating domains, including visuospatial/executive function, naming, memory and delayed recall, attention, language, abstraction, and orientation. Depressive or anxiety symptoms were assessed using the 24-item Hamilton Depression Rating Scale (HAMD-24) and the Hamilton Anxiety Rating Scale (HAMA), respectively. All neuropsychological scales were administered by clinicians with specialized training in assessing neuropsychological scales and under the guidance of an experienced neurologist.
MRI Data Acquisition
All subjects underwent structural MRI and rs-fMRI examination on the same day as the completion of the neuropsychological tests. MRI data acquisition was performed using a 3.0 Tesla Magnetom Skyra MRI scanner (Siemens Healthcare, Erlangen, Germany) with a 32-channel coil by 2 experienced radiologists from the Department of Radiology. All participants were instructed to close their eyes, relax, and remain awake during the MRI scanning. A conventional MRI sequence, including axial T1 weighted image (T1WI), T2WI, and T2-FLAIR images, was used to exclude anatomical abnormalities. High-resolution 3-dimensional (3D) T1WI based on the magnetization-prepared repaid acquisition gradient echo sequence and rs-fMRI scans based on the blood oxygen level–dependent gradient-echo echo-planar imaging sequence were performed. The scanning parameters are shown in Table 1.
Scanning parameters of MRI
| Sequence | Scan plane | TR (ms) | TE (ms) | TI | FA | FOV (mm2) | Matrix | Slices | Thickness (mm) | Gap | NEX | Time points | Scanning times |
|---|---|---|---|---|---|---|---|---|---|---|---|---|---|
| 3D-T1WI | Sagittal scan | 2530 | 2.35 | 1100 | 7 | 256 × 256 | 256 × 256 | 192 | 1 | 0 | 1 | 1 | 323 |
| Rs-fMRI | Axial scan | 2000 | 30 | — | 90 | 224 × 224 | 64 × 64 | 33 | 3.5 | 0.7 | 1 | 420 | 848 |
3D-T1WI, 3-dimensional volumetric T1-weighted imaging sequence; FA, flip angle; FOV, field of view; NEX, number of excitations; rs-fMRI, resting-state functional magnetic resonance imaging; TR, repetition time; TE, echo time; TI, inversion time.
Structure MRI Data Preprocessing and Hippocampal Volume Calculation
The preprocessing of 3D-T1WI images was reconstructed in the FreeSurfer v7.2.0 (https://surfer.nmr.mgh.harvard.edu) recon-all pipeline to automate cortical and subcortical segmentation as well as tissue segmentation (23). An automated pipeline for hippocampal subfield segmentation is included in FreeSurfer (22). The automatic segmentation pipeline of hippocampal subfields in FreeSurfer subdivided hippocampal substructures into the head and body. It further divided the hippocampus into the left and right hippocampal tail, subiculum head, subiculum body, cornu ammonis (CA) 1 head, CA1 body, hippocampal fissure, presubiculum head, presubiculum body, parasubiculum, molecular layer (ML) head, ML body, granule cell molecular layer of the dentate gyrus (GC-ML-DG) head, GC-ML-DG body, CA3 head, CA3 body, CA4 head, CA4 body, fimbria, and hippocampus amygdala transition area (Fig. 2O). Postextraction of hippocampal subfield volumes was carried out for subsequent statistical analysis. We performed a standardized quality control of the hippocampal subfield segmentation via the ENIGMA consortium (37).
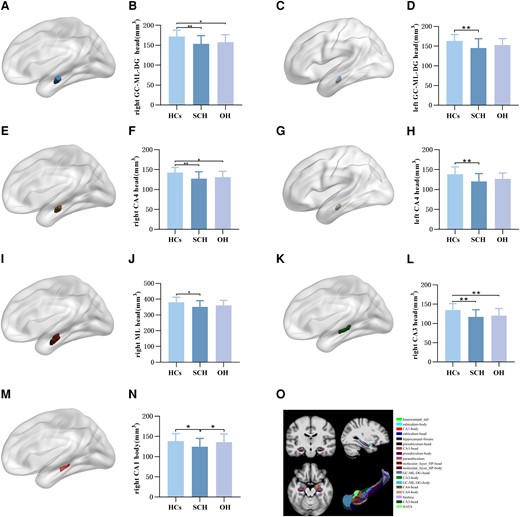
Comparison of hippocampal subfield volume of HCs, SCH, and OH groups. (A) Right GC-ML-DG head subfield. (B) Intergroup differences in right GC-ML-DG head volume among the 3 groups. (C) Left GC-ML-DG head subfield. (D) Intergroup differences in left GC-ML-DG head volume among the 3 groups. (E) Right CA4 head subfield. (F) Intergroup differences in right CA4 head volume among the 3 groups. (G) Left CA4 head subfield. (H) Intergroup differences in left CA4 head volume among the 3 groups. (I) Right ML head subfield. (J) Intergroup differences in right ML head volume among the 3 groups. (K) Right CA3 head subfield. (L) Intergroup differences in right CA3 head volume among the 3 groups. (M) Right CA1 body subfield. (N) Intergroup differences in right CA1 body volume among the 3 groups. (O) Graphical representation of hippocampal subfields segmentation. GC-ML-DG, granule cell molecular layer of the dentate gyrus; ML, molecular layer; HCs, healthy controls; SCH, subclinical hypothyroidism. OH, overt hypothyroidism.
rs-fMRI Data Preprocessing
All rs-fMRI data were preprocessed using Data Processing & Analysis for Resting-State Brain Imaging (DPABI V5.1, http://rfmri.org/dpabi) based on Statistical Parametric Mapping (SPM12) running on the MATLAB R2018b platform. The process consisted of 8 steps: (1) data format conversion; (2) removal of the first 10 time points; (3) slice time correction; (4) head movement correction to exclude participants with mean framewise displacement >2 mm; (5) spatial normalization into the standard Montreal Neurological Institute space and 3 × 3 × 3 mm resized voxels; (6) spatial smoothing using a 6-mm full-width half-maximum Gaussian kernel; (7) removal of the linear trend; (8) nuisance covariates regression to adjust for head movement, cerebrospinal fluid, white matter, and mean value signal of the whole brain.
Seed-Based FC Analysis
Seed-based FC analysis was performed using DPABI V5.1 software, and the seed regions were defined as specific hippocampal subfields with significant differences among the 3 groups based on the prior structural MRI analysis in this study. Pearson correlation analysis was performed between the mean time series of the seed regions and the whole brain voxels to generate the FC map for each subject. Next, Fisher's r to z transformation was conducted to improve the normality of the data for subsequent statistical analysis. Gaussian random field theory was used for multiple comparisons; the thresholds were voxel level P < .001 and cluster level P < .05.
Statistical Analysis
All statistical analyses of demographics, clinical variables, and neuropsychological scores were performed using SPSS 25.0 statistical software. The chi-square test was used to analyze the sex differences. Data with a normal distribution were analyzed by 1-way analysis of variance followed by the least significant difference (LSD) post hoc test to detect intergroup differences. Variables with a skewed distribution were compared using Kruskal–Wallis tests to evaluate differences. Comparisons of hippocampal subfield volumes were examined with analysis of covariance, controlling for age, sex, years of education, and estimated total intracranial volume (eTIV). Partial correlation analyses were performed between significant hippocampal subfield volumes and clinical variables or neuropsychological tests in hypothyroidism, controlling for age, sex, years of education, and eTIV (false discovery rate correction). The FC values between significantly differential hippocampal subfields and other brain regions were analyzed using 1-way analysis of variance, with age, sex, years of education, and head movements as covariates based on the statistical toolbox of DPABI software. Pearson or Spearman correlation analysis was performed between significant FC values and clinical variables or neuropsychological tests in hypothyroidism (false discovery rate correction). LSD post hoc tests were applied to confirm intergroup effects. The threshold of statistical significance was set as P < .05.
Results
Subjects
A total of 140 participants (HCs = 53, SCH = 47, and OH = 40) were included in the final analysis. There were no significant differences among the 3 groups in terms of age, sex, years of education, naming, language, and orientation scores (P > .05). Compared with HCs, SCH had lower T4 and FT4 levels, lower scores of MoCA subitems, such as visuospatial/executive function, attention, abstraction, and memory, lower total MoCA scores and eTIV, higher TSH levels, HAMD-24, and HAMA scores. In addition, compared with HCs, OH had lower T3, T4, FT3, and FT4 levels, lower scores of MoCA subitems, including visuospatial/executive function, attention, abstraction, and memory, lower total MoCA scores and eTIV, higher TSH levels, HAMD-24, and HAMA scores. The OH group had higher TSH levels and lower eTIV than SCH, and no significant differences were detected in other demographic data (P > .05) (shown in Table 2).
Demographics, clinical variables and neuropsychological test scores of HCs, SCH, and OH groups
| Parameters | HCs (n = 53) | SCH (n = 47) | OH (n = 40) | χ2/F/z | P |
|---|---|---|---|---|---|
| Demographics | |||||
| Age (years) | 36.17 ± 9.88 | 38.19 ± 10.08 | 39.17 ± 9.70 | 1.137 | .324 |
| Sex (male/female) | 19/34 | 11/36 | 10/30 | 2.240 | .326 |
| Education (years) | 14.75 ± 3.28 | 13.96 ± 3.38 | 13.48 ± 3.52 | 1.717 | .184 |
| Clinical variables | |||||
| TSH (mIU/L) | 1.99 (1.26-2.24) | 12.19 (10.07-18.54)a | 53.73 (25.09-99.46)a,b | 109.297 | <.001 |
| T3 (nmol/L) | 1.55 (1.41-1.72) | 1.61 (1.40-1.81) | 1.08 (0.67-1.48)a,b | 34.930 | <.001 |
| T4 (nmol/L) | 97.25 (89.55-103.39) | 81.28 (70.90-93.21)a | 44.89 (23.30-53.92)a,b | 93.326 | <.001 |
| FT3 (pmol/L) | 4.36 ± 0.45 | 4.37 ± 0.67 | 3.02 ± 1.13a,b | 43.216 | <.001 |
| FT4 (pmol/L) | 13.22 ± 1.20 | 10.85 ± 1.30a | 6.12 ± 2.21a,b | 232.798 | <.001 |
| Neuropsychological tests | |||||
| MoCA (score) | 27.98 ± 1.68 | 25.57 ± 2.78a | 25.83 ± 3.11a | 13.564 | <.001 |
| Visuospatial/executive | 4.74 ± 0.59 | 3.79 ± 0.91a | 4.03 ± 1.00a | 17.582 | <.001 |
| Naming | 3.00 ± 0.00 | 2.87 ± 0.40 | 2.93 ± 0.27 | 2.822 | .063 |
| Attention | 5.81 ± 0.44 | 5.38 ± 0.85a | 5.38 ± 0.98a | 5.226 | .007 |
| Language | 2.77 ± 0.51 | 2.51 ± 0.69 | 2.60 ± 0.67 | 2.335 | .101 |
| Abstraction | 2.00 ± 0.00 | 1.72 ± 0.50a | 1.80 ± 0.41a | 7.871 | .001 |
| Delayed recall | 4.00 (3.00-5.00) | 3.00 (2.00-4.00)a | 2.50 (2.00-4.00)a | 20.575 | <.001 |
| Orientation | 6.00 ± 0.00 | 5.98 ± 0.15 | 6.00 ± 0.00 | 0.989 | .375 |
| HAMD-24 (score) | 3.00 (1.00-4.50) | 9.00 (3.00-14.00)a | 6.00 (1.25-10.75)a | 22.846 | <.001 |
| HAMA (score) | 1.00 (0.00-2.00) | 5.00 (3.00-9.00)a | 3.00 (1.00-6.75)a | 30.420 | <.001 |
Abbreviations: FT3, free triiodothyronine; FT4, free thyroxine; HAMA, Hamilton Anxiety Rating Scale; HAMD-24, 24-item Hamilton Depression Rating Scale; HC, healthy control; MoCA, Montreal Cognitive Assessment Scale; OH, overt hypothyroidism; SCH, subclinical hypothyroidism; T3, triiodothyronine; T4, thyroxine; TSH, thyroid-stimulating hormone.
aCompared with healthy controls, P < .05.
bCompared with SCH, P < .05.
Comparison of Hippocampal Subfield Volumes Among Groups
The volumes of bilateral GC-ML-DG head (right: P = .004; left: P = .028) and CA4 head (right: P = .004; left: P = .023), right hippocampal CA1 body (P = .036), CA3 head (P = .003), ML head (P = .046), and whole hippocampal head (P = .034) were significantly different among the 3 groups. The volumes of bilateral GC-ML-DG head (right: P = .001; left: P = .008), CA4 head (right: P = .001; left: P = .007), right CA1 body (P = .040), CA3 head (P = .001), ML head (P = .013), and whole hippocampal head (P = .010) were significantly lower in SCH than in HCs after the LSD post hoc test. Compared with HCs, OH had lower volumes of the right GC-ML-DG head (P = .018), CA4 head (P = .020), and CA3 head (P = .009) after the LSD post hoc test. In addition, the volume of the right CA1 body (P = .018) was lower in SCH than OH. No significant differences were found in the volumes of other hippocampal subfields (Fig. 2).
Seed-Based FC Alterations Among Groups
FC values were decreased in SCH and increased in OH compared with the HCs group (Gaussian random field corrected, voxel P < .001, cluster P < .05). Compared with the HCs group, FC values between the right CA3 head and left paracentral lobule, between the right ML head and left frontal superior medial, between the left CA4 head and right cingulate anterior were reduced in SCH. Moreover, compared with the HCs group, FC values between the right ML head and right frontal medial orbital, between the right ML head and left frontal superior medial, between the left CA4 head and right cingulate anterior were increased in OH. Compared with SCH, FC values between the right CA3 head and left paracentral lobule, between the right ML head and right frontal medial orbital, between the right ML head and left frontal superior medial, between the left CA4 head and right cingulate anterior were also increased in the OH group (Table 3 and Figs. 3 and 4).
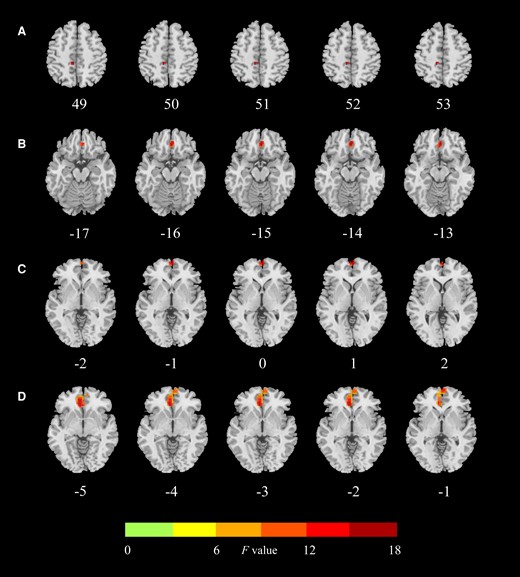
Regions with significant differences in functional connectivity between the hippocampus subfield and the whole brain between HCs, SCH, and OH groups. (A) Significant abnormality of FC values of the right CA3 head–left paracentral lobule among the 3 groups. (B) Significant abnormality of FC values of the right ML head–right frontal medial orbital among the 3 groups. (C) Significant abnormality of FC values of the right ML head–left frontal superior medial among the 3 groups. (D) Significant abnormality of FC values of the left CA4 head–right cingulate anterior among the 3 groups. HCs, healthy controls; SCH, subclinical hypothyroidism. OH, overt hypothyroidism; ML, molecular layer; FC, functional connectivity.
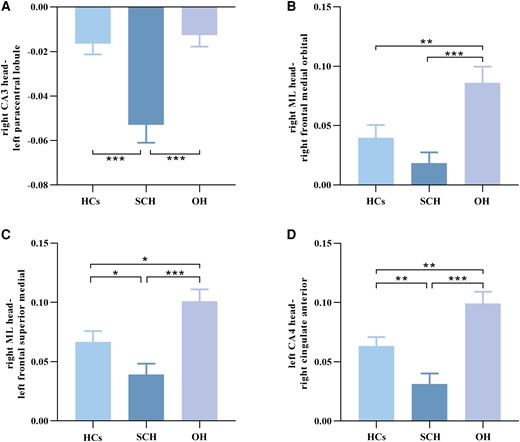
Standard error of mean histogram showing significant differences in functional connectivity between the hippocampus subregions and the entire brain in HCs, SCH, and OH groups. (A) Intergroup differences of FC values of the right CA3 head–left paracentral lobule among the 3 groups. (B) Intergroup differences of FC values of the right ML head–right frontal medial orbital among the 3 groups. (C) Intergroup differences of FC values of the right ML head–left frontal superior medial among the 3 groups. (D) Intergroup differences of FC values of the left CA4 head–right cingulate anterior among the 3 groups. HCs, healthy controls. SCH, subclinical hypothyroidism. OH, overt hypothyroidism. ML, molecular layer; FC, functional connectivity.
Total anomaly in significant clusters located using functional connectivity values in whole brain hemisphere among HCs, SCH, and OH groups
| Seed regions | Significant brain regions | Voxel size | Coordinates MNI | F values | ||
|---|---|---|---|---|---|---|
| X | Y | Z | ||||
| Right CA3 head | Left paracentral lobule | 23 | −9 | −33 | 51 | 12.891 |
| Right ML head | Right frontal medial orbital | 47 | 3 | 39 | −15 | 8.945 |
| Left frontal superior medial | 18 | 0 | 63 | 0 | 10.007 | |
| Left CA4 head | Right cingulate anterior | 237 | −6 | 36 | −3 | 14.341 |
Abbreviations: HC, healthy controls; ML, molecular layer; MNI, Montreal Neurological Institute; OH, overt hypothyroidism; SCH, subclinical hypothyroidism.
Correlation Analysis
Partial correlation analyses were used to assess the correlations between hippocampal subfield volumes and clinical variables or neuropsychological scales. Taking age, sex, years of education, and eTIV as covariates, no significant correlations were observed between clinical variables or neuropsychological scales and differential hippocampal subfield volumes in patients with adult-onset hypothyroidism. Spearman correlation analyses were employed to evaluate the correlations between FC values and clinical variables or neuropsychological scales. Results showed that the FC values between the right CA3 head and left paracentral lobule were negatively correlated with T4 (r = −0.353, P = .005) and FT4 (r = −0.338, P = .008). The FC values between the right ML head and right frontal medial orbital were negatively correlated with T3 (r = −0.323, P = .012), T4 (r = −0.386, P = .002), and FT4 (r = −0.414, P = .001). The FC values between the right ML head and left frontal superior medial were negatively correlated with T4 (r = −0.313, P = .015), and FT4 (r = −0.431, P = .001). The FC values between the left CA4 head and right cingulate anterior were negatively correlated with T3 (r = −0.310, P = .015), T4 (r = −0.402, P = .001), FT3 (r = −0.366, P = .004), and FT4 (r = −0.436, P = .001) (Fig 5).
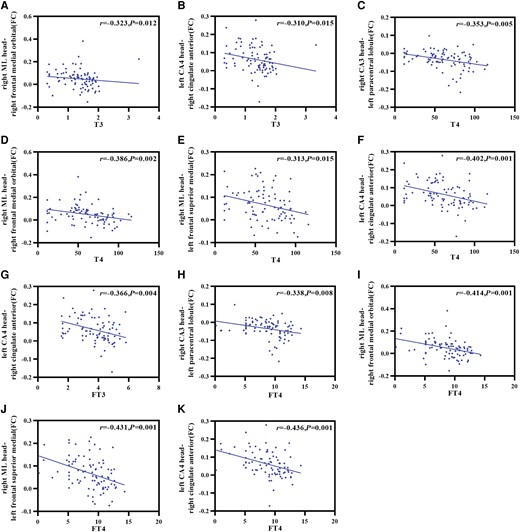
Correlations between the abnormal brain regions and clinical variables or neuropsychological test scores in hypothyroidism. (A) T3 was negatively correlated with the FC of the right ML head and right frontal medial orbital. (B) T3 was negatively correlated with the FC of the left CA4 head and right cingulate anterior. (C) T4 was negatively correlated with the FC of the right CA3 head and left paracentral lobule. (D) T4 was negatively correlated with the FC of the right ML head and right frontal medial orbital. (E) T4 was negatively correlated with the FC of the right ML head and left frontal superior medial. (F) T4 was negatively correlated with the FC of the left CA4 head and right cingulate anterior. (G) FT3 was negatively correlated with the FC of the left CA4 head and right cingulate anterior. (H) FT4 was negatively correlated with the FC of the right CA3 head and left paracentral lobule. (I) FT4 was negatively correlated with the FC of the right ML head and right frontal medial orbital. (J) FT4 was negatively correlated with the FC of the right ML head and left frontal superior medial. (K) FT4 was negatively correlated with the FC of the left CA4 head and right cingulate anterior. ML, molecular layer; T3, triiodothyronine; T4, thyroxine; FT3, free triiodothyronine; FT4, free thyroxine.
Discussion
To the best of our knowledge, this is the first study to assess hippocampal subfield volume and FC in patients with adult-onset hypothyroidism. The major findings of this study are that, compared with HCs, both SCH and OH showed varying degrees of cognitive and affective impairment, and the distribution of impaired hippocampal subfields in SCH and OH was essentially comparable. Notably, the SCH group exhibited more severe reductions in hippocampal subfield volumes, with the right CA3 head, GC-ML-DG head, and CA4 head as predominantly affected subfields. Furthermore, compared with HCs, FC values between the CA3 head and paracentral lobule, ML head and frontal lobe, CA4 head and cingulate decreased in the SCH group, while the FC values increased between the ML head and frontal lobe and the CA4 head and cingulate in the OH group. Notably, TH levels were negatively correlated with FC values between significantly differential hippocampal subfields and other brain regions, suggesting that TH may be involved in brain functional alterations in patients with adult-onset hypothyroidism.
In this study, we found that the volumes of GC-ML-DG and CA3 were decreased in both SCH and OH groups, and the volume of CA1 was reduced in the SCH group. Studies have reported that GC-ML-DG, CA3, and CA1 are interconnected through sequential information delivery to form a “trisynaptic circuit” (38,39). The hippocampus is a target region for TH action (40), and postnatal development of the hippocampal DG is affected by TH (41). In adult rats, it was found that neurogenesis deficits caused by TH deficiency altered the entire GC-ML-DG, resulting in a significant reduction in the total dentate granule cell number and GC-ML-DG volume (13, 42). The GC-ML-DG is also involved in neurogenesis and synaptic plasticity during brain development and in adulthood (43), which is essential for learning and memory (44). CA3 abnormalities may underlie the psychopathological features of certain psychiatric disorders (43) and are involved in various crucial memory processes such as forming accurate spatial memory (45). Evidence has revealed that adult-onset hypothyroidism induces morphological changes in CA3 pyramidal cells while reducing the number of neurons in the CA3 area of the hippocampus (46). The extracellular glutamate and aspartate levels, which play important roles in cognitive processes, were decreased in CA3 in adult hypothyroid rats (47). Basal calcium-dependent calmodulin kinase II (CaMKII) activity and the levels of phosphorylated CaMKII, total CaMKII, and calmodulin are reduced in the hippocampal CA1 area in adult-onset hypothyroidism (48), which may modulate hippocampal synaptic strength and the dendritic spine shape (49), possibly reflecting a loss of the CA1 volume. Taken together, these findings may underscore the relationship between the “trisynaptic circuit” and cognitive impairment of adult-onset hypothyroidism. However, no correlations were found between specific hippocampal subfields and cognitive function in the present study, which merits further exploration.
Our study found a decreased ML volume in the SCH group and an increased FC between the ML and frontal lobe in the OH group. The ML contains interneurons and apical dendrites of hippocampal pyramidal cells, which represent the input areas of the hippocampal subfields and receive a large amount of incoming information (50), stretching from the DG along the CA subfields to the subiculum (51). A reduced ML volume may arise from decreased internal and external hippocampal connectivity and loss of neurons from CA to subiculum, leading to a reduction in ML synaptic number and ultimately memory deficits (52), which is also correlated with cognitive performance in mild cognitive impairment or Alzheimer's disease (53). Importantly, we found increased FC values between the ML and frontal lobe in the OH group. It was previously demonstrated that the frontal lobe is involved in various cognition functions and emotion regulation (54, 55). Therefore, we hypothesize that increased FC may be a potential neural compensatory mechanism for patients with OH to maintain normal cognition and emotion. Collectively, the current study may help to indicate some of the changes the brain undergoes in adult-onset hypothyroid states.
CA4 is considered an essential anatomical site for neural pathways connecting the hippocampus to other brain regions (56). Our findings demonstrated a reduction in CA4 volume among patients with adult-onset hypothyroidism. A previous study showed that the hippocampal CA4 region may be damaged in patients with hypothyroidism (57). In the present study, we found that FC values of the CA4 and anterior cingulate gyrus were decreased in the SCH group. A fMRI-based study reported lower activation of the anterior cingulate cortex in SCH (7), which supports our findings.
It is noteworthy that specific hippocampal subfield volumes were lower in the SCH and OH groups compared with the HCs group. However, the volume reduction was more severe in SCH. Intriguingly, the FC in hippocampal subfields was decreased in SCH but increased in OH. A previous study found that high TSH levels were associated with a reduced hippocampal volume (16), while TH levels were negatively correlated with hippocampal volume (58), which may explain why the SCH group had a greater volume loss than the OH group. Studies have shown that enhanced FC is a secondary outcome of neural atrophy and a compensatory mechanism for maintaining function in multiple sclerosis (59, 60). Therefore, we speculate that increased FC in OH may serve as a compensatory mechanism in response to the decreases in volume. Interestingly, we found negative correlations between lower TH levels and higher FC values in hypothyroidism, which aligns with our findings that FC was increased in the OH group, expanding our understanding of the neuropathophysiological mechanisms underlying brain impairment in OH.
Nevertheless, this study has several limitations. Firstly, this study is a cross-sectional study and therefore we could not explain the causal relationship between adult-onset hypothyroidism and brain impairment. In future, longitudinal follow-up studies are advocated to address this issue. Moreover, resting-state studies have inherent limitations because correlation patterns observed at rest may inadvertently reflect uncontrolled mental tasks (61), future studies should explore task-state functional MRI. Finally, although T1WI has the advantage that the acquisition of dedicated images is not required in terms of measuring subfield volumes, the contrast of T1WI has not been optimized for the hippocampus; thus, T1WI subfield approaches have a typically lower effect size than T2WI approaches (62). Follow-up studies should be conducted with T2WI approaches to study hippocampal subfields.
In conclusion, we found similar atrophy patterns in specific hippocampal subfields in both adult-onset SCH and OH. Notably, the SCH group exhibited a more pronounced decrease in volume than the OH group. Furthermore, the negative correlations between TH levels and FC values suggest that TH may play a pivotal role in the brain functional impairment in adult-onset hypothyroidism. These findings advance our understanding of the neuropathological mechanisms underlying brain impairment in patients with adult-onset SCH or OH.
Acknowledgments
We thank the subjects and the investigators who participated in this study.
Funding
This work was supported by the Natural Science Foundation of Gansu Province (20JR5RA153), the National Natural Science Foundation of China (No. 82060152), the Key Research and Development Program of Gansu Province (23YFFA0048), and the Research Fund of Gansu Provincial Hospital (22GSSYD-53).
Author Contributions
T.Z.: writing-original draft, writing-review & editing and formal analysis; L.Z.: study idea and design, writing-review & editing; W.S.: data curation; C.C., Q.S.: data collection; C.Y., H.Z., and J.C.: MRI data processing; L.T.: study idea and design.
Disclosures
No competing financial interests exist for any author.
Data Availability
Some or all datasets generated during and/or analyzed during the current study are not publicly available but are available from the corresponding author on reasonable request.
References
Abbreviations
- CaMKII
calcium-dependent calmodulin kinase II
- eTIV
estimated total intracranial volume
- FC
functional connectivity
- FT3
free triiodothyronine
- FT4
free thyroxine
- GC-ML-DG
granule cell molecular layer of the dentate gyrus
- HAMA
Hamilton Anxiety Rating Scale
- HAMD-24
24-item Hamilton Depression Rating Scale
- HCs
healthy controls
- LSD
least significant difference
- ML
molecular layer
- MoCA
Montreal Cognitive Assessment Scale
- MRI
magnetic resonance imaging
- OH
overt hypothyroidism
- rs-fMRI
resting-state functional MRI
- SCH
subclinical hypothyroidism\
- T1WI
T1 weighted image
- T3
triiodothyronine
- T4
thyroxine
- TH
thyroid hormone
- TSH
thyroid-stimulating hormone
Author notes
Taotao Zhang and Lianping Zhao are joint first authors.
