


Abstract
Use of artificial intelligence (AI) to predict clinical outcomes in thyroid nodule diagnostics has grown exponentially over the past decade. The greatest challenge is in understanding the best model to apply to one's own patient population, and how to operationalize such a model in practice.
A literature search of PubMed and IEEE Xplore was conducted for English-language publications between January 1, 2015 and January 1, 2023, studying diagnostic tests on suspected thyroid nodules that used AI. We excluded articles without prospective or external validation, nonprimary literature, duplicates, focused on nonnodular thyroid conditions, not using AI, and those incidentally using AI in support of an experimental diagnostic outside standard clinical practice. Quality was graded by Oxford level of evidence.
A total of 61 studies were identified; all performed external validation, 16 studies were prospective, and 33 compared a model to physician prediction of ground truth. Statistical validation was reported in 50 papers. A diagnostic pipeline was abstracted, yielding 5 high-level outcomes: (1) nodule localization, (2) ultrasound (US) risk score, (3) molecular status, (4) malignancy, and (5) long-term prognosis. Seven prospective studies validated a single commercial AI; strengths included automating nodule feature assessment from US and assisting the physician in predicting malignancy risk, while weaknesses included automated margin prediction and interobserver variability.
Models predominantly used US images to predict malignancy. Of 4 Food and Drug Administration–approved products, only S-Detect was extensively validated. Implementing an AI model locally requires data sanitization and revalidation to ensure appropriate clinical performance.
Thyroid nodules are highly prevalent, affecting more than 50% of people older than 50 years (1, 2). Increasingly, their discovery may be incidental, given the increased use of cross-sectional imaging (3). Nodules may span the diagnostic spectrum from benign and asymptomatic, to symptomatic, to cancerous. Diagnostic workup often involves several steps, associated cost, and resultant patient anxiety (4-6).
Ultrasound (US) and fine-needle aspiration (FNA) biopsy have been the gold standard for thyroid nodule assessment, but performance and interpretation are plagued by variability across physicians interpreting US findings, performing the FNA, and interpreting cytology, yielding frequent inadequate or indeterminate results (7, 8). Assessment of a thyroid nodule represents an area where technology may offer opportunities for improvement (9). With the development of new techniques and greater accessibility of computational power, artificial intelligence (AI) has been applied by thyroid researchers over the past decade to automate nodule localization and improve risk stratification, to decrease operator variability and the need for potentially unnecessary biopsies or diagnostic surgery (10).
Numerous AI models have been proposed in the literature, but the greatest challenge is in understanding a model's applicability to one's own patient population, and how to operationalize such a model in practice. Efforts have been made to identify available models. Toro-Tobon et al (11) systematically identify manuscripts applying AI to various thyroid conditions, reporting on model performance and stage of development. Similarly, Taha et al (12) review a selection of 18 AI models in thyroid diagnostics. Ludwig et al (13) report on a selection of 33 models using AI to diagnose and classify thyroid nodules. However, these reviews do not systematically assess relative model strength and external validity, making assessment of future or external performance difficult. Our aim is to perform a systematic literature review to identify and compare the various AI models developed for thyroid nodule diagnostics, their relative strength and external validity, and the clinical inputs used for each outcome predicted.
Materials and Methods
Systematic Literature Search
An inclusive query was developed and then refined to ensure that known relevant articles appeared in the results. The PubMed and IEEE Xplore databases were queried with the following terms: (artificial intelligence OR machine learning OR deep learning OR neural network) AND (thyroid). The search was restricted to English-language papers published on or after January 1, 2015, through the search date, January 1, 2023. Titles and abstracts were screened for relevance (985 studies), followed by full-text review (448 studies) to determine inclusion. During full-text review, relevant articles identified in citations were reviewed for inclusion. The PRISMA flow diagram (14) denotes the number of studies excluded at each step (Fig. 1).
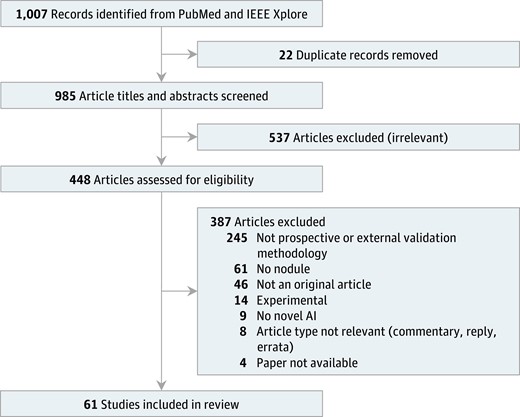
Preferred reporting items for systematic reviews and meta-analyses (PRISMA) flow diagram. Meta-analysis was not performed as part of this review.
Study Selection
We included original research studying diagnostic tests on suspected thyroid nodules that used AI. AI techniques included non–deep learning (eg, regression, decision tree, random forest) and deep-learning (eg, neural network) techniques. We excluded articles without prospective or external validation, nonprimary literature, duplicates, focused on nonnodular thyroid conditions, not using AI, and those incidentally using AI in support of an experimental diagnostic outside standard clinical practice (eg, spectrometry, spectroscopy).
Data Abstraction and Analysis
Each paper was independently reviewed by 2 of 3 authors (V.R.S., A.R., and V.I.), first for inclusion, then for data extraction, and discrepancies were addressed by discussion. Details including sample size, study design, statistical methods, AI methodology, clinical inputs, and outcome predicted were tabulated and level of evidence was rated according to the Oxford Centre for Evidence-Based Medicine (15).
Results
In total, 61 studies were included (Table 1). Oxford level of evidence ranged from 2 to 3 (77). In total, 61 studies met the inclusion criteria of including external validation. Of these, 33 also compared the model's performance to physician assessment (physician comparison). Of the 61 studies, 16 were prospective in study design. The intersection of study designs is shown in Fig. 2. Statistical validation of model stability was reported in 50 papers (77).
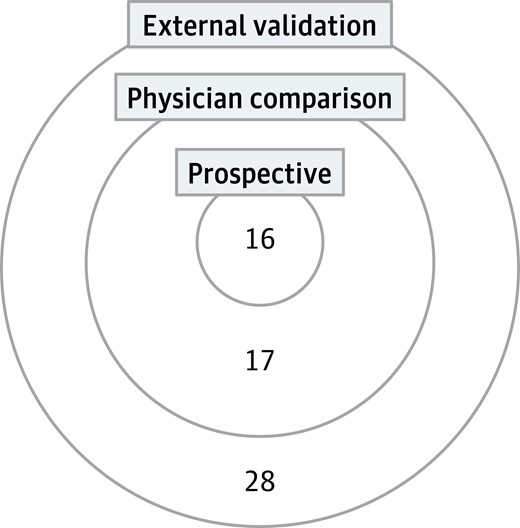
Intersection of study designs. This Venn diagram quantifies the different study designs captured in this review.
Included articles and outcomes assessed
| Source by outcome | Outcome ground truth |
|---|---|
| Nodule localization | |
| Nie et al, 2022 (16) | Nodule contour |
| Ultrasound risk score | |
| Chi et al, 2017 (17) | US risk score |
| Duan et al, 2020 (18) | US risk score |
| Zhang et al, 2022 (19) | US risk score |
| Gao et al, 2018 (20) | US risk score |
| Bai et al, 2020 (21) | US risk score |
| Molecular status | |
| Anand et al, 2021 (22) | Molecular test |
| Malignancy | |
| Pankratz et al, 2016 (23) | Surgical pathology |
| Wang et al, 2018 (24) | Surgical pathology |
| Song et al, 2020 (25) | Cytology |
| Zhou et al, 2020 (26) | Cytology |
| Zhou et al, 2020 (27) | Cytology |
| Böhland et al, 2021 (28) | Surgical pathology |
| Lee et al, 2021 (29) | Cytology |
| Park et al, 2021 (30) | Surgical pathology |
| Zhang et al, 2021 (31) | Cytology |
| Jia et al, 2022 (32) | Surgical pathology |
| Jin et al, 2022 (33) | Cytology, surgical pathology |
| Keutgen et al, 2022 (34) | Surgical pathology |
| Liu et al, 2022 (35) | Cytology |
| Randolph et al, 2022 (36) | Surgical pathology |
| Li et al, 2019 (37) | Cytology, surgical pathology |
| Park et al, 2019 (38) | Cytology, surgical pathology |
| Song et al, 2019 (39) | Cytology, surgical pathology |
| Koh et al, 2020 (40) | Cytology, surgical pathology |
| Wei et al, 2020 (41) | Surgical pathology |
| Zhang et al, 2020 (42) | Surgical pathology |
| Zhu et al, 2021 (43) | Cytology, surgical pathology |
| Zhu et al, 2021 (44) | Cytology |
| Zhu et al, 2021 (45) | Cytology, surgical pathology |
| Han et al, 2022 (46) | Cytology, surgical pathology |
| Yang et al, 2022 (47) | Cytology, surgical pathology |
| Barczyński et al, 2020 (48) | Surgical pathology |
| Liang et al, 2020 (49) | Cytology, surgical pathology |
| Zhang et al, 2020 (50) | Surgical pathology |
| Peng et al, 2021 (51) | Cytology, surgical pathology |
| Zhu et al, 2021 (52) | Surgical pathology |
| Kim et al, 2022 (53) | Cytology |
| Wang et al, 2022 (54) | Surgical pathology |
| Wang et al, 2022 (55) | Surgical pathology |
| Xu et al, 2022 (56) | Surgical pathology |
| Long-term prognosis | |
| Abbasian et al, 2022 (57) | Metastases |
| Yu et al, 2022 (58) | Metastases |
| Zou et al, 2022 (59) | Metastases |
| Multi-outcome | |
| Bhalla et al, 2020 (60) | Metastases, surgical pathology |
| Yang et al, 2020 (61) | Nodule contour, surgical pathology |
| Chen et al, 2021 (62) | Surgical pathology, survival/recurrence |
| Dolezal et al, 2021 (63) | Molecular test, surgical pathology |
| Swan et al, 2022 (64) | Surgical pathology, US risk score |
| Wu et al, 2022 (65) | Metastases, surgical pathology |
| Kim et al, 2019 (66) | Cytology, nodule presence, surgical pathology, US risk score |
| Han et al, 2021 (67) | Cytology, surgical pathology, US risk score |
| Liang et al, 2021 (68) | Cytology, nodule contour, surgical pathology, US risk score |
| Stenman et al, 2022 (69) | Surgical pathology, survival/recurrence |
| Choi et al, 2017 (70) | Cytology, nodule contour, surgical pathology, US risk score |
| Yoo et al, 2018 (71) | Cytology, US risk score |
| Jeong et al, 2019 (72) | Cytology, surgical pathology, US risk score |
| Xia et al, 2019 (73) | Cytology, surgical pathology, US risk score |
| Wei et al, 2020 (74) | Cytology, surgical pathology, US risk score |
| Cui et al, 2022 (75) | Surgical pathology, US risk score |
| Huang et al, 2022 (76) | Cytology, surgical pathology, US risk score |
Abbreviation: US, ultrasound.
Starting with known clinical steps, a diagnostic pipeline was abstracted from the papers, representing the clinical data collected and used in AI models, and the resultant AI-predicted outcomes (Fig. 3). The distribution of data inputs used to predict clinical outcomes is shown in Fig. 4. Additional details on the 4 Food and Drug Administration (FDA)-approved thyroid AI diagnostic solutions are reported in Table 2. The following 5 high-level abstracted outcomes were used to organize reporting of the remaining results.
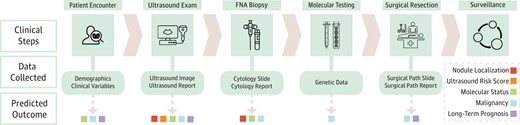
Clinical workflow with resultant data inputs and predicted outcomes. A diagnostic pipeline was abstracted from the papers starting with known clinical steps and culminating in 5 high-level predicted outcomes. If a certain input modality was included in a paper for one of the predicted outcomes, the corresponding data collection box had an arrow pointing out that outcome.
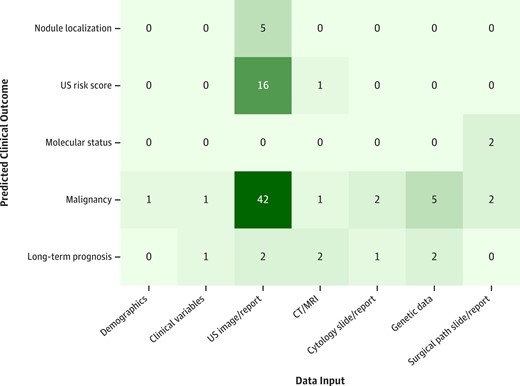
Distribution of data inputs used to predict clinical outcomes. Each paper was categorized by data input and predicted clinical outcome. If a paper was multi-input or multi-outcome, it was counted for each input-outcome combination.
Assessment of commercially available computer-aided diagnoses in the United States
| Commercially available CAD | Input | Output | Nodule localization | Downstream clinical implications | Limitations | Clinical workflow integration |
|---|---|---|---|---|---|---|
| AmCAD-UT | Static ultrasound image | − Nodule features (echogenicity, echogenic foci, texture, margin, tumor shape, anechoic area percentage) − Ultrasound risk score (TI-RADS, ATA, other international systems) − Structured summary report | Automated | Provides a malignancy risk for several risk stratification systems, along with quantitative and visual data on key nodule features, allowing for faster and more efficient patient triaging | − Lack of extensive external validation in clinical setting − Expects ultrasounds with discrete nodules > 1 cm (78) | Windows-based platform intended for use on a PC or at a workstation (78, 79) |
| S-Detect | Static ultrasound image | − Nodule features (composition, shape, orientation, margins, echogenicity, and spongiform appearance) − Binary recommendation of possibly malignant/benign − Structured summary report | Semi-automated (user marks middle of nodule) | − Primarily improves diagnostic performance for junior radiologists (74) − Does not incorporate nonimaging patient data − Performance is dependent on choice of input image, which is dependent on operator experience − Potential discrepancy in nodule margin and composition assessment − Works only with vendor-specific ultrasound machines | Developed for a vendor-specific ultrasound machine (79) | |
| Koios DS | 2 static ultrasound images (axial and sagittal) (80) Location on thyroid | − Nodule features (echogenicity, echogenic foci, tumor shape, composition, margin) − Thyroid nodule dimensions − Ultrasound risk score (TI-RADS) | Manual | − Lack of extensive external validation of this software in real-world clinical setting − Requires manual input in the form of ROI to localize nodule (81, 82) | Used at PACS workstation (79) | |
| Exo AI (formerly MEDO-Thyroid) | Static ultrasound image(s) | − Thyroid lobe and nodule dimensions − Ultrasound risk score (TI-RADS) (based on user input) − Structured summary report | Semi-automated | Improves ease of reporting an ultrasound study for clinicians | − Lack of extensive external validation of this software in real-world clinical setting − Requires manual input in the form of ROI to localize nodule − Tested only on Philips, GE, and Siemens ultrasound devices (83) | Cloud-based software |
Abbreviations: ATA, American Thyroid Association; CAD, computer-aided diagnosis; PC, personal computer; ROI, region of interest; TI-RADS, Thyroid Imaging Reporting & Data System.
Nodule Localization
Localization of nodules in US images was assessed by 5 papers (16-68). Localization was performed through the tasks of detection and segmentation. Detection involves identifying an image region that contains the object of interest. To create training labels for the US studies, radiologists annotated nodules on US images with rectangular bounding boxes to serve as ground truth for model training (70). Segmentation involves identifying the specific contour of the object of interest. To create training labels, radiologists manually contoured nodules on US images to serve as ground truth for model training (16, 61).
The goals of such models were 2-fold: (1) to improve speed and standardization in determining whether an image had thyroid nodules present, and (2) to focus feature extraction on suspected nodule regions for use in downstream tasks. For instance, Yang et al (61) found that a model trained to predict malignancy from US images performed better when trained with nodule-focused features.
Prospective localization studies used Samsung's commercial computer-aided diagnosis (CAD) software, S-Detect, which first requests users to perform detection (70, 74-76). S-Detect then uses AI to propose segmentation masks for the user to choose from, before generating an AI-based US risk score and malignancy prediction. Despite the effort to improve standardization through semi-automated segmentation, Jeong et al (72) found that when the CAD was used by experienced radiologists, it performed better than when used by less experienced radiologists. They concluded that persistent performance variability was likely due to user variability, even in choosing among segmentation candidates.
Ultrasound Risk Score
Sixteen papers predicted sonographic features associated with risk of malignancy or a composite score such as the American College of Radiology Thyroid Imaging Reporting and Data System (TI-RADS) (66, 68, 70, 64-73, 74). Sonographic risk stratification systems aim to decrease variability in reporting nodule features and estimating malignancy risk, but interreporter and intrareporter variability persist (70). These papers used AI to decrease variability further, reduce the burden on physicians manually assessing a score, and improve US risk score performance.
Six papers prospectively validated the commercial product S-Detect, which predicts sonographic features as well as malignancy (70, 71-73, 74). Wei et al (74) found that less experienced radiologists benefited most from S-Detect assistance, bringing their TI-RADS assessments in line with those of experienced radiologists, which were considered as ground truth. Choi et al (70) and Xia et al (73) found substantial agreement between S-Detect and experienced radiologists for all feature predictions apart from margin. Jeong et al (72) and Yoo et al (71) reported similar results with discrepancy in composition and spongiform features, respectively.
Cui et al (75) prospectively evaluated AI-TIRADS, a machine-learning model that reassigned new values to constituent TI-RADS features in an effort to preserve model explainability. They compared its performance to the American College of Radiology's original (2017) version of TI-RADS, and found a lower rate of unnecessary FNA (41.0% vs 47.8%) and missed cancer diagnosis (22.8% vs 27.5%).
Molecular Status
Testing tumors for genetic alterations and assessing differential RNA expression has proven helpful in predicting malignancy, tumor aggressiveness, and response to targeted therapy, but cost prohibits their routine use (60, 62). Two papers used AI to predict molecular status opportunistically from routinely obtained clinical inputs such as US, to provide an alternative: Anand et al (22) and Dolezal et al (63) analyzed cytology and surgical pathology slides to predict high-risk mutations. Dolezal et al (63) took this one step further, externally validating their model to predict BRAF-RAS gene status (area under the receiver operating characteristic curve [AUROC] 0.97) and noninvasive follicular thyroid neoplasm with papillary-like nuclear features (NIFTP), a liminal diagnosis with high interobserver variability.
Malignancy
The majority of papers (26) predicted malignancy, aiming to improve speed and reliability of diagnosis and to avoid unnecessary biopsies for patients (63-65, 60-67, 70-76). Malignancy predictions used either of two sources as ground truth: cytology (FNA) and surgical pathology (resection). Several papers used both, although none to our knowledge included nodules that were not biopsied and presumed benign sonographically. Most studies excluded cytologically indeterminate (Bethesda III or IV) nodules from their analysis, with only 5 papers including them for evaluation (34, 35, 39, 47, 64).
All 16 prospective studies assessed malignancy, including 7 that evaluated the commercial product S-Detect. Barczyński et al (48) and Wei et al (74) found S-Detect had greater sensitivity and specificity in predicting malignancy from US compared to a junior physician, but less compared to a senior physician. Performance of junior physicians improved significantly when assisted by AI, but senior physician performance did not. Choi et al (70) found S-Detect to have similar sensitivity but lower specificity and AUROC compared to an experienced physician. Xia et al (73) found similar results, and in subgroup analysis noted a shortfall in model performance specifically with malignant nodules (papillary thyroid cancer or follicular thyroid cancer). Jeong et al (72) noted lower specificity compared to senior physicians only, as well as operator dependence of CAD performance as noted earlier. Yoo et al (71) found that a CAD-assisted physician had higher sensitivity (92.0%) than either physician (84.0%) or CAD (80.0%) alone, and Huang et al (76) found a similar result across all physician experience levels. Although there was no universal definition of experience level, “senior physicians” were typically those with more than 9 to 20 years of experience with thyroid US.
AI-SONIC is a commercial CAD that completely automates nodule detection, but is not currently approved for use in the United States. Zhang et al (50) prospectively studied AI-SONIC, finding that compared to a senior physician, the CAD had similar specificity (86.0% for both) but lower sensitivity (71.5% vs 95.2%) and AUROC (0.79 vs 0.91). However, they noted that sensitivity improved both for senior and junior physicians when assisted by CAD (95.2% vs 97.8% and 75.3% vs 88.2%, respectively). Wang et al (55) found that AI-SONIC had greater AUROC (0.906) than senior radiologists (0.787) in classifying malignancy. They demonstrated that the AI system could achieve similar or higher sensitivity and specificity compared to each radiologist at an appropriate decision threshold. Xu et al (56) found a similar pattern, with an AI-SONIC AUROC of 0.76 outperforming senior radiologists. However, at the specific decision threshold the authors chose, AI-SONIC had much higher specificity (0.71) than senior radiologists (0.56) but lower sensitivity (AI-SONIC 0.69 vs radiologist 0.78).
Of the prospective studies, Kim et al (53) and Yoo et al (71) used cytology alone as malignancy ground truth, seven papers (48, 50, 52, 54-56, 75) used surgical pathology alone, and the rest used a more balanced mix of both, reflecting the respective potential biases as described above. One paper reported receiving funding from Samsung to study S-Detect (70) but the remaining prospective studies reported no industry conflicts of interest.
Long-term Prognosis
Long-term prognostic cancer outcomes were characterized by 7 papers, including metastases (60, 59-65) and recurrence/survival (62, 69). Thyroid cancer prognosis currently involves dynamic risk stratification, whereby initial risk is assessed from operative and histopathologic findings and modified over a subsequent time interval using clinical evidence of tumor response. AI models tried to predict tumor biology from the outset, with the aim of allowing the physician to better counsel the patient before surgery regarding anticipated cancer aggressiveness, lymph node metastases, and need for adjuvant treatment. Most models used as inputs imaging or genetic data alone, while Zou et al (59) additionally used clinical variables.
Bhalla et al (60) identified a 36-gene panel that could predict American Joint Committee on Cancer staging as I/II vs III/IV with a positive predictive value of 84% and sensitivity of 76%. Chen et al (62) trained and externally validated a model using DNA methylation data and were able to better predict overall survival than could be done through tumor, node, metastases staging.
Discussion
The past decade has seen a major push to deliver on the promise of AI to improve physician workflow, patient outcomes, and health-care delivery. Physicians may benefit from faster, standardized, and less burdensome processes to predict nodule localization, sonographic features, and malignancy risk, and can more appropriately counsel patients regarding extent of surgery and de-escalation of care. Patients may avoid unnecessary biopsies and benefit from improved diagnostic accuracy, decreased need for diagnostic surgery, and clearer expectations for long-term prognosis. Health care may be delivered at lower cost as information later in the diagnostic pipeline is predicted opportunistically from routinely obtained data, and task automation allows health-care providers to practice at the top of their scope.
The Artificial Intelligence–Empowered Physician
For physicians who wish to use a commercial AI solution, 4 CADs have been approved by the FDA: AmCAD-UT, S-Detect, Koios DS, and MEDO-Thyroid, as reviewed in further detail in Table 2. Although none are currently in widespread clinical use, S-Detect has undergone the most extensive validation.
Sonographic risk stratification and malignancy prediction, outcomes with significant clinical effect and the most readily available data, received the most attention in analyzed papers. Specifically with commercial CADs, S-Detect had difficulty with automated margin and composition prediction. AI-SONIC validation studies demonstrated higher AUROC compared to radiologists of all skill levels. Importantly, whether sensitivity, specificity, or both, improved depended on the specific decision threshold chosen for AI-SONIC. Wang et al (55) and Xu et al (56) both selected thresholds by optimizing a combination of sensitivity and specificity. Adjusting the decision threshold may alter the balance between type I and type II errors, improving sensitivity or specificity at the expense of the other. Depending on the intended use in the diagnostic pipeline (eg, “rule-out test”), it may be more clinically useful to optimize a certain metric (eg, maximize sensitivity). Further work in identifying optimal decision thresholds for different uses will be valuable.
Rather than trying to replace a physician, the greatest current value appeared to be in democratizing care via the concept of the “AI-empowered physician.” Studies found that the AI-empowered physician performed better than physician or AI alone. Several studies found that inexperienced physicians with AI assistance made malignancy predictions with similar accuracy as experienced physicians. This use of AI has tremendous potential to enable patients at nonspecialized centers to receive similar diagnostic care as patients presenting to tertiary-care centers. The biggest barrier to widespread adoption is the need for pilot testing in each local environment to identify how AI can provide the greatest benefit (eg, time, staffing, or quality improvement).
How a paper chose their data source for malignancy prediction affected potential bias. Some papers used cytology alone, others used surgical pathology alone, and some used both. Using surgical pathology alone limited data to patients who required surgery, typically those with larger nodules or higher suspicion of malignancy. Papers that used cytology alone had more benign cases, but could not account for false-negative biopsies, and typically excluded indeterminate results. Thus, caution should be used when extrapolating the findings of such papers beyond the population evaluated.
Although the literature is inundated with retrospective studies reporting successful nodule localization techniques, few validated these approaches prospectively or externally. In fact, most commercial CADs do not entirely automate nodule localization, reflecting that real-world segmentation is not easy to automate. Additionally, nodule localization is an important technical intermediary step but not a critical clinical end point, which may explain the dearth of prospective or external validation studies.
Molecular prediction was externally validated in fewer papers, reflecting the recency of molecular testing gaining mainstream utility. In most countries outside the US, molecular testing for indeterminate nodules has not entered routine practice. Although opportunistic molecular prediction has strong clinical potential, lack of data access may hold up practical application. Long-term outcome prediction suffered similar inattention. Although opportunities to develop such data sets are not limited by the same logistical and financial issues as molecular testing, maintaining long-term oncologic follow-up requires considerable effort. This data curation issue likely drove researchers to assess other more readily available outcomes. Moreover, as a later stage in the clinical pipeline, it may have appeared comparatively lower-value in a disease with generally good prognosis.
The Ideal Artificial Intelligence Model
Critical review of an AI model's versatility requires assessment of several criteria including performance on prospective and external data sets, statistical validity, adequate training cohort size, and evaluation of bias in the training data set. Using a standardized methodology for model evaluation allows one to better distinguish clinically effective tools from poorly designed ones.
Models solely trained and evaluated on single retrospective data sets have uncertain external validity. Prospective evaluation and external validation promote exposure to unseen data, which can help uncover overfitting and bias. Beyond robust study design, reporting statistical validity through bootstrapping and cross-validation is important to understanding model stability. Of the reviewed papers, 82% included a CI, SE, or P value with their metrics of model performance. Such reporting helps evaluate variation in model performance on different data subsets, giving greater confidence in a model's performance on varied real-world data.
Next, sample size and data set curation must be considered. A minimum sample size is typically necessary to ensure data diversity, although numbers are application-specific. However, even large data sets may yield limited diversity due to poor data set curation and risk developing models that are overfit to idiosyncrasies unique to the training data. Validation of an AI model should be performed on a data set that closely reflects the expected real-world use case. For example, most validation studies excluded cytologically indeterminate nodules, which comprise a substantial portion of real-world thyroid nodule FNA results. Excluding indeterminate nodules in studies is problematic because model evaluation on an idealized data set would be an unrealistic representation of model performance in a clinical setting. A model that is not trained on indeterminate nodules would perform unpredictably when encountering them during prospective or external model validation. Thus, expected performance of existing AI models for such nodules in clinical practice remains unclear. Similarly, given the low overall prevalence of malignancy in thyroid nodules, it is important that a validation data set reflect this pattern as well. Some studies artificially balance the frequency of benign and malignant cases for model training, and use similar proportions during model validation, not recognizing that these validation results may not reflect performance in the expected target population.
Rigorous implementation of these methods is intensive but crucial to improving confidence in the real-world validity of an AI model. While we see their utility in thyroid nodule diagnostics, they apply even more broadly in advancing AI-powered diagnostics in other disease domains.
Future Directions
We anticipate the next decade to yield both advancements in AI research applications as well as improvement in integration of AI solutions into mainstream clinical practice.
As seen in Fig. 4, few studies leveraged rich data modalities such as clinical variables and cytopathology slides. Future technical innovations should aim to integrate multiple data sources in a multimodal approach that could emulate a physician's synthesis of all available clinical data to provide the most accurate prediction. Along a similar vein, future methods leveraging US should explore the effect of multiple frames (through cine clips or sampling full-image studies) in improving automated diagnosis performance. Given that in clinical practice physicians make use of multiple views of a nodule to make a diagnosis, using multiple frames could address a limitation of most existing CAD systems that rely on manually selected, single-frame inputs. Several outcomes have also received minimal attention, such as prediction of molecular status and long-term outcomes, although they have high clinical value. Expanding data access through more effective data-sharing and publication of open-source data sets will enhance research replication and refinement of existing methodologies. Lastly, stronger collaboration between computational researchers and clinicians will ensure that the most important clinical problems are addressed, and that models are designed most effectively.
Regarding clinical integration, 4 commercial CADs are FDA approved for use but no reports in the literature mention their routine clinical use, to our knowledge. Each takes slightly different inputs and has slightly different strengths and potential use cases. Building physician trust and adapting to local practice variation will be the 2 most important steps to enabling integration of AI solutions into mainstream clinical use. Deep-learning models in particular can appear to some as a “black-box,” and in the absence of thorough external validation, may engender physician mistrust in the predicted results. Tools such as Gradient-weighted Class Activation Mapping (Grad-CAM) to visualize influential regions in an input image may help overcome this issue (46). Even without obvious explainability, rigorous prospective and external validation may help physicians eventually feel comfortable using a model.
The second important hurdle to overcome is local variation. Institutions use different US machines, serve patients with differing characteristics, and use different workflows. In contrast, training data sets used to train AI models are often “idealized” in that they lack artifacts and noise, furthering the need for effective, real-world validation. Integration of AI will require careful local stakeholder and workflow analysis to select the most impactful value proposition for that site, as well as infrastructure to locally pilot models.
Limitations
The included studies had significant heterogeneity in model technique, data sources, and outcomes predicted. As a result, direct comparison between studies was not possible. While papers were limited to the English language, most models were trained on data sets from China, Korea, or India, where screening and surgical practices are notably different compared to the United States and Europe. This challenges model validity outside their respective environments. Even within a similar clinical environment, implementing a model locally requires data sanitization, revalidation, and potential retraining to ensure performance.
We identified 61 studies using AI to predict thyroid nodule–focused outcomes, of which 16 were prospective, 61 performed external validation, and 33 performed physician comparison. Models using US images to predict malignancy predominated, and 1 of the 4 FDA-approved CADs (S-Detect) was extensively validated. Further validation and integration into clinical workflow will help models achieve greater clinical utility.
Funding
This work was supported by the National Institute of Biomedical Imaging and Bioengineering of the National Institutes of Health (award No. R21EB030691) as well as a UCLA Radiology Exploratory Research Grant.
Disclosures
The authors have nothing to disclose.
Data Availability
Some or all data sets generated during and/or analyzed during the current study are not publicly available but are available from the corresponding author on reasonable request.
References
FDA 510k: AmCAD-UT Detection 2.2. Available at: https://www.accessdata.fda.gov/cdrh_docs/pdf18/K180006.pdf. Accessed January 29, 2024.
Abbreviations
- AI
artificial intelligence
- AUROC
area under the receiver operating characteristic curve
- CAD
computer-aided diagnosis
- FDA
Food and Drug Administration
- FNA
fine-needle aspiration
- TI-RADS
Thyroid Imaging Reporting & Data System
- US
ultrasound
Author notes
V.R.S. and A.R. contributed equally as co-first authors of this work.
