


Abstract
Psychological distress has been linked to diabetes risk. Few population-based, epidemiologic studies have investigated the potential molecular mechanisms (eg, metabolic dysregulation) underlying this association.
To evaluate the association between a metabolomic signature for psychological distress and diabetes risk.
We conducted a nested case-control study of plasma metabolomics and diabetes risk in the Nurses' Health Study, including 728 women (mean age: 55.2 years) with incident diabetes and 728 matched controls. Blood samples were collected between 1989 and 1990 and incident diabetes was diagnosed between 1992 and 2008. Based on our prior work, we calculated a weighted plasma metabolite-based distress score (MDS) comprised of 19 metabolites. We used conditional logistic regression accounting for matching factors and other diabetes risk factors to estimate odds ratios (OR) and 95% confidence intervals (CI) for diabetes risk according to MDS.
After adjusting for sociodemographic factors, family history of diabetes, and health behaviors, the OR (95% CI) for diabetes risk across quintiles of the MDS was 1.00 (reference) for Q1, 1.16 (0.77, 1.73) for Q2, 1.30 (0.88, 1.91) for Q3, 1.99 (1.36, 2.92) for Q4, and 2.47 (1.66, 3.67) for Q5. Each SD increase in MDS was associated with 36% higher diabetes risk (95% CI: 1.21, 1.54; P-trend <.0001). This association was moderately attenuated after additional adjustment for body mass index (comparable OR: 1.17; 95% CI: 1.02, 1.35; P-trend = .02). The MDS explained 17.6% of the association between self-reported psychological distress (defined as presence of depression or anxiety symptoms) and diabetes risk (P = .04).
MDS was significantly associated with diabetes risk in women. These results suggest that differences in multiple lipid and amino acid metabolites may underlie the observed association between psychological distress and diabetes risk.
Epidemiologic studies provide growing evidence that various forms of psychological distress, such as depression, anxiety, and other forms of distress, are associated with increased risk of developing diabetes (1-3). Psychological distress may promote glucose intolerance, insulin resistance, and diabetes development through multiple pathways. Prior work suggests that chronic distress may lead to maladaptive biological stress responses involving the sympathetic nervous system and the hypothalamus-pituitary-adrenal axis, both of which play essential roles in energy mobilization and metabolic homeostasis (4). Exposure to sustained psychological distress may lead to dysregulated stress hormones (eg, cortisol) and altered neurotransmitter levels (eg, serotonin) that disrupt metabolic signaling and downstream glucose and lipid metabolism (5-7). Further, psychological distress is associated with the development of unhealthy lifestyles and poor decision-making, which could exacerbate metabolic dysregulation and induce the onset of diabetes (8).
However, there is limited evidence from population-based human studies with regard to the molecular mechanisms underlying linkages between psychological distress and diabetes risk. In our prior work, we identified and validated a plasma metabolite-based distress score (MDS) comprised of 20 metabolites (including serotonin, threonine, hippurate, biliverdin, glutamine, etc.; Supplementary Table S1) (9) in postmenopausal women from 2 large prospective cohort studies, the Nurses' Health Study (NHS) and the Women's Health Initiative (WHI) (10, 11). The MDS is a weighted, linear combination of the set of 20 plasma metabolites that represents a small molecule metabolite snapshot of chronic distress. In subsequent work, the MDS was robustly associated with increased risk of incident cardiovascular disease (12). For this current study, we leverage the MDS as a biologic marker of chronic psychological distress and evaluate its association with incident diabetes in a nested case-control study of plasma metabolomics and diabetes risk in the NHS. We also evaluate the extent to which this molecular measure of psychological distress may explain the association of phenotypic psychological distress (ie, ascertained by questionnaires) with diabetes risk, compared with other diabetes risk factors such as lifestyles and obesity. Following prior work in developing the MDS (10-12), we defined chronic psychological distress according to depression or anxiety status. Specifically, we hypothesize that higher MDS is associated with increased risk of incident diabetes in women. We further investigate the hypothesis that the amount of the association between phenotypic psychological distress and diabetes risk explained by MDS was comparable to that accounted for by other risk factors, such as body mass index (BMI) and behavioral factors.
Methods
Study Population
The NHS was established in 1976 when 121 700 US female nurses aged 30-55 years completed a baseline questionnaire on their lifestyle, disease history, and health status. Participants have been contacted biennially via mailed questionnaires to update health-related information, with 85% to 90% response rates across follow-up cycles. In 1989-1990, a subset of 32 826 participants provided heparinized blood samples, which were shipped on an ice pack to our biorepository by overnight courier; immediately processed; aliquoted into plasma, red blood cells, and white blood cells; and stored in liquid nitrogen freezers (−130 °C) since collection. Among participants who provided fasting blood samples (89% of all samples, defined as ≥8 hours since last meal), we conducted a nested case-control study including 728 diabetes cases diagnosed after blood collection between 1992 and 2008 and 728 incidence-density matched healthy controls (13). For each diabetes case, 1 control was randomly sampled from those who were free of diabetes at the time of the case diagnosis and matched on age (±1 year), race and ethnicity, and date of the blood collection (±3 months). Specifically, a participant may be selected as the control for multiple cases during the period when the participant remained diabetes-free, and a control may become a case later when the control develops diabetes (14). The study protocol was approved by the Institutional Review Boards of the Brigham and Women's Hospital and the Harvard T.H. Chan School of Public Health. Return of the questionnaire was considered to imply consent by the participant.
Ascertainment of Incident Diabetes
Incident diabetes diagnoses in the NHS were identified by self-reports on each biennial questionnaire since 1976 and confirmed by a mailed supplemental questionnaire evaluating symptoms, diagnostic tests, and diabetes treatment. Type 2 diabetes was confirmed if ≥1 of the following 3 criteria by the National Diabetes Data Group (15) were met: (1) elevated plasma glucose levels (fasting glucose ≥140 mg/dL or random glucose ≥200 mg/dL) with ≥1 classic symptoms (polydipsia, polyuria, polyphagia, weight loss, or coma); (2) elevated plasma glucose on at least 2 occasions (fasting glucose ≥140 mg/dL, random glucose ≥200 mg/dL, and/or glucose ≥200 mg/dL after an oral glucose test) with no symptoms; (3) hypoglycemic treatment with insulin or oral medications. An updated cutoff of 126 mg/dL for fasting glucose was used for diagnoses after 1997 according to the American Diabetes Association diagnostic criteria (16). Use of hemoglobin A1c for diagnosing diabetes, which was recommended by the American Diabetes Association in 2010, was not considered in our criteria, because the current study only included diabetes cases diagnosed between 1992 and 2008. In a validation study of 62 NHS participants ascertained to have diabetes through the supplementary questionnaire, 61 (98%) were confirmed by medical records (17).
Metabolomic Assays
Plasma samples were analyzed using 3 liquid chromatography-tandem mass spectrometry-based metabolite profiling methods: hydrophilic interaction liquid chromatography analyses of water-soluble metabolites in the positive ionization mode and in the negative ionization mode as well as C8 chromatography with positive ion mode analyses of polar and nonpolar plasma lipids. Assays were performed as described previously (18). Internal standard peak areas were monitored for quality control and to ensure system performance throughout analyses. Pooled plasma reference samples were also inserted every 20 samples as an additional quality control. Raw liquid chromatography-tandem mass spectrometry data were processed using TraceFinder software (Thermo Fisher Scientific; Waltham, MA, USA) and Progenesis QI (Nonlinear Dynamics; Newcastle upon Tyne, UK). In our pilot testing of the metabolomics platform, 92% of metabolites had excellent assay reproducibility, and nearly 90% of metabolites were stable over 1 to 2 years within women (19).
Derivation of the MDS
Derivation of the MDS has been described in detail previously (12). Briefly, a broad pool of 100 metabolites previously associated with psychosocial distress from our prior work in the NHS, NHSII, and WHI were considered as candidates for MDS (the NHS subsample used to derive the MDS in our prior work (12) and the current NHS diabetes case-control sample did not overlap). All metabolite values were first log-transformed and then standardized to Z-scores. Of these, 11 metabolites have undergone rigorous discovery-validation process; after removing 1 of 2 highly correlated metabolites, 10 metabolites were directly included in the MDS. Another 10 metabolites were selected from the remaining 89 metabolites using LASSO regression to identify strong associations and reduce collinearity. The total 20 metabolites were further included simultaneously into a conditional logistic regression model with psychological distress status as the outcome to obtain the coefficient estimate for each metabolite.
Of these 20 metabolites, only arachidonate was not available in the current dataset because the metabolomic assay method to measure arachidonate (ie, the C18-neg platform to measure free fatty acids and bile acids) was not performed in this study. Out of 1456 case-control samples, the number of missing values was 3 for 3-methylxanthine, 4 for serotonin, 19 for cotinine, and 0 for the remaining 16 metabolites (Supplementary Table S1) (9). We imputed the missing values using half of the minimum values assuming these missing values represent low levels below the limit of detection (20). We computed the MDS in the current nested case-control study of diabetes as a linear combination of metabolite levels in which the corresponding metabolite coefficients were estimated in our prior work conducted in independent subsamples of the NHS and WHI (12). The 19-metabolite score was highly correlated with the full 20-metabolite score in the original WHI (r = 0.97) and NHS (r = 0.97) samples. Further, this 19-metabolite MDS had a Pearson correlation coefficient of 0.16 (P < .001) with BMI among controls.
Assessment of Psychological Distress
Consistent with our prior work (11), we defined psychological distress as the presence of depression using multiple indicators, symptoms of anxiety, or both. Presence of depression was determined from a combined indicator based on depressive symptoms, antidepressant use, and clinically diagnosed depression. Depressive symptoms were assessed in 1992 by the 5-item Mental Health Index (MHI-5) from the Short-Form 36 Health Status Survey. An MHI-5 score (range: 0-100) ≤52 has been validated to indicate clinically relevant depression (21). Antidepressant use was self-reported in 1996. History of physician-diagnosed depression was queried in 2000 including date of first diagnosis, and we assessed individuals as having depression if they reported the date of diagnosis prior to 1996. The presence of probable depression was determined by having 1 or more of MHI-5 ≤ 52, antidepressant use, or clinically diagnosed depression. Anxiety symptoms were assessed in 1988 using the 8-item Crown-Crisp Phobic Anxiety Index (CCI; range: 0-16). The CCI has been shown to well discriminate individuals with anxiety disorders from healthy controls in psychiatric outpatient clinic settings, and CCI ≥ 4 was considered to indicate probable anxiety following prior work (22). In prospective study designs, both the composite depression measure and the anxiety symptoms evaluated by the CCI have been associated with chronic disease risk including diabetes in this cohort (22-24). Participants who met our definition of probable depression, probable anxiety, or both were considered to have psychological distress. Of note, depression-related measures were collected 2 to 6 years after the blood collection (Supplementary Fig. S1) (9). Considering that the majority of major depressive disorder has an age of onset before 45 years (25), these depression-related measures were likely to well reflect depressive symptoms prior to the blood collection (mean age at blood collection: 55 years).
Covariate Assessment
Birth date and height were self-reported at baseline in 1976. Marital status was assessed in 1980. Race and ethnicity were self-identified in 1992. Every 2 years, participants reported their smoking status, menopausal status, residential address (geocoded to derive census tract household income), and body weight. We calculated BMI as weight in kilograms divided by the square of height in meters. For these biennially assessed covariates, we used the information reported in 1988 that was close but prior to the blood collection. Diagnosis of diabetes in first-degree relatives was assessed in 1982, 1988, and 1992; participants who had a positive response on any of these questionnaires were considered to have a family history of diabetes. Leisure-time physical activity was assessed in 1986 and 1988 using a validated questionnaire, and metabolic equivalent task hours per week were derived to quantify exercise duration and intensity. A semiquantitative Food Frequency Questionnaire with extensive validation in our cohorts was administered in 1984, 1986, and 1990 to assess diet, and the Alternative Healthy Eating Index (AHEI-2010) was used to measure diet quality. For physical activity and diet quality, we calculated the average values over the questionnaire cycles described previously to reduce measurement errors.
Statistical Analysis
We used conditional logistic regression to estimate odds ratios (OR) and 95% confidence intervals (CIs) for incident diabetes risk according to quintiles of the distress-related metabolite score. The quintiles were determined based on the score distribution among controls (ie, participants who were not diagnosed with diabetes during follow-up). We considered 3 models. Model 1 was an unadjusted conditional logistic regression model accounting for case-control matching on age, race, and time of blood collection. Model 2 adjusted for multiple diabetes risk factors, including menopausal status, marital status, family history of diabetes, household income, smoking, diet quality (measured by AHEI-2010), and physical activity. Model 3 further controlled for continuous BMI, as obesity is 1 of the strongest risk factors for diabetes. For each model, in addition to estimating associations between MDS quintiles and diabetes risk, we calculated P for trend by modeling the metabolite score continuously and estimated the associations for each SD increment in the score. We conducted stratified analysis by several established diabetes risk factors in women, including age (≥55, <55 years), menopausal status, family history of diabetes, and BMI (≥25, <25 kg/m2). Statistical significance of subgroup differences was assessed by the likelihood ratio test comparing the models with vs without the multiplicative interaction term between the MDS and each of the stratification variables listed previously. To assess the contributions of individual metabolites included in the MDS to diabetes risk, we performed similar analyses to estimate diabetes risk corresponding to a 1 SD increase in each metabolite.
Finally, we used unconditional logistic regression to evaluate the association between baseline psychological distress and diabetes risk adjusting for matching factors, menopausal status, marital status, family history of diabetes, and household income. To address the temporal relationship (eg, depression-related measures were collected several years after blood draw between 1992 and 1996 as described earlier), we excluded diabetes cases diagnosed prior to 1998 in this analysis to ensure that assessment of psychological distress preceded diabetes onset (263 case-control pairs excluded). We further conducted 3 separate exploratory analyses using the %mediate macro (https://ysph.yale.edu/cmips/research/software/mediate/) to quantify and compare the percent of the association between baseline psychological distress and diabetes risk accounted for by (1) the continuous MDS; (2) lifestyle factors including smoking, diet quality, and physical activity; and (3) continuous BMI. All analyses were performed in SAS statistical software version 9.4 (SAS Institute Inc., Cary, NC, USA).
Results
Compared with controls, cases were more likely to report a family history of diabetes and have higher BMI and probable depression and anxiety but lower physical activity, AHEI score, and census tract household income (Table 1). Matching factors (age, race and ethnicity, date of blood collection), menopausal status, marital status, and smoking status were similar between cases and controls. The mean (SD) of the MDS was 0.20 (1.36) in cases and −0.20 (1.34) in controls.
Sample characteristics of cases and controls at blood collection
| Cases | Controls | |
|---|---|---|
| n | 728 | 728 |
| Matching factors | ||
| Age, years | 55.2 (6.6) | 55.2 (6.6) |
| White, % | 98 | 98 |
| Date of blood collection | ||
| Mar-May, % | 24 | 27 |
| Jun-Aug, % | 29 | 25 |
| Sep-Nov, % | 21 | 18 |
| Dec-Feb, % | 27 | 30 |
| Demographic factors | ||
| Premenopausal, % | 24 | 24 |
| Marital status | ||
| Married, % | 93 | 93 |
| Divorced/separated, % | 5 | 5 |
| Widowed, % | 2 | 2 |
| Family history of diabetes, % | 47 | 29 |
| Census tract household income | 43 482 (15 007) | 46 581 (18 435) |
| Biobehavioral factors | ||
| Body mass index, kg/m2 | 28.8 (5.2) | 25.1 (4.2) |
| Current smokers, % | 13 | 12 |
| Physical activity, MET-hrs/week | 12.9 (14.6) | 15.1 (19.7) |
| Alternate Healthy Eating Index | 49.8 (9.6) | 51.6 (9.5) |
| Phenotypic psychological distress | ||
| Probable depression, % | 11 | 8 |
| Probable anxiety, % | 35 | 31 |
| Metabolite-based distress score | 0.20 (1.36) | −0.20 (1.34) |
Abbreviations: MET, metabolic equivalent task.
After accounting for the matched design, a higher MDS was associated with significantly increased risk of diabetes (Table 2). Compared with Q1 of the MDS, the multivariable-adjusted OR (95% CI) for diabetes was 1.39 (0.96, 2.03) for Q2, 1.46 (1.02, 2.09) for Q3, 2.27 (1.59, 3.26) for Q4, and 2.83 (1.96, 4.09) for Q5 (P-trend <.0001). Each 1 SD increment in MDS was associated with a 40% higher risk (95% CI: 1.25, 1.57). The association was slightly weaker after adjusting for menopausal status, marital status, family history of diabetes, household income, smoking status, diet quality, and physical activity (OR per SD increment: 1.36; 95% CI: 1.21, 1.54; P-trend <.0001). Further adjustment for continuous BMI noticeably attenuated the association and resulted in a modest positive relationship (OR per SD increment: 1.17; 95% CI: 1.02, 1.35; P-trend = .02). Although no significant differences in the association between the MDS and diabetes risk were observed by age, menopausal status, family history of diabetes, and BMI (P-interaction >.19), the positive association between the MDS and risk of developing diabetes was more apparent among women <55 years, overweight/obese women, and women without a family history of diabetes (Table 3).
Risk of developing incident diabetes according to the plasma MDS in the Nurses' Health Study
| MDS quintilesa | Per SD | P-trend | |||||
|---|---|---|---|---|---|---|---|
| Q1 | Q2 | Q3 | Q4 | Q5 | |||
| Cases/controls | 88/145 | 113/146 | 122/146 | 184/145 | 221/146 | ||
| Median | −1.86 | −0.88 | −0.24 | 0.43 | 1.52 | ||
| Range | −6.52, −1.29 | −1.29, −0.55 | −0.54, 0.04 | 0.04, 0.84 | 0.84, 5.37 | ||
| Model 1b | 1.00 (ref) | 1.39 (0.96, 2.03) | 1.46 (1.02, 2.09) | 2.27 (1.59, 3.26) | 2.83 (1.96, 4.09) | 1.40 (1.25, 1.57) | <.0001 |
| Model 2c | 1.00 (ref) | 1.16 (0.77, 1.73) | 1.30 (0.88, 1.91) | 1.99 (1.36, 2.92) | 2.47 (1.66, 3.67) | 1.36 (1.21, 1.54) | <.0001 |
| Model 3d | 1.00 (ref) | 0.94 (0.60, 1.48) | 1.15 (0.75, 1.77) | 1.36 (0.89, 2.08) | 1.54 (0.99, 2.41) | 1.17 (1.02, 1.35) | .02 |
Abbreviations: MDS, metabolite-based distress score.
aMDS was derived based on a weighted sum of 19 metabolites previously associated with psychological distress.
bModel 1: accounted for matching factors using conditional logistic regression.
cModel 2: Model 1 + adjusted for menopausal status, marital status, family history of diabetes, household income, smoking status, Alternative Healthy Eating Index, and physical activity.
dModel 3: Model 2 + adjusted for continuous body mass index.
Associations between the plasma metabolite-based distress score and diabetes risk stratified by age, menopausal status, body mass index, and family history of diabetes
| Cases/controls | OR (95% CI) | P-interaction | |
|---|---|---|---|
| Age | .52 | ||
| <55 years | 361/363 | 1.23 (1.03, 1.47) | |
| ≥ 55 years | 367/365 | 1.10 (0.93, 1.29) | |
| Menopausal status | .48 | ||
| Premenopausal | 175/174 | 1.15 (0.89, 1.48) | |
| Postmenopausal | 553/554 | 1.15 (1.01, 1.32) | |
| Body mass index | .64 | ||
| <25 kg/m2 | 183/419 | 1.09 (0.90, 1.33) | |
| ≥ 25 kg/m2 | 545/309 | 1.22 (1.04, 1.42) | |
| Family history of diabetes | .19 | ||
| No | 384/520 | 1.22 (1.05, 1.42) | |
| Yes | 344/208 | 1.11 (0.91, 1.36) |
Abbreviations: CI, confidence interval; OR, odds ratio.
OR estimates were obtained from unconditional logistic regression and correspond to diabetes risk for a 1 SD increase in the metabolite-based distress score, adjusted for matching factors, menopausal status, marital status, family history of diabetes, household income, smoking status, Alternative Healthy Eating Index, physical activity, and body mass index.
When examining fully adjusted associations with individual metabolites included in the MDS (Fig. 1), C38:3 phosphatidylcholine (PC) had the strongest association, with a 1 aSD increase in the metabolite Z-score corresponding to a 72% (95% CI: 1.46, 2.02) higher diabetes risk. Significant positive associations were also observed for gamma-aminobutyric acid (GABA), pseudouridine, tryptophan, N2, N2-dimethylguanosine, C16:0 ceramide (d18:1), and N4-acetylcytidine, with 17% to 27% increased diabetes risk for every 1 SD increase in the metabolite Z-score. Of note, despite the positive association of the MDS with diabetes risk, not all metabolites showed associations with diabetes in directions that were consistent with the direction of their coefficients weighted in the MDS. Three metabolites (namely GABA, tryptophan, and N4-acetylcytidine) had an opposite direction of associations with diabetes vs chronic distress. These 3 metabolites were negatively weighted in the MDS but associated with significantly increased diabetes risk. Of note, N4-acetylcytidine was positively associated with chronic distress in the single-metabolite model but became negatively weighted in the MDS in the multimetabolite model (ie, LASSO regression) due to a complex correlation structure with the remaining metabolites in the score (12).
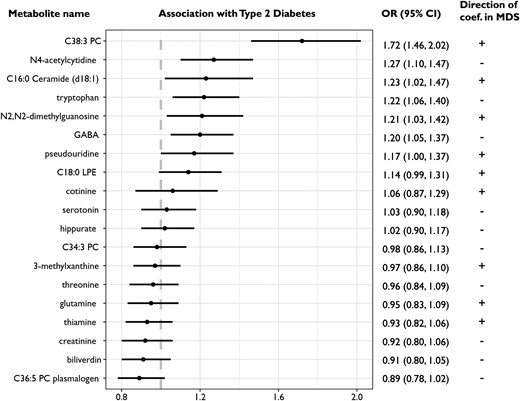
Associations between individual distress-related metabolites and diabetes risk, conditional on matching factors and adjusted for menopausal status, marital status, family history of diabetes, household income, smoking status, Alternative Healthy Eating Index, physical activity, and body mass index. The last column shows the direction of the weights used to derive the metabolite-based distress score.
Baseline phenotypic psychological distress was associated with a 32% (95% 1.01, 1.73) increased diabetes risk in the base model accounting for matching factors, menopausal status, marital status, family history of diabetes, and household income (Table 4). Adjusting for the MDS accounted for 17.6% (P = .04) of the association between baseline psychological distress and diabetes risk, higher than adjustment of lifestyle factors except for BMI (% explained: 2.8; P = .33). However, adding continuous BMI to the base model accounted for 63.7% (P = .004) of the association between phenotypic psychological distress and diabetes risk.
The roles of the MDS compared with health behaviors and BMI in the associations between phenotypic measured psychological distress and diabetes riska
| OR (95% CI) | % explained (P-value) | |
|---|---|---|
| Base modelb | 1.32 (1.01, 1.73) | — |
| Base model + MDS | 1.26 (0.96, 1.67) | 17.6% (P = .04) |
| Base model + health behaviorsc | 1.31 (1.00, 1.73) | 2.8% (P = .33) |
| Base model + BMI | 1.11 (0.82, 1.51) | 63.7% (P = .004) |
| OR (95% CI) | % explained (P-value) | |
|---|---|---|
| Base modelb | 1.32 (1.01, 1.73) | — |
| Base model + MDS | 1.26 (0.96, 1.67) | 17.6% (P = .04) |
| Base model + health behaviorsc | 1.31 (1.00, 1.73) | 2.8% (P = .33) |
| Base model + BMI | 1.11 (0.82, 1.51) | 63.7% (P = .004) |
Abbreviations: BMI, body mass index; CI, confidence interval; MDS, metabolite-based distress score; OR, odds ratio.
aPsychological distress was defined as the presence of probable depression, probable anxiety, or both. To ensure that distress assessment preceded diabetes onset (eg, depression-related information was collected between 1992 and 1996), incident diabetes cases diagnosed prior to 1998 was excluded, leaving 465 cases and 465 matched controls in this analysis.
bAdjusted for matching factors, menopausal status, marital status, family history of diabetes, and household income.
cIncluded smoking status, diet quality, and physical activity.
Discussion
In this nested case-control study of plasma metabolomics and diabetes risk in middle-aged women, we found that the MDS that we previously identified as a marker for psychological distress was significantly associated with incident diabetes after controlling for multiple established diabetes risk factors. This score partly explained the association between self-reported psychological distress and diabetes risk. These findings provide supporting evidence that dysregulation in certain aspects of lipid and amino acid metabolism may be an important mechanism underlying the observed association between psychological distress and subsequent diabetes risk.
The metabolomic signature of chronic distress identified in our previous investigation included a wide range of lipid and amino acid metabolites (10-12), suggesting a broad impact of chronic distress on metabolism. Chronic distress was associated with higher levels of lipid classes of PCs, lysophosphatidylethanolamines, and ceramides. These lipid-related metabolites are rich in cell membranes of the nervous system and essential for signal transduction. Prior studies suggest that depression and other forms of distress may alter the metabolism of phospholipids and ceramides that, in turn, impair downstream signaling pathways important in metabolic regulation (26-28). Chronic distress was also related to several amino acids involved in neurotransmitter homeostasis, including tryptophan, GABA, and glutamate, which play key roles in mental health (29). These metabolic alterations may collectively promote glucose intolerance, insulin resistance, and diabetes development.
Further, chronic distress may influence health behaviors that have complex and potentially bidirectional interactions with metabolomic profiles. For example, smoking, poor diet, and physical inactivity have been linked with significant differences in cotinine, lipids, and several xenobiotics (eg, hippurate) (30-32). Of note, adjustment for these behavioral factors only moderately attenuated the association between the MDS and diabetes risk, which suggests that neurohormonal or other physiological changes induced by distress may have more direct effects than these health behaviors.
It is notable how many of the distress-related metabolites included in the MDS are also implicated in diabetes development. For example, C38:3 PC, which was higher among women with chronic distress, has been positively associated with diabetes risk in multiple prospective studies (33-35) and showed the strongest association with risk of developing diabetes in our analysis. We also found that a higher level of PC 36:5 plasmalogen (inversely associated with distress) was associated with a marginally reduced risk of diabetes. This observation was consistent with prior evidence that plasmalogen deficiency may disturb neurotransmitter turnover, increase oxidative stress, and promote cardiometabolic disease risk (36, 37). Biliverdin, a bile pigment inversely associated with phenotypic measures of psychological distress in our prior work, and its reduction product bilirubin act as potent antioxidants that may be beneficial for insulin sensitivity and glucose homeostasis (38). Although the inverse association between biliverdin and diabetes risk was not statistically significant in the current study, a Mendelian randomization analysis reported a 42% lower diabetes risk for a 1 SD increase in genetically determined bilirubin levels, supporting a potential causal relationship (39).
However, not all of the 19 metabolites in our MDS exhibited directions of association with diabetes that would suggest they contribute to higher risk of diabetes resulting from exposure to higher psychological distress. Specifically, tryptophan, GABA, and N4-acetylcytidine were negatively weighted in the MDS but positively associated with diabetes risk in our analysis. Of note, the positive association between tryptophan and diabetes risk was also observed in other prospective studies (40, 41). This may be explained by the diverse downstream metabolic products and functions related to the metabolite. For example, in addition to conversion to serotonin and melatonin, more than 90% of tryptophan is degraded into kynurenine. The activity of the kynurenine pathway is enhanced in the presence of proinflammatory cytokines (eg, IL-1) or stress hormones (eg, cortisol) (42). Thus, chronic distress may increase kynurenine production while reducing serotonin production from tryptophan. Further, tryptophan can be metabolized by the gut microbiome, and circulating levels of the 2 tryptophan microbial metabolites—indolelactate and indolepropionate—were reported to have opposite associations with diabetes risk in a meta-analysis (35). Taken together, not only the tryptophan level but also the dynamic balance between tryptophan and its various downstream metabolites will need to be characterized in future studies to understand the role of tryptophan in both chronic distress and diabetes development. This notion is also supported by the observation for N4-acetylcytidine, which was positively associated with chronic distress in the single-metabolite model but had a negative coefficient in the multimetabolite model for deriving the MDS due to a complex correlation structure with the other metabolites in the score (12). More generally, while we might expect many of the metabolites linked to chronic distress would also be linked with diabetes risk in the expected directions based on prior observational evidence, we would also expect some metabolites linked to chronic distress that are either unrelated to diabetes risk or unrelated to directions suggesting higher risk; in some ways, this provides reassurance that the MDS is indeed unique and separate from disease-related scores [eg, tryptophan was inversely associated with risk of coronary heart disease in our prior investigation (12)].
Strengths of this study included a rigorous nested case-control design, large sample size for a metabolomics study, validated metabolomics platforms, integration of psychological distress, and consideration of multiple diabetes risk factors. Our study is also subject to limitations. First, we might not have identified all metabolites potentially associated with chronic distress given our focus on predominantly White, middle-aged women. While such homogeneity improves internal consistency, our findings may have limited generalizability to men and to people of non-White race and ethnicity. For example, branched-chain amino acids (BCAAs) are the group of metabolites most robustly and positively associated with diabetes risk in previous studies (35), including the current NHS case-control sample (13). However, BCAAs were not significantly associated with chronic distress in our discovery and validation process (11), although other studies reported associations of BCAAs with major depression or anxiety disorders (43, 44). Additional studies in more diverse populations are warranted to fully depict the metabolic perturbations that may be induced by chronic psychological distress and lead to diabetes. Second, the timing of assessment of psychological distress was not strictly aligned with blood collection (eg, depression-related measures were collected several years after blood draw; Supplementary Fig. S1) (9), hence misclassification is a concern. In addition, psychological distress was determined based on assessment at 1 time point, which did not capture the time-varying nature of psychological distress and could therefore attenuate the observed association. The statistical power for evaluating the association between baseline psychological distress and diabetes risk was also limited, which did not allow evaluation of the percent of the association explained by the metabolite score after adjusting for other diabetes risk factors. Third, 1 metabolite previously associated with chronic distress was not measured in the current dataset, which may affect the performance of the distress-related metabolite score in unknown ways. Finally, the possibility of residual confounding cannot be fully ruled out given the observational nature of the study, particularly potential residual confounding by obesity considering the limitations of using BMI to measure obesity. In future work, causal methods such as Mendelian randomization should be used to further assess the relationships between psychological distress, the MDS, and diabetes.
In conclusion, a weighted score including 19 plasma metabolites we previously identified as linked with chronic psychological distress was significantly associated with a higher risk of developing diabetes in middle-aged women over 16 years of follow-up, after accounting for traditional diabetes risk factors. Our study has implications regarding potential metabolic mechanisms linking chronic psychological distress with diabetes development. If confirmed in other populations, together with prior work on interventions (45, 46), our results may suggest that targeted interventions to reduce psychological distress and improve metabolic profiles (eg, meditation) may help mitigate diabetes risk among individuals experiencing chronic psychological distress.
Acknowledgments
We thank the participants and the staff of the Nurses' Health Study for their valuable contributions. This study is supported by the National Institutes of Health Grants UM1CA186107, R01CA49449, R01AG051600, R01DK112940 and K01HL143034. The content is solely the responsibility of the authors and does not necessarily represent the official views of the National Institutes of Health.
Disclosures
The authors have nothing to declare.
Data Availability
Some or all datasets generated during and/or analyzed during the current study are not publicly available but are available from the corresponding author on reasonable request.
References
Abbreviations
- AHEI
Alternative Healthy Eating Index
- BMI
body mass index
- CCI
Crown-Crisp Phobic Anxiety Index
- GABA
gamma-aminobutyric acid
- LPE
lysophosphatidylethanolamine
- MDS
metabolite-based distress score
- MHI
Mental Health Index
- NHS
Nurses' Health Study
- PC
phosphatidylcholine
- WHI
Women’s Health Initiative
Author notes
Laura D. Kubzansky and Susan E. Hankinson Equal contribution.
