


Abstract
In 2005, a nationwide program of iodine prophylaxis on a voluntary basis was implemented in Italy by law. However, recent data on iodine status are lacking.
The aim of this study was to evaluate efficiency, effectiveness, and possible adverse effects (increased occurrence of thyroid autoimmunity and hyperthyroidism) of the Italian iodine prophylaxis program.
From 2015 to 2019, a nationwide survey was performed. The use of iodized salt was evaluated in a sample of 164 593 adults and in 998 school canteens. A sample of 4233 schoolchildren (aged 11-13 years) was recruited to assess urinary iodine concentration, prevalence of goiter, and thyroid hypoechogenicity on ultrasound, with the latter being an indirect indicator of thyroid autoimmunity. Neonatal TSH values of 197 677 infants screened in regions representative of Northern, Central, and Southern Italy were analyzed to investigate the percentage of TSH values >5.0 mIU/L. Data on methimazole prescriptions were analyzed as indirect indicators of new cases of hyperthyroidism.
The prevalence of the use of iodized salt was 71.5% in adult population and 78% in school canteens. A median urinary iodine concentration of 124 μg/L, a prevalence of goiter of 2.2%, and a prevalence of thyroid hypoechogenicity of 5.7% were observed in schoolchildren. The percentage of neonatal TSH values >5.0 mIU/L resulted still higher (5.1%) than the World Health Organization threshold of 3.0%, whereas the prescriptions of methimazole showed a reduction of 13.5%.
Fifteen years of iodine prophylaxis have led to iodine sufficiency in Italy, although there still is concern about iodine nutritional status during pregnancy.
Iodine is necessary for the synthesis of thyroid hormones, which are essential for normal growth, development, and metabolism throughout life. Nutritional iodine deficiency can lead to impaired thyroid function and goiter, impaired mental function, and is associated with spontaneous miscarriage, stillbirth, and perinatal mortality (1-3).
Despite progress made on eradicating iodine deficiency in the last decades, in Europe and worldwide, iodine deficiency disorders (IDD) are still prevalent. Based on the most recent Iodine Global Network scorecard, 118 countries are classified as having optimal iodine nutrition, whereas 21 countries are still classified as iodine deficient (4). It is worth noting that the iodine intake in several countries formerly classified as optimal has declined, which reflects the risk of program backsliding and the need for vigilance and continuous monitoring (5).
The World Health Organization (WHO) recommends salt iodization as the preferred strategy (6) to eradicate IDD. Salt iodization is safe, equitable, largely self-financing, and extremely cost-effective. It has been demonstrated that IDD prevention via mandatory iodine fortification of salt increases quality-adjusted life expectancy in a population with moderate iodine deficiency and is therefore beneficial on a population level (7). However, in addition to a favorable population benefit/harm balance, further ethical aspects such as autonomy of individuals should be considered before implementing a mandatory IDD prevention program. This is the reason why some countries, including Italy, have implemented iodine prophylaxis programs on a voluntary basis (8, 9).
In Italy, iodized salt has been available since 1972. Nevertheless, a nationwide program of iodine prophylaxis on a voluntary basis was implemented only in 2005 following the approval of Law 55/2005, which aimed at preventing endemic goiter and other IDD (10). In compliance with the law, iodine is added to coarse and table salt at 30 mg/kg in the form of potassium iodate. The availability of iodized salt in food shops and supermarkets is mandatory, whereas noniodized salt can be sold at customer request. The law also permits (but does not require) the use of iodized salt in the food industry and communal eating areas, including school canteens, and does not foresee economic sanctions in the case of noncompliance to the Law. In 2009, a nationwide program of iodine prophylaxis was implemented in our country and the Italian National Observatory for Monitoring Iodine Prophylaxis (OSNAMI) was established at the Italian National Institute of Health to periodically evaluate efficiency, effectiveness, and possible adverse events of the nationwide program of iodine prophylaxis. Twenty regional and interregional observatories for goiter prevention take part in OSNAMI (11).
The first OSNAMI survey conducted in the Italian schoolchildren a few years after the approval of the law collected regional data (2007-2012). A median urinary iodine concentration (UIC) indicative of iodine sufficiency was found only in 3 (Liguria, Tuscany, Sicily) of the 9 studied regions (Piedmont, Lombardy, Veneto, Molise, Apulia, and Calabria were iodine deficient), whereas the prevalence of goiter (range, 6%-9%) was higher than the threshold of 5% (6) in the 6 regions providing data on thyroid ultrasound (ie, Liguria, Emilia Romagna, Marche, Tuscany, Calabria, and Sicily). Another finding from this first survey was that iodine deficiency was more prevalent in rural than in urban areas (12).
Based on these results, the General Directorate of Food Safety and Nutrition at the Ministry of Health together with a panel of OSNAMI experts at the Italian National Institute of Health decided to intensify nationwide informative campaigns on the use of iodized salt. According to the nationwide strategy of reducing sodium intake in the population, the slogan “less salt but iodized” was promoted.
From 2015 to 2019, a nationwide survey to evaluate 15 years of the Italian iodine prophylaxis program was conducted by OSNAMI as part of a periodic monitoring program in compliance with the current national regulation (Atto d’Intesa Stato Regioni 26.02.2009). The aim of the survey was to evaluate efficiency (the iodine intake in the population), effectiveness (the reduction of conditions related to iodine deficiency), and possible adverse effects (increased occurrence of thyroid autoimmunity and hyperthyroidism) of the nationwide iodine prophylaxis program in our country. The results of this nationwide survey are presented here.
Materials and Methods
The study was performed in collaboration with (1) the Italian Surveillance System Progressi delle Aziende Sanitarie per la Salute in Italia (PASSI) (13) to evaluate the consumption of iodized salt in the population, (2) the Regional Observatories for Prevention of Goiter for collecting data on schoolchildren, (3) the Italian regional or interregional laboratories for newborn screening of congenital hypothyroidism to evaluate the frequency of high values of neonatal TSH during the first days of life, and (4) the Italian Observatory on the Use of Medicines Database to evaluate prescriptions of methimazole as indirect indicator of new cases of hyperthyroidism.
Use of Iodized Salt in the Population
Household use of iodized salt
The evaluation of the household use of iodized salt was carried out in collaboration with PASSI. This population-based surveillance system monitors a wide range of health-related behaviors, physical and psychological health, and social conditions of adults (aged 18-69 years) residing in Italy. The aim of PASSI is to inform decision makers on priorities for national health policies concerning prevention and health promotion strategies (14). PASSI is an ongoing cross-sectional survey engaging in continuous data collection with approximately 30 000 adults each year. It is centrally coordinated by the Italian National Institute of Health but the data collection occurs at the Local Health Units (LHUs). These are public bodies responsible for managing preventive and health care services in each region. Specially trained personnel from the public health departments of each LHU administer a multithematic questionnaire during telephone interviews to age- and gender-representative samples of the resident population in Italy. Data provided by LHUs are merged and analyzed to obtain national and regional estimates. Detailed information on the PASSI sampling methodology and results can be found elsewhere (15, 16). In 2015, PASSI started collecting information on people's attention to the amount of salt consumed and the medical advice they received on this issue. In particular, the introduction of a question on the use of iodized salt allowed us to estimate the proportion of people reporting its use (always, often, sometimes) in preparing meals at home. In the present study, we used the PASSI 2015 through 2019 datasets for a total of 164 593 interviews collected in all Italian regions and autonomous provinces of Trento and Bolzano in more than 90% of Italian LHUs, covering more than 90% of the adult population residing in Italy. Annual response rates were always approximately 81%.
Use of iodized salt in school canteens
The use of iodized salt in school canteens was investigated in collaboration with the General Directorate of Food Safety and Nutrition at the Ministry of Health, which periodically collects data provided by Food Hygiene and Nutrition Services (SIANs) of LHUs on the quality of foods in school canteens. Available data referred to 2017, during which inspections of school canteens were performed by physicians of the SIANs in 5 regions located in the Northern (Piedmont region and Bolzano autonomous province), Central (Tuscany region), and Southern Italy (Campania, Sicily, and Sardinia) regions.
Cross-sectional Survey of Schoolchildren
Subjects
In this study, 4233 schoolchildren (2215 boys and 2018 girls) aged 11 to 13 years were recruited. The schoolchildren attended public schools and resided in 10 regions representative of Northern (Liguria, Veneto, Emilia-Romagna regions), Central (Tuscany, Umbria, Marche, Lazio regions), and Southern Italy (Molise, Calabria, Sicily regions) (Fig. 1). The schools were randomly selected and a meeting in each school was arranged with the school board members and the schoolchildren to explain the aim of the study. After approval, a letter with the informed consent form attached was sent to the parents. The median number of schoolchildren recruited per region was 438 (first quartile, Q1 = 340; third quartile, Q3 = 481). In addition, to evaluate possible differences in iodine nutritional status between urban and rural areas, 2211 (52.2%) children were recruited in urban areas and 2022 (47.8%) in rural areas (Table 1). The iodine nutritional status was defined according to the WHO median UIC criteria (6). Children reporting a chronic disease or the use of chronic medications were not included in the study. A questionnaire was administered to the schoolchildren's parents to collect information on the use of iodized salt.
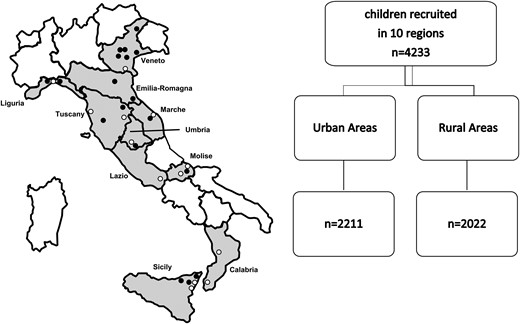
Italian regions participating in the cross-sectional survey in schoolchildren (aged 11-13 years). The closed circles indicate the location where the survey was conducted (white circles, urban areas; black circles, rural areas).
Study cohort characteristics of schoolchildren residing in urban and rural areas
| Total | Urban areas | Rural areas | |
|---|---|---|---|
| Number of children | 4233 | 2211 | 2022 |
| Boys Number (%) | 2215 (52.3%) | 1163 (52.6%) | 1052 (52.0%) |
| Age, y (mean ± SD) | 12.13 ± 0.81 | 12.12 ± 0.83 | 12.15 ± 0.77 |
| Age, 11 y number (%) | 1129 (26.7%) | 653 (29.5%) | 476* (23.6%) |
| Age, 12 y number (%) | 1411 (33.3%) | 648 (29.3%) | 763 (37.7%) |
| Age, 13 y number (%) | 1693 (40.0%) | 910 (41.2%) | 783 (38.7%) |
| Weight, (kg) mean ± SD | 50.66 ± 12.77 | 51.12 ± 12.54 | 50.14 ± 13.03 |
| Height, (cm) mean ± SD | 156.3 ± 9.1 | 156.8 ± 8.9 | 155.7 ± 9.2 |
| Children with adequate weight, number (%) | 2491 (76.6%) | 1324 (76.6%) | 1167 (76.7%) |
| Children with overweight, number (%) | 529 (16.3%) | 289 (16.7%) | 240 (15.8%) |
| Children with obesity, number (%) | 231 (7.1%) | 116 (6.7%) | 115 (7.6%) |
*Rural vs urban, P < .001.
Body weight (kg) and height (cm) were measured in the children. Body mass index (BMI), expressed as kg/m2, was calculated with the formula: BMI = weight (kg)/height2 (m). As suggested by the Italian Society of Pediatric Endocrinology and Diabetology, the classification of overweight and obesity was performed on the thresholds identified as centiles corresponding to the 75th and 95th percentiles of Italian Society of Pediatric Endocrinology and Diabetology charts, respectively (17). No underweight children, identified as children with BMI lower than the 5th percentile, were found in the sample. Therefore, the recruited children were classified as adequate weight (AW), overweight (OW), or obese (OB) children.
Urinary iodine concentration
Morning spot urinary samples were collected and stored at −80 °C until assessment. UIC was measured in 2 laboratories by using inductively coupled plasma mass spectrometry (ICP-MS). An Agilent 7900 ICP-MS Spectrometer was used at the Chemical and Endocrinology Laboratory, Center for Mass Spectrometry of the University of Pisa, Italy, whereas a Perkin Elmer Elan DRC II was used at the Chemical Food Safety Unit of the Italian National Institute of Health, Rome, Italy. The instruments were optimized to obtain comparable performances. All samples were analyzed using a 10× dilution into a medium containing tetramethylammonium hydroxide (TMAH 0.01%; Sigma–Aldrich, St. Louis, MO), Triton X-100 (0.001%; Sigma–Aldrich), and butanol (1.5%; Sigma–Aldrich). Samples were centrifuged after dilution. External validation of results was provided by inclusion of the certified reference material SRM 2670a. Results were expressed as μg/L.
Thyroid ultrasonography
Thyroid ultrasonography (US) examinations were performed by qualified physicians trained in performing neck US in children (1 per region). A 6- to 18-MHz linear transducer (LA 435) was used. Before starting the study, the operators participated in a calibration exercise to minimize interobserver variation. The thyroid volume (TV) was calculated according to Brunn et al (18). The volume of each lobe was calculated by applying the formula: TV (mL) = 0.479 × depth × width × length (cm). The total volume of thyroid gland was calculated by the sum of the volumes of both lobes (excluded isthmus) and expressed in milliliters.
To accurately estimate the prevalence of goiter in Italian schoolchildren, we used country-related and age-/BMI-specific reference values of previously estimated TV (19).
The echogenicity of the thyroid was determined using a visual analysis based on a gray scale. It consisted of comparing the parenchyma of the gland with adjacent structures and classifying them into 1 of 2 categories:
Normal echogenicity: echogenicity similar or slightly hypoechoic when compared with the submandibular gland, but hyperechoic compared with cervical muscles.
Hypoechogenicity: moderately or markedly hypoechoic when compared with the submandibular gland or with similar echogenicity of the cervical muscles.
Thyroid hypoechogenicity was ascertained when thyroid was found moderately or markedly hypoechoic on US according with the classification of thyroid echogenicity.
Because performing nonclinically indicated thyroid US raises ethical and clinical issues, in the informed consent signed by participants’ parents or tutors, it was specifically stated that parents/tutors and their family doctors would have been promptly informed about abnormal/suspicious US findings, if any, and specialist support would have been offered on request.
Neonatal TSH at Screening
The WHO has proposed that, in countries where a nationwide program of newborn screening for congenital hypothyroidism is active, a prevalence of less than 3.0% of TSH concentrations >5.0 mIU/L in samples collected 3 to 4 days after birth can be used to assess iodine sufficiency in a newborn population (6).
In Italy, a nationwide mandatory program of neonatal screening for congenital hypothyroidism was established in 1992 (20). Currently, 16 regional and interregional screening laboratories using blood spot TSH measurement as primary screening test are active in our country. Between 2015 and 2019, data on blood TSH at screening collected in 5 regions (Lombardy, Marche, Calabria, Emilia-Romagna, and Veneto), representative of Northern, Central, and Southern Italy, were analyzed to monitor the iodine nutritional status in newborns. In this period, the 5 screening laboratories used GSP neonatal hTSH kit on the GSP platform (PerkinElmer, Turku, Finland). According to the manufacturer's product insert, the analytical sensitivity of the GSP neonatal TSH assay was 1.31 mIU/L.
Information on gestational age (weeks), admission to neonatal intensive care unit, and type of delivery (cesarean section/vaginal delivery) was collected in all the screened newborns.
Prescriptions of Methimazole
Data on methimazole consumption (carbimazole is not permitted in Italy) were retrieved from the National Observatory on the Use of Medicines Database. This database, which is coordinated by the Italian Medicines Agency, collects data on medications dispensed by community pharmacies and reimbursed by the Italian National Health Care Service, as well as data provided directly from health facilities (excluding in-hospital). Information on each drug package was tracked via unique identifier codes based on the 5th-level Anatomical Therapeutic Chemical (ATC) classification (21). According to this classification, all methimazole prescriptions (ATC H03BB02 and H03BB52 in association with dibromotyrosine) dispensed during the study period were identified.
Drug consumption can be expressed in cost, number of units, number of prescriptions, or the physical quantity of drugs. However, these variables can vary between regions and countries over time, limiting comparisons. To tackle this issue, a technical unit of measurement referred to as daily defined dose (DDD) was developed for use in drug utilization studies (22). It is defined as the assumed average maintenance dose per day for a drug used for its main indication in adults. DDDs are only assigned for medicines given an ATC code and are allocated to drugs by the WHO Collaborating Centre in Oslo, working in close association with the WHO International Working Group on Drug Statistics Methodology (22).
The DDD is a unit of measurement and does not necessarily correspond to the recommended or prescribed daily dose. Therapeutic doses for individual patients and patient groups will often differ from the DDD because they are based on individual characteristics such as age, weight, ethnic differences, type and severity of disease, and pharmacokinetic considerations. Therefore, drug utilization data presented in DDDs give a rough estimate of consumption and not an exact picture of actual use. DDDs provide a fixed unit of measurement independent of price, currencies, package size, and route of administration. By applying DDD, it is possible to examine changes in drug utilization over time, make international comparisons, and follow the changes in the use of a class of drugs (22).
In this study, the mean number of DDDs/1000 inhabitants per day was calculated by dividing the total number of DDDs of methimazole dispensed during the study period in Italy and the total number of adult inhabitants (individuals registered by the Italian National Institute of Statistics in the same period) (23). The result was then divided by 365 and reported per thousand inhabitants.
Statistical Analyses
In the PASSI surveillance, a time-series analysis of monthly data on regular use on iodized salt was performed to verify temporal changes at national level and by geographic areas from 2015 to 2019. To obtain more precise estimates, data collected in the past 4 years of the period of observation (2016-2019) were used to perform univariate and multivariate analyses. Specifically, the 2016 to 2019 average annual prevalence of iodized salt use was calculated overall and according to the socioeconomic and demographic characteristics of the respondents to estimate the prevalence of iodized salt use in different population subgroups. A regression analysis was performed to evaluate the association between iodized salt use and socioeconomic and demographic characteristics. The sociodemographic characteristics included in the analyses were age (18-34 years; 35-49 years; 50-64 years), gender, educational attainment (low: none or primary school; intermediate: junior school; high: high school or university), economic difficulties (many or some or no difficulties in managing monthly income), area of residence (North; Central; South Islands of Italy), and nationality (Italian or foreign). Complex survey design analyses, using the Taylor series method for variance estimation, were conducted with Stata 16 software (StataCorp LP). Prevalence estimates were weighted, assigning each recording with a probability weight equal to the inverse of the sampling fraction in each LHU stratum to produce nationally representative estimates. Adjusted prevalent ratio (adjPR) with 95% CI were calculated using the Poisson regression with robust variance and hypothesis testing (24) and including all the aforementioned sociodemographic characteristics.
In the cross-sectional survey of schoolchildren, continuous variables were expressed as the mean ± SD or median (Q1, Q3), as appropriate. Descriptive analyses were conducted on the collected data and both parametric and nonparametric tests were applied for univariate data analysis (median test, t test, χ2 test). Before statistical testing, thyroid volume data were log-transformed to normalize the skewed distribution. Differences in median UIC and in thyroid echogenicity between groups were evaluated by quantile regression and logistic regression, respectively, considering age, sex, BMI, and area of residence (rural/urban) as covariates. Statistical analyses were conducted using Intercooled STATA for Windows (version 16.0; StataCorp, College Station, TX). A P value <.05 was considered significant.
Results
Efficiency of the Iodine Prophylaxis Program
Use of iodized salt in adult population (PASSI data)
The time-series analysis for the entire period of observation (2015-2019) showed a significant increase in iodized salt use among adults residing in Italy (67% in 2015 vs 74% in 2019; P < .01). The multivariate analyses showed a geographical gradient from Northern (higher use) to Southern Italy (lower use) (Fig. 2). On average, 71.5% of respondents reported using iodized salt (41.5% reported always, 12.0% often, and 18.1% sometimes), 25.1% reported never having used iodized salt and 3.4% claimed not to know it. The use of iodized salt resulted significantly higher in women than in men (75% vs 68%; adjPR = 1.12; 95% CI, 1.11-1.13), in individuals without economic difficulties than in those reporting some or many economic difficulties (75% vs 63%; adjPR =1.10; 95% CI, 1.08-1.12), in those who graduated from university than in those with any or primary school education (76% vs 61%; adjPR = 1.20; 95% CI, 1.16-1.24), in subjects residing in Northern than in Southern Italy (76% vs 67%; adjPR = 1.11; 95% CI, 1.10-1.12). Nationality also affected the use of iodized salt, which was less frequent among foreign than Italian citizens (61% vs 72%, adjPR = 0.85; 95% CI, .83-.87). The use of iodized salt was also assessed among pregnant and lactating women as well as during childhood (the latter by considering the use among adults living with children aged 0-14 years). The use of iodized salt was reported by 75% of pregnant women (estimated from a sample of 881 pregnant women), 73% of breastfeeding women (from a sample of 1002 breastfeeding women), and 73% of adults living with children aged 0 to 14 years (from a sample of 28 967 adults living with children aged 0-14 years).
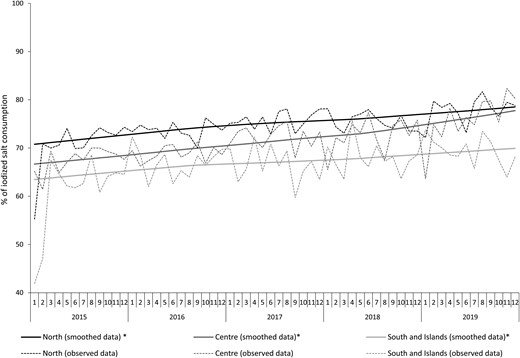
Trend of iodized salt consumption in the population by area of residence from 2015 through 2019. Monthly prevalence observed and estimated from time series models. LOWESS, locally weighted scanner plot smoothing.
Use of iodized salt in school canteens
In 2017, 998 school canteens were inspected by physicians of the SIANs in 5 regions (Piedmont, Tuscany, Campania, Sicily, Sardinia) and in the autonomous province of Bolzano. In this province, a successful local program of iodine prophylaxis on voluntary basis is active since 1982. Overall, iodized salt was used in 78% of the inspected canteens (778/998). The prevalence of school canteens using iodized salt was ≥ 90% in Bolzano province (94%), as well in Sicily (97%) and Tuscany (90%) regions; whereas in Piedmont, Campania, and Sardinia regions, the percentage ranged from 65% to 72%.
Use of iodized salt and UIC in schoolchildren
The characteristics of the recruited children stratified by area of residence (urban/rural) are shown in Table 1. Although no significant difference was observed in the mean age between the 2 groups, the frequency of children aged 11 years was significantly higher in urban than in rural areas (29.5% vs 23.6%; χ2 = 19.39; P < .001). When BMI was analyzed, the frequency of AW, OW, and OB children was similar in both groups (Table 1). Data of the questionnaire on the household use of iodized salt were available in 3626 of the 4233 schoolchildren (85.7%). In 2015, 55.8% (980/1755) of the respondents claimed to use iodized salt, with no significant difference between urban (54.6%; 641/1173) and rural areas (58.2%; 339/582) (χ2 test). Nevertheless, when the period from 2016 to 2019 was considered, the percentage increased to 74.9%, a value overlapping that obtained in the larger PASSI surveillance for the same period (71.5%). Furthermore, no significant difference between urban (74.3%, 563/758) and rural areas (75.5%, 840/1113) was observed in this period.
UIC was measured in 3510 of the 4233 recruited schoolchildren. Specifically, morning spot urinary samples were collected in 1851 children residing in urban areas and in 1659 residing in rural areas. Overall, a median UIC of 124 μg/L (Q1, Q3 = 77, 188) was found, suggesting the achievement of iodine sufficiency in our country. In addition, when the schoolchildren were stratified according to the use of iodized salt in households, a significant higher median UIC was observed in schoolchildren living in households that used iodized salt in comparison with those living in households that did not use it (138 μg/L [Q1, Q3 = 85, 199] vs 111 μg/L [Q1, Q3 = 68, 174]; median test, P < .001). Despite the significant difference, both values were indicative of iodine sufficiency according with the use of iodized salt in school canteens of the schools taking part in the study.
Although median UIC was > 100 μg/L in both areas of residence, after taking into account age, sex, and BMI, UIC was significantly higher (quantile regression, P = .01) in rural than in urban areas (Table 2). However, the percentage of children with UIC < 50 μg/L was similar both in rural and urban areas (9.9% and 11.9%, respectively).
Urinary iodine concentration, thyroid volume, and prevalence of goiter and nodules in schoolchildren stratified by urban and rural areas
| Area of residence | ||||
|---|---|---|---|---|
| Total | Urban areas | Rural areas | *P value | |
| UIC (µg/L), number | 3510 | 1851 | 1659 | |
| Median (Q1, Q3) | 124 (77, 188) | 119 (72, 180) | 129 (82, 196) | 0.01a |
| Percentage of low UIC (< 50 µg/L) | 11.0% | 11.9% | 9.9% | .42b |
| Thyroid volume (mL), number | n = 3430 | n = 1819 | n = 1611 | |
| Mean ± SD | 5.45 ± 2.16 | 5.48 ± 2.15 | 5.41 ± 2.18 | .31c |
| Prevalence of goiter | 2.2% | 1.9% | 2.6% | .18b |
| Prevalence of children with nodules | 2.0% | 2.1% | 1.9% | .85b |
Abbreviations: BMI, body mass index; Q1, first quartile; Q3, third quartile; UIC, urinary iodine concentration.
*Urban vs rural areas.
aQuantile regression considering age, sex, and BMI as covariates.
bLogistic regression considering age, sex, and BMI as covariates.
cLinear regression on log-transformed data considering age, sex, and BMI as covariates.
UIC values were also stratified by BMI categories. This analysis showed that median UIC values were indicative of iodine sufficiency in all the BMI categories (Table 3). However, after considering age, sex, and area of residence (urban/rural), UIC was significantly higher in AW children than in OW children (quantile regression, P = .02), whereas no difference was observed between AW and OB children.
Urinary iodine concentration, thyroid volume, prevalence of goiter and nodules in schoolchildren stratified by BMI categories (AW OW, OB)
| BMI categories | ||||
|---|---|---|---|---|
| AW | OW | OB | P value | |
| UIC (µg/L), number | 2122 | 432 | 180 | .02, OW vs AWa |
| Median (Q1, Q3) | 126 (77, 192) | 112 (67, 185) | 117 (71, 165) | .23, OB vs AW |
| Percentage of low UIC (<50 µg/L) | 11.5% | 11.8% | 10.6% | .95, OW vs AWb .84, OB vs AW |
| Thyroid volume (mL), number | 2488 | 528 | 231 | <.001, OW vs AWc |
| Mean ± SD | 5.21 ± 2.04 | 5.67 ± 2.05 | 6.43 ± 2.73 | <.001, OB vs AW |
| Prevalence of goiter | 2.5% | 2.1% | 0.9% | .63, OW vs AWb .13, OB vs AW |
| Prevalence of children with nodules | 2.2% | 1.7% | 0.9% | .48, OW vs AWb .22, OB vs AW |
Abbreviations: AW, adequate weight; OB, obese; OW, overweight; Q1, first quartile; Q3, third quartile; UIC, urinary iodine concentration.
aQuantile regression considering age, sex, and area of residence (rural/urban) as covariates.
bLogistic regression considering age, sex, and area of residence as covariates.
cLinear regression on log-transformed data considering age, sex, and area of residence as covariates.
Effectiveness of the Iodine Prophylaxis Program
Thyroid volume and prevalence of goiter and nodules in schoolchildren
Thyroid US was performed in 3430 children (n = 1819 in urban areas; n = 1611 in rural areas). Overall, the mean TV in schoolchildren was 5.45 ± 2.16 mL (Table 2). After adjusting by age, sex, and BMI in a multivariate regression model, the comparison of TV between urban (5.48 ± 2.15 mL) and rural areas (5.41 ± 2.18 mL) did not show a significant difference (Table 2). When thyroid volume was compared among BMI categories, it resulted to be significantly higher in OB than in OW (6.43 ± 2.73 mL and 5.67 ± 2.05 mL, P < .001) and AW children (5.21 ± 2.04 mL, P < .001) after adjusting by age, sex, and area of residence (urban/rural) (Table 3).
The prevalence of goiter in schoolchildren was estimated by using country-related and age-/BMI-specific reference values of previously calculated TV (19) and differences in proportions were compared using a logistic model. This analysis showed an overall prevalence of goiter of 2.2% with no significant difference between urban and rural areas (1.9% and 2.6%, respectively) (Table 2), as well as among BMI categories (AW = 2.5%; OW = 2.1%; OB = .9%) (Table 3).
The prevalence of thyroid lesions found on US (solid or cystic nodules, all <10 mm) was 2.0% with no significant difference between urban (2.1%) and rural areas (1.9%) (Table 2). Also, the comparison among BMI categories did not show a significant difference (AW = 2.2%; OW = 1.7%; OB = 0.9%; logistic model) (Table 3). Unfortunately, data on the specialistic evaluation and how these lesions were treated are not available.
Neonatal TSH at newborn screening
To investigate the percentage of blood TSH values >5.0 mIU/L, infants screened between the third and the fourth day of life (birth = day 0) in 5 regions representative of Northern, Central, and Southern Italy were analyzed. Up to 2015, blood spot collection was performed at 3 to 5 days of life in our country, in compliance with the law that in 1992 established the mandatory newborn screening program for congenital hypothyroidism (Law 104/1992). Nevertheless, in 2016, another law (Law 167/2016) introduced the expanded newborn screening for 48 metabolic diseases and anticipated the sample collection at 48 to 72 hours of life. Since 2016, this earlier window of time for blood spot collection was progressively adopted in all Italian regions with a consequent drop of samples collected at 3 to 4 days of life. For this reason and to make our estimates more robust, after 2015, TSH values were pooled into 2 periods: 2016 through 2017 and 2018 through 2019. In addition, preterm infants (<37 weeks’ gestation) and infants admitted to a neonatal intensive care unit were excluded from the analysis because of the high risk of delayed rise of TSH (25, 26).
According to exclusion criteria, 197 677 neonatal TSH values were analyzed (89 538 in 2015; 95 458 in 2016-2017; 12 681 in 2018-2019). The analysis of data showed that, since 2005, the frequency of TSH > 5.0 mIU/L had been steadily decreasing, although it was still higher than the threshold of 3.0% even in the period 2015 through 2019 (range, 5.9%-5.1%) (Fig. 3), indicating a still insufficient maternal iodine nutrition during pregnancy in our country. It is worth noting that when data were stratified by type of delivery (variable available from 2016), the percentage of TSH values >5.0 mIU/L was higher in infants born by cesarean section (7.2% in 2016-2017; 5.4% in 2018-2019) than in those born by natural delivery (5.1% in 2016-2017; 4.3% in 2018-2019).
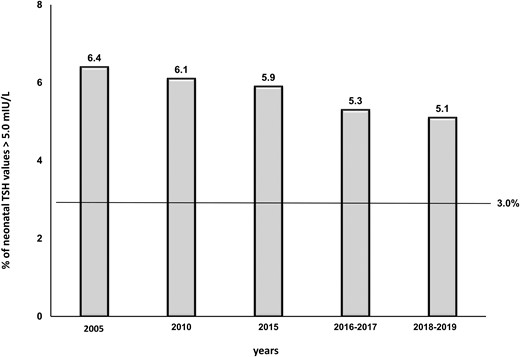
Frequency of neonatal TSH values >5.0 mIU/L at 3 to 4 days of life.
Surveillance of Adverse Events
Possible adverse events from the universal use of iodized salt were investigated by analyzing the frequency of thyroid hypoechogenicity on US in schoolchildren, as an indirect indicator of thyroid autoimmunity (27-29), and the prescriptions of the antithyroid drug methimazole, as an indirect indicator of new cases of hyperthyroidism (30).
Thyroid hypoechogenicity in schoolchildren
The analysis of thyroid hypoechoic pattern in schoolchildren showed an overall prevalence of 5.7%, with no difference between urban and rural areas (5.3% vs 6.2%; χ²=0.96; P = .327). Because of the known confounding effect of overweight and obesity on thyroid echogenicity (19, 31-33), data on thyroid hypoechoic pattern were also stratified by BMI categories. In urban areas, the prevalence of thyroid hypoechoic pattern was significantly lower in AW than in OW (4.2% vs 7.8%; χ² = 5.93; P = .015) and OB children (4.2% vs 10.0%; χ² = 7.48; P < .01), whereas in rural areas, a significant difference was found between AW and OB children (5.2% vs 16.0%; χ² = 14.20; P < .01).
Prescriptions of methimazole in adults
After the introduction of the iodine prophylaxis program, no significant increase in methimazole prescriptions was observed in our country. Specifically, the mean consumption of methimazole was 1.59 DDDs/1000 inhabitants per day in the first years after the introduction of the iodine prophylaxis program (2005-2007) and 1.37 DDDs/1000 inhabitants per day in the last 2 years of observation (2017-2019), with an overall reduction of 13.5% at the national level (Fig. 4).

Trend of methimazole prescriptions in Italy, from 2005 through 2019. DDDs, defined daily doses.
Discussion
Fifteen years of iodine prophylaxis on voluntary basis have significantly improved iodine nutrition in the population leading to iodine sufficiency in our country. A nationwide survey conducted by the Italian Institute of Statistics in 2003 and 2005 showed that iodized salt was used by 26.9% and 29.2% of households, respectively (34). Since then, the use of iodized salt is steadily increasing. The percentage of household use increased from 67% in 2015 to 74% in 2019, rising to 78% in 2021, according to the more recent PASSI estimates (35). Despite this relevant finding, our study highlights the presence of a geographical North-South gradient with a more frequent use in Northern (76%) than in Southern Italy (67%). This gradient may be explained at least in part by the socioeconomic gap existing between these 2 macro areas. Studies on the potential association of socioeconomic status with iodine supply have reported that socioeconomic status particularly impacts the efficiency of iodine prophylaxis programs on voluntary basis and that higher socioeconomic status and education are associated with a higher iodine intake (36-38). Our results confirm these observations. A less frequent use of iodized salt was observed either in subjects with economic difficulties or in those with lower education. Nevertheless, based on the multivariate analysis that controls by socioeconomic differences, a broader role of living in the South of Italy cannot be excluded. Taken together, these data suggest that further efforts should be done to carry out new nationwide informative campaigns explaining the benefit of iodized salt, especially in Southern Italy. It is also important to convince salt producers to reduce the price of iodized salt, which in Italy is still higher than that of noniodized salt.
This study also shows that women use iodized salt more frequently than men (75% and 68%, respectively). This finding is particularly relevant for women of reproductive age, because of the important role played by iodine during development. In this regard, in the period of observation, 75% of pregnant women and 73% of breastfeeding mothers used iodized salt. Unfortunately, no information on the use of iodine-containing supplements and UIC during pregnancy was collected. However, a multicenter study on 4000 pregnant women residing in 8 Italian regions is currently ongoing with the aim of investigating the relationship between maternal iodine nutrition during pregnancy and neonatal thyroid function. Waiting for the results of the multicenter study, the high percentage of pregnant and breastfeeding women using iodized salt observed in this survey seem to be consistent with the percentage of neonatal TSH values >5.0 mIU/L that, although still higher than the threshold of 3.0%, has been steadily decreasing since the introduction of iodine prophylaxis in our country. In infants of mothers with low iodine intake, TSH concentrations are increased for the first few weeks of life (39). Therefore, neonatal TSH has been considered a sensitive marker of iodine status in the neonatal period (6). Nevertheless, in the past decade, some doubts have been raised on the sensitivity of neonatal TSH in reflecting iodine status in the population because of the many confounding factors affecting this biomarker (40). In this regard. it is important to consider that the WHO threshold of 3.0% was set up many years ago when neonatal blood samples were usually collected at 3 to 4 days of life (73-120 hours) or later (41, 42). Currently, earlier discharge from hospitals, which in some countries occurs before 3 days of life, and the introduction (in Italy as in other Western countries) of the expanded newborn screening for metabolic diseases have anticipated the age of sample collection at 48 to 72 hours of life, a window during which TSH is higher than at 3 to 4 days of life (43). Another factor to take into consideration is the effect of cesarean section on TSH at screening. It has been reported that infants delivered by cesarean section are significantly more likely to have TSH levels >5.0 mIU/L on day 3 than those delivered vaginally (44). Our results confirm this finding. In fact, in the last 2 years of observation (2018-2019), a prevalence of TSH levels >5.0 mIU/L of 5.4% in infants born by cesarean section and of 4.3% in those born by vaginal delivery was observed. With the current high rate of births by cesarean, this could be an important factor in assessing population iodine deficiency using neonatal TSH levels. Taken together, these findings seem to suggest that, because of the logarithmic inverse correlation existing between TSH and free T4 (45), neonatal TSH can be a sensitive biomarker to evaluate iodine status in newborns and indirectly in their mothers only if new age (hours)-related thresholds of neonatal TSH adjusted for type of delivery are defined.
Nationwide data on median UIC before the introduction of iodine prophylaxis are lacking. However, a review of data obtained from regional studies conducted between 1978 and 1991 in our country showed mean UIC values ranging from 50 to 75 μg/g creatinine in rural endemic areas, and 85 to 175 μg/g creatinine in urban control areas. In the same period, the prevalence of goiter in schoolchildren residing in endemic areas ranged from 14% to 73%, whereas it was 2.2% to 15% in the control urban areas (46). A study conducted a few years after the introduction of iodine prophylaxis (in 2009) on a national sample of 1270 Italian schoolchildren and adolescents (aged 6-18 years) using 24-hour urine collection showed that iodine intake was still inadequate in Italy at that time, especially in younger children (median urinary iodine excretion = 88 μg/24 hours in children aged 6.0-7.7 years; urinary iodine excretion, 93.8 μg/24 in children aged 7.8-10 years) (47). In the same period, consistently, the first survey conducted by OSNAMI (2007-2012) on 7455 schoolchildren (aged 11-13 years) residing in 9 Italian regions showed that 6 of these regions were still iodine deficient at that time (median UIC range, 48-98 μg/L). Only the Liguria, Tuscany, and Sicily regions showed iodine sufficiency (median UIC, 145 μg/L Liguria, 119 μg/L Tuscany, 160 μg/L Sicily) (12). At that time in Italy, only 43% of sold salt was iodized and the prevalence of goiter in schoolchildren was higher than the threshold value of 5% in all the examined regions (range, 6%–9%) (12).
In this survey, a median UIC of 124 μg/L was found in schoolchildren, suggesting the achievement of iodine sufficiency in our country, either in rural (129 μg/L) or urban areas (119 μg/L). The prevalence of goiter was also found low in both areas (2.6% rural areas; 1.9% urban areas). These findings are relevant and suggest that in our country there is a more homogeneous iodine status than in the past, when rural areas had more iodine deficiency than urban areas (9, 12). In addition, the finding that goiter is no more endemic in Italian schoolchildren represents an important success of the iodine prophylaxis program, which in 2009 introduced the use of iodized salt in school canteens with a special legal norm (48).
It has been reported that overweight and obesity may affect iodine nutrition (49). The positive relationship of BMI with thyroid volume and echogenicity has been largely described (19, 31-33, 50, 51), whereas the effect of overweight and obesity on UIC is still debated. In 2 studies from Mexico, where the use of iodized salt is mandatory in the food industry, a positive correlation between BMI and UIC was observed (52, 53). The authors hypothesized that the availability and excessive consumption of snack foods rich in energy, carbohydrates, fat, and iodized salt could explain the association of high iodine intake and overweight and obesity. Conversely, in another study conducted in Brazil, where the main source of salt is discretionary salt, overweight and obesity were associated with a protective effect against excessive iodine intake, although no significant correlation was found between BMI and UIC (54). In a more recent large survey conducted in Japan, where iodine sufficiency is guaranteed by a high consumption of fish and seaweed, median UIC was also found lower in overweight and obese children than in children with adequate weight (55). Our results seem to be consistent with the latter 2 studies. In fact, when BMI categories were considered in the multivariate analyses, median UIC was lower in OW than in AW children, regardless the area of residence. Available studies, however, are few and do not allow us to clarify the true impact of BMI on UIC. Further ad hoc studies are therefore necessary.
This survey also shows that the Italian nationwide program of iodine prophylaxis is safe. Some studies have shown that the increase in population iodine intake may induce enhanced thyroid autoimmunity (56-59), whereas other studies report no increase or reduction in thyroid autoimmunity following iodine salt fortification (60-63). As analyzed in a recent review by Teti et al (64), these conflicting results seem to suggest that only iodine supplementation regimens attaining long-standing relatively high median UIC levels (>200 μg/L) can induce relevant long-term alteration of thyroid function from autoimmune disease. In our survey, although no information on serum antithyroid autoantibodies was available, a low frequency of thyroid hypoechoic pattern was observed in schoolchildren (5.7%), suggesting a low occurrence of thyroid autoimmunity. Unfortunately, nationwide data on thyroid echogenicity on US obtained before the introduction of iodine prophylaxis are lacking. Only historical data obtained in the Liguria region are available. In this region, the team of operators that performed thyroid US in this survey was also involved in a previous regional survey conducted in 2007 on schoolchildren aged 11 to 13 years, which showed iodine sufficiency in that region. The comparison of data showed a similar frequency of thyroid hypoechoic pattern in both surveys (3.3%, previous survey; 2.7%, present survey) (12, 64, 65) suggesting no increase in thyroid autoimmunity after more than 10 years of iodine sufficiency.
Considering the surveillance of hyperthyroidism as a possible side effect of the increased use of iodized salt in the population (30), the analysis of data on methimazole prescriptions has shown a progressive reduction in the use of this antithyroid drug after the introduction of the nationwide program of iodine prophylaxis, indicating no increase in the occurrence of hyperthyroidism in our country. Data obtained before the introduction of iodine prophylaxis showed that the mean consumption of methimazole was 1.56 DDDs/1000 inhabitants per day from 2003 through 2004 (12), whereas it was 1.59 DDDs/1000 inhabitants per day from 2005 through 2007 and 1.37 DDDs/1000 inhabitants per day from 2017 through 2019. These findings are consistent with other studies showing a substantial reduction of overt thyrotoxicosis mostly from a nodular origin after a long-standing program of iodine prophylaxis (59, 66). In addition, a recent Italian study conducted on 283 subjects newly diagnosed with Graves’ disease demonstrated that a relevant proportion of these patients at diagnosis showed a milder clinical phenotype (subclinical hyperthyroidism, no orbitopathy or goiter) than that observed in the past, possibly because of both earlier diagnosis and treatment, and improved iodine nutrition, which is associated with a drop in goiter prevalence (67).
A limitation of this survey is that urine samples were collected over a period of 5 years; therefore, the data may not reflect potential variations in iodine intake in the country. Nevertheless, the increasing use of iodized salt observed in the population could overcome this limitation. In addition, the current iodine status might be underestimated because the most recent data on consumption of iodized salt (78% in 2021) seem to suggest a further improvement of iodine intake in the population. However, a new OSNAMI survey to monitor iodine nutrition in our country has been planned in 2024-2026.
The strength of our study is the centralization of monitoring activities and the high number of indicators used to evaluate efficiency, effectiveness, and possible side effects of iodine prophylaxis in our country.
In conclusion, the results of this survey represent an undoubted success of the Italian program of iodine prophylaxis, mostly because the data were obtained over several years of national campaigns focused on reduction of salt consumption (68-70). This important result reinforces the notion that strategies for salt reduction and salt iodization are compatible and can run parallel if the iodine content in salt is adequate. In Italy, the iodine content in salt is 30 mg per kg salt, with an allowed range of 24 to 42 mg iodine per kg salt. This iodine concentration, which is higher than in other European countries, appears currently able to compensate for the observed reduction of salt consumption in the population and appropriate to avoid an increased risk of thyroid autoimmunity and hyperthyroidism because of iodine excess.
Finally, the Italian iodine prophylaxis program has taken 15 years to be successful. Two linked factors can explain this long period: the voluntary basis of the program, which has implied that the awareness of the population on using iodized salt has developed gradually, and the scarcity of dedicated funds, which did not allow nationwide informative campaigns since the beginning of the program (in 2005), as well as more frequent monitoring activities. For the future, we are confident that the Italian Ministry of Health will do any effort to guarantee sustainability to this important program of prevention.
Acknowledgments
The authors thank Domenico Tromba, Francesca Latini, and Matilde Bocci for their technical assistance and the Comitato Associazioni Pazienti Endocrini-CAPE for continuous support.
Funding
The work was supported by funds from Ricerca Corrente of the Istituto Superiore di Sanità (cod 8AIC2) and from the Ministero della Salute (cod ISS 6M69 and 1S61) to A.O.
Disclosures
The authors have nothing to disclose.
Data Availability
Restrictions apply to the availability of all data generated or analyzed during this study to preserve patient confidentiality or because they were used under license. The corresponding author will on request detail the restrictions and any conditions under which access to some data may be provided.
References
Gazzetta Ufficiale 2005, Serie Generale n.91 del 20 Aprile 2005. Legge 21 marzo 2005, n.55. Disposizioni finalizzate alla prevenzione del gozzo endemico e di altre patologie da carenza iodica. Accessed June 1, 2023. Available at site https://www.gazzettaufficiale.it/atto/serie_generale/caricaDettaglioAtto/originario?atto.dataPubblicazioneGazzetta=2005-04-20&atto.codiceRedazionale=005G0084&elenco30giorni=false.
Osservatorio Nazionale per il Monitoraggio della Iodoprofilassi in Italia-OSNAMI. Istituto Superiore di Sanità. Accessed August 17, 2023. Available at site: www.iss.it/osnami.
EpiCentro—L'epidemiologia per la sanità pubblica. Istituto Superiore di Sanità. Progressi delle Aziende Sanitarie per la Salute in Italia. Accessed August 17, 2023. Available at site: https://www.epicentro.iss.it/passi.
Gazzetta Ufficiale—Serie Generale n. 109, 12 maggio 2017. Decreto del Presidente del Consiglio dei Ministri del 3 marzo 2017. Identificazione dei sistemi di sorveglianza e dei registri di mortalità, di tumori e di altre patologie. Accessed June 1, 2023. Available at site https://www.gazzettaufficiale.it/eli/id/2017/05/12/17A03142/sg.
Istituto Nazionale di Statistica. Demo, demografia in cifre. Accessed August 17, 2023. Available at site: https://demo.istat.it/.
Istituto Nazionale di Statistica. Italia in cifre 2011. Accessed August 17, 2023. Available at site: https://www.istat.it/it/files/2011/03/Italia-in-cifre.pdf.
EpiCentro—L'epidemiologia per la sanità pubblica. Istituto Superiore di Sanità. I dati per l’Italia, consumo di sale. Accessed August 17, 2023. Available at site: https://www.epicentro.iss.it/passi/dati/sale.
Conferenza permanente per i rapporti tra lo Stato le Regioni e le Province Autonome di Trento e Bolzano. INTESA 26 febbraio 2009. Accessed June 1, 2023. Availabe at site https://www.gazzettaufficiale.it/atto/serie_generale/caricaDettaglioAtto/originario?atto.dataPubblicazioneGazzetta=2009-03-31&atto.codiceRedazionale=09A02965&elenco30giorni=false.
Abbreviations
- adjPR
adjusted prevalent ratio
- ATC
Anatomical Therapeutic Chemical
- AW
adequate weight
- BMI
body mass index
- DDD
defined daily dose
- IDD
iodine deficiency disorders
- LHU
Local Health Unit
- OB
obese
- OSNAMI
Italian National Observatory for Monitoring Iodine Prophylaxis
- OW
overweight
- PASSI
Progressi delle Aziende Sanitarie per la Salute in Italia
- SIAN
Food Hygiene and Nutrition Services
- TV
thyroid volume
- UIC
urinary iodine concentration
- US
ultrasound
- WHO
World Health Organization
