


Abstract
Hierarchical clustering (HC) identifies subtypes of polycystic ovary syndrome (PCOS).
This work aimed to identify clinically significant subtypes in a PCOS cohort diagnosed with the Rotterdam criteria and to further characterize the distinct subtypes.
Clustering was performed using the variables body mass index (BMI), luteinizing hormone (LH), follicle-stimulating hormone, dehydroepiandrosterone sulfate, sex hormone–binding globulin (SHBG), testosterone, insulin, and glucose. Subtype characterization was performed by analyzing the variables estradiol, androstenedione, dehydroepiandrosterone, cortisol, anti-Müllerian hormone (AMH), total follicle count (TFC), lipid profile, and blood pressure. Study participants were girls and women who attended our university hospital for reproductive endocrinology screening between February 1993 and February 2021. In total, 2502 female participants of European ancestry, aged 13 to 45 years with PCOS (according to the Rotterdam criteria), were included. A subset of these (n = 1067) fulfilled the National Institutes of Health criteria (ovulatory dysfunction and hyperandrogenism). Main outcome measures included the identification of distinct PCOS subtypes using cluster analysis. Additional clinical variables associated with these subtypes were assessed.
Metabolic, reproductive, and background PCOS subtypes were identified. In addition to high LH and SHBG levels, the reproductive subtype had the highest TFC and levels of AMH (all P < .001). In addition to high BMI and insulin levels, the metabolic subtype had higher low-density lipoprotein levels and higher systolic and diastolic blood pressure (all P < .001). The background subtype had lower androstenedione levels and features of the other 2 subtypes.
Reproductive and metabolic traits not used for subtyping differed significantly in the subtypes. These findings suggest that the subtypes capture distinct PCOS causal pathways.
Polycystic ovary syndrome (PCOS) is a complex genetic disorder reflecting the interaction of susceptibility genes and environmental factors (1). It is among the most common endocrine disorders of reproductive-aged girls and women, affecting 5% to 15% of this population worldwide, depending on the diagnostic criteria applied (2-4). PCOS is characterized by the presence of 2 or more of the following features: ovulatory dysfunction (OD), hyperandrogenism (HA), and polycystic ovarian morphology (PCOM). All of the diagnostic criteria for PCOS are based on expert opinion. The first diagnostic criteria, known as the National Institutes of Health (NIH) criteria, required the presence of both OD and HA; PCOM is not included in these diagnostic criteria (5, 6). In 2003, PCOM was added as a diagnostic criterion and the diagnosis of PCOS required 2 of 3 of the following features, OD, HA, or PCOM. The application of these so-called Rotterdam criteria resulted in 4 phenotypes, which have been designated phenotype A, HA + OD + PCOM; phenotype B, HA + OD; phenotype C, HA + PCOM; and phenotype D, OD + PCOM. The phenotypes including HA + OD with or without PCOM, which do not differ biochemically, are often designated as NIH phenotype or classic PCOS. The combination of HA + PCOM and OD + PCOM are known as the non-NIH Rotterdam phenotypes. The Androgen Excess Society criteria include only the phenotypes with HA. A meta-analysis of genome-wide association study (GWAS) had adequate power to formally compare NIH PCOS, non-NIH Rotterdam PCOS, and self-reported PCOS. In this study, no significant differences were found in effect sizes across the cases stratified by phenotype for 13 of 14 PCOS-associated loci (7). These findings imply that the current diagnostic criteria do not identify biologically distinct phenotypes.
In contrast, data-driven approaches to PCOS classification using unsupervised hierarchical clustering of quantitative traits identified 3 reproducible subtypes in cases with the NIH phenotype of OD and HA (8). These subtypes were designated 1) “reproductive,” characterized by higher luteinizing hormone (LH) and sex hormone–binding globulin (SHBG) levels with relatively low body mass index (BMI) and insulin levels; 2) “metabolic,” characterized by increased glucose, and insulin levels with lower SHBG and LH levels; and 3) “background,” for the cases that demonstrated no distinguishable pattern regarding their relative phenotypic trait distributions. Each subtype was associated with unique genome-wide significant loci suggesting that the subtypes had distinct genetic architecture. Further, these significant genetic associations provided orthogonal validation that the subtypes captured biologically distinct groups.
We undertook this study to investigate whether these subtypes were present in more broadly ascertained PCOS cases using the Rotterdam criteria. Further, we investigated whether the subtypes thus identified had differences in additional PCOS-related clinical variables not used for clustering and whether the differences aligned with distinct biologic pathways.
Materials and Methods
Study Population
Girls and women of European ancestry, aged 13 to 45 years, who attended our outpatient clinic of Reproductive Endocrinology and Infertility at the Erasmus University Medical Center Rotterdam between February 1993 and February 2021, were included. Before 2003, girls and women with PCOS were diagnosed when they met the World Health Organization 2 anovulation criteria according to the World Health Organization classification in combination with PCOM or HA or both (9, 10). From 2003 to 2018, girls and women were diagnosed with PCOS using the 2003 Rotterdam criteria, and from 2018 onward, the criteria from the 2018 International Guideline for PCOS were used (11, 12). Both guidelines state that PCOS can be diagnosed when at least 2 of the following 3 features are present: OD, HA, and/or PCOM. In addition, girls and women were screened to exclude the presence of adrenal gland disorders, pituitary gland dysregulation, and/or ovarian diseases. OD was defined as oligomenorrhea (menstrual cycle <21 days, >35 days or <8 cycles per year) or amenorrhea (interval of vaginal bleeding >182 days). For adolescents, the specific adolescent criteria were used, which includes more than 1 to less than 3 years post menarche: less than 21 or more than 45 days and more than 1 year post menarche more than 90 days for 1 cycle, or primary amenorrhea by age 15 years or more than 3 years post thelarche.
Until 2018, clinical HA was defined as a Ferriman Gallwey score of 8 or greater, and from 2018 onward, clinical HA was defined as a modified Ferriman Gallwey score (mFGs) of 5 or greater (13, 14). Until August 2012, biochemical HA was diagnosed as a total serum testosterone (T) greater than 3.0 nmol/L and/or a free androgen index greater than 4.5%. Since the introduction of liquid chromatography–tandem mass spectrometry (August 2012), a free androgen index cutoff above 2.9% and/or a serum total T greater than 2.0 nmol/L has been used (15). PCOM was defined as 12 or more follicles (2-9 mm in diameter), and/or increased ovarian volume (>10 cm3) in at least 1 ovary, evaluated by using a transvaginal ultrasound of less than 8 MHz. From 2019 onward, an ultrasound of greater than 8 MHz was used, and the diagnostic cutoff values for the diagnosis of PCOM were changed to 20 or more follicles (2-9 mm in diameter), and/or increased ovarian volume (>10 cm3) in at least 1 ovary (16). Girls and women were excluded if they used hormonal contraceptives or received contraceptive (progesterone) injections 3 months prior to the screening, and/or were not fasting at the time of screening. For our subgroup analysis, we used the NIH criteria (subset NIH criteria), which includes girls and women with OD and clinical and/or biochemical HA.
All female participants underwent a standardized screening. Screening took place in the morning after an overnight fast and included assessment of the menstrual cycle, height and weight, calculation of BMI, assessment of hirsutism using mFGs, and blood withdrawal. TFC and ovarian volume were assessed using transvaginal ultrasound. The same day, the following hormone levels were measured: LH, follicle-stimulating hormone (FSH), estradiol (E2), progesterone, 17-hydroxyprogesterone, T, androstenedione (Adion), dehydroepiandrosterone (DHEA), DHEA-sulfate (DHEAS), cortisol, prolactin, thyroid-stimulating hormone (TSH), SHBG, anti-Müllerian hormone (AMH), and fasting levels of insulin (Ins0) and glucose (Glu0). All assay methods and antibodies used are described in Table 1.
Assays and antibodies used
| Name of assay | RRID | |
|---|---|---|
| Testosterone | ||
| Method 1 | RIA kits (Diagnostic Products Corp) | Catalog No. DSL-4000, RRID:AB_3096130 |
| Method 2 | RIA (Siemens DPC) | Catalog No. TKTT5, RRID:AB_2905660 |
| Method 3 | PerkinElmer CHS MSMS Steroids Kit | NA |
| Method 4 | Self-developed LC-MS/MS | NA |
| Method 5 | Self-developed LC-MS/MS. | NA |
| SHBG | ||
| Method 1 | RIA kits (Diagnostic Products Corp) | Catalog No. DSL-6300, RRID:AB_3096132 |
| Method 2 | Siemens Immulite 2000XPi | NA |
| Method 3 | Immunoassay, Immunodiagnostic Systems-iSYS | Catalog No. IS-5600, RRID:AB_3096143 |
| DHEAS | ||
| Method 1 | RIA kits (Diagnostics Products Corp) | Catalog No. TKDS1, RRID:AB_3096136 |
| Method 2 | Immulite 2000, platform assay | NA |
| Method 3 | LC-MS/MS | NA |
| Method 4 | LC-MS/MS | NA |
| Glu0 | ||
| Method 1 | Unicell DxC 800 assay (Beckman Coulter) | NA |
| Method 2 | Roche Hitachi 917 | NA |
| Method 3 | Roche Modular E170 | NA |
| Method 4 | COBAS 8000 Modular Analyzer (Roche Diagnostics GmbH) | NA |
| Ins0 | ||
| Method 1 | Assay not specified | NA |
| Method 2 | Immulite 1000 assay (Diagnostics Products Corp) | Catalog No. LKIN1, RRID:AB_2750939 |
| Method 3 | Immulite 2000 | Catalog No. L2KIN2, RRID:AB_2756390 |
| Method 4 | Lumipulse G1200 | Catalog No. 292938, RRID:AB_3096140 |
| LH | ||
| Method 1 | Immulite 1000, platform assay | Catalog No. LKLH1, RRID:AB_3096145 |
| Method 2 | Siemens Immulite 2000XPi | Catalog No. L2KLH2, RRID:AB_2756388 |
| Method 3 | Lumipulse G1200 (Fujirebio) | Catalog No. 292822, RRID:AB_3096138 |
| FSH | ||
| Method 1 | Immulite 1000, platform assay | Catalog No. LKFS1, RRID:AB_3096144 |
| Method 2 | Siemens Immulite 2000X Pi | Catalog No. L2KFS2, RRID: AB_2756389 |
| Method 3 | Lumipulse G1200 (Fujirebio) | Catalog No. 230923, RRID:AB_3096137 |
| E2 | ||
| Method 1 | Immulite (Diagnostic Products Corp) | Siemens Catalog No. LKE21, RRID:AB_2800400 |
| Method 2 | Siemens RIA | Catalog No. DSL-4800, RRID:AB_3096131 |
| Method 3 | Roche Cobas E | NA |
| Method 4 | Lumipulse G1200 (Fujirebio) | Catalog No. 296011, RRID:AB_3096142 |
| Adion | ||
| Method 1 | RIA kits (Diagn Products Corp) | Catalog No. TKAN1, RRID:AB_3096134 |
| Method 2 | Immulite 2000 platform assay | Siemens Catalog No. LKAO1, RRID:AB_2895713 |
| Method 3 | LC-MS/MS | NA |
| Method 4 | Self-developed UPLC-MS/MS test | NA |
| DHEA | ||
| Method 1 | RIA kits (Diagnostic Products Corp) | Catalog No. TKDH1, RRID:AB_3096135 |
| Method 2 | Immulite 2000 platform assay | NA |
| Method 3 | LC-MS/MS | NA |
| Method 4 | LC-MS/MS | NA |
| Cortisol | ||
| Method 1 | Immulite 2000 | Siemens Catalog No. LKCO2, RRID:AB_2810257 |
| Method 2 | UPLC-MS/MS middels Beckman Access II | NA |
| TSH | ||
| Method 1 | Amerlite TSH assay | NA |
| Method 2 | Immulite 2000XPi | NA |
| Method 3 | Lumipulse G1200 (Fujirebio) | Catalog No. 294604, RRID:AB_3096141 |
| AMH | ||
| Method 1 | Immulon 2 plates (Dynatech Corp) | NA |
| Method 2 | Immunotech-Coulter | NA |
| Method 3 | Beckman Coulter Inc, AMH Gen II assay | Beckman Coulter Catalog No. 79765, RRID:AB_2800500 |
| Method 4 | Lumipulse G1200 (Fujirebio) | NA |
| Prolactin | ||
| Method 1 | Siemens Immulite 2000XPi | Catalog No. L2KPR2, RRID:AB_2827375 |
| Method 2 | Lumipulse G1200 (Fujirebio) | Catalog No. 292839, RRID:AB_3096139 |
| Method 3 | Siemens Atellica IM1300 | Catalog No. 10995656, RRID:AB_3096296 |
Abbreviations: Adion, androstenedione; AMH, antimüllerian hormone; DHEA, dehydroepiandrosterone; DHEAS, dehydroepiandrosterone sulfate; E2, estradiol; FSH, follicle-stimulating hormone; Glu0, glucose; Ins0, insulin; LC-MS/MS, liquid chromatography–tandem mass spectrometry; LH, luteinizing hormone; NA, not available; RIA, radioimmunoassay; RRID, Research Resource Identifier; SHBG, sex hormone–binding globulin; TSH, thyroid-stimulating hormone (http://antibodyregistry.org/); UPLC, ultra-performance liquid chromatography.
Before 2019, lipid levels were measured occasionally and since 2019 lipid measurements are part of the standardized screening. Measured lipid levels included triglycerides (TG), low-density lipoprotein (LDL), high-density lipoprotein (HDL), and total cholesterol (Chol). Furthermore, systolic blood pressure (SBP) and diastolic blood pressure (DBP) were assessed. The medical ethical review board of the Erasmus University Medical Center Rotterdam approved retrospective studies within this patient population, which includes girls and women with ovulatory dysfunction (MEC-2020-0534).
Cluster Analysis
Cluster analysis and subtype naming was performed as we have previously reported (8). Unsupervised hierarchical cluster analysis was applied using the following 8 age-adjusted quantitative variables: BMI, T, SHBG, DHEAS, LH, FSH, Ins0, and Glu0. First, we performed the cluster analysis on our total cohort (Rotterdam criteria) and repeated the analysis in a subset according to the NIH criteria (subset NIH criteria). Individuals with a glucose level above 7 mmol/L were excluded. The quantitative variables were first loge-normalized and adjusted for age and assay method. Next, an inverse normal transformation was applied for each variable to ensure equal scaling. The residuals of the different variables were then clustered using hierarchical clustering (HC) as described previously (8). The subtypes were designated 1) “reproductive,” characterized by higher LH and SHBG levels with relatively low BMI and insulin levels; 2) “metabolic,” characterized by increased glucose, and insulin levels with lower SHBG and LH levels; and 3) “background” (previously labeled indeterminate), for the cases that demonstrated no distinguishable pattern regarding their relative phenotypic trait distributions (17). The contribution of each variable to the first 3 dimensions of the clustering was further quantified.
Comparison Between Subtypes
Additional clinical variables were compared between the subtypes, including E2, Adion, DHEA, cortisol, TSH, AMH, TFC, prolactin, mFGs, TG, Chol, LDL, HDL, SBP, and DBP. These variables were first transformed using log10 transformation, and subsequently Z scores were calculated to account for the use of different assays. Analysis of variance was used to compare the clinical variables between the 3 subtypes. Pair-wise comparison between different subtypes was adjusted for multiple testing using Bonferroni correction.
Distribution of the Phenotypes Within Subtypes
We compared the distribution of each phenotype from the Rotterdam criteria over the 3 subtypes. The results are provided in Supplementary Tables S1 and S2 (18). The Rotterdam diagnostic criteria include 4 phenotypes: phenotype A (OD + HA + PCOM); phenotype B (OD + HA); phenotype C (HA + PCOM); and phenotype D (OD + PCOM). Whenever one of the clinical characteristics (OD, HA, or PCOM) was missing, we considered the phenotype of that same participant as missing. We performed this analysis for both the total cohort as well as for the subset fulfilling the NIH criteria. Finally, we stratified the total cohort into the groups “classic NIH” (phenotype A + B) and “non-NIH Rotterdam” (phenotype C + D) and compared the distribution of the 3 subtypes within both groups by performing a chi-square test.
Results
Descriptive Statistics
In total, 2510 girls and women with PCOS, diagnosed using the Rotterdam criteria, were included (total cohort).
Eight participants were excluded because of a serum glucose greater than 7 mmol/L. Of the remaining 2502 girls and women, 1067 met the NIH criteria (subset NIH criteria). Tables 2 and 3 show the 8 quantitative variables stratified by assay method, which were used for the cluster analysis for both the total cohort and the subset NIH criteria respectively.
Descriptive variables and statistics of hierarchical clustering—total cohort
| N | Metabolic median (25-75) | N | Reproductive median (25-75) | N | Background median (25-75) | P total | P (met – rep) | P (met – back) | P (rep – back) | |
|---|---|---|---|---|---|---|---|---|---|---|
| Age, y | 1026 | 29.0 (25.2-32.4) | 450 | 29.4 (26.1-32.1) | 1026 | 29.1 (25.9-32.2) | .455 | .628 | ≥.999 | ≥.999 |
| BMI | 1026 | 30.1 (25.2-34.9) | 450 | 21.5 (19.8-24.0) | 1026 | 22.5 (20.5-25.3) | <.001 | <.001 | <.001 | <.001 |
| Testosterone | <.001 | <.001 | <.001 | <.001 | ||||||
| Method 1 | 52 | 3.0 (2.1-3.5) | 18 | 3.0 (2.7-3.3) | 28 | 2.0 (1.5-2.4) | ||||
| Method 2 | 488 | 2.0 (1.5-2.6) | 235 | 2.0 (1.6-2.7) | 498 | 1.2 (0.8-1.6) | ||||
| Method 3 | 259 | 1.4 (1.1-1.9) | 108 | 1.5 (1.3-2.1) | 257 | 1.1 (0.8-1.4) | ||||
| Method 4 | 53 | 1.4 (1.1-1.8) | 24 | 1.8 (1.5-2.1) | 55 | 1.0 (0.9-1.2) | ||||
| Method 5 | 174 | 1.5 (1.2-1.9) | 65 | 1.7 (1.4-2.4) | 188 | 1.0 (0.8-1.3) | ||||
| SHBG | <.001 | <.001 | <.001 | .002 | ||||||
| Method 1 | 51 | 32.8 (23.4-51.1) | 18 | 65.0 (47.2-93.5) | 25 | 65.8 (50.2-93.0) | ||||
| Method 2 | 877 | 31.3 (22.6-43.2) | 401 | 61.9 (48.1-76.8) | 884 | 56.0 (42.8-73.7) | ||||
| Method 3 | 98 | 30.6 (22.2-41.4) | 31 | 69.1 (47.7-82.0) | 117 | 61.6 (42.8-75.7) | ||||
| DHEAS | <.001 | <.001 | <.001 | .201 | ||||||
| Method 1 | 51 | 7.3 (4.7-10.2) | 18 | 6.8 (4.9-9.5) | 25 | 5.8 (4.0-8.6) | ||||
| Method 2 | 530 | 5.8 (4.1-7.4) | 261 | 4.5 (3.5-5.8) | 541 | 4.5 (3.1-6.0) | ||||
| Method 3 | 218 | 5.0 (3.6-6.4) | 82 | 3.9 (2.9-5.4) | 217 | 3.9 (2.6-5.6) | ||||
| Method 4 | 227 | 5.5 (4.3-7.2) | 89 | 3.8 (2.6-5.7) | 243 | 4.1 (3.0-5.6) | ||||
| Glu0 | <.001 | <.001 | <.001 | <.001 | ||||||
| Method 1 | 21 | 4.6 (4.1-4.9) | 12 | 2.8 (2.3-2.9) | 11 | 4.3 (4.0-4.7) | ||||
| Method 2 | 290 | 4.2 (3.9-4.5) | 113 | 3.6 (3.4-3.8) | 239 | 4.0 (3.7-4.2) | ||||
| Method 3 | 254 | 5.0 (4.7-5.2) | 139 | 4.5 (4.3-4.7) | 302 | 4.7 (4.5-4.9) | ||||
| Method 4 | 461 | 5.2 (4.9-5.5) | 186 | 4.7 (4.5-4.9) | 474 | 4.9 (4.7-5.1) | ||||
| Ins0 | <.001 | <.001 | <.001 | <.001 | ||||||
| Method 1 | 200 | 94.0 (72.0-141.6) | 50 | 43.5 (29.0-58.0) | 167 | 49.0 (36.0-64.1) | ||||
| Method 2 | 107 | 83.0 (62.5-111.0) | 75 | 34.0 (26.0-47.0) | 83 | 44.0 (29.5-57.0) | ||||
| Method 3 | 548 | 82.0 (56.0-123.0) | 260 | 27.0 (15.8-40.0) | 589 | 35.0 (20.0-51.0) | ||||
| Method 4 | 171 | 94.0 (63.0-127.5) | 65 | 34.0 (30.0-41.0) | 187 | 44.0 (32.5-56.0) | ||||
| LH | <.001 | <.001 | <.001 | <.001 | ||||||
| Method 1 | 51 | 6.9 (4.9-10.4) | 18 | 10.5 (7.7-11.5) | 25 | 5.2 (3.5-6.1) | ||||
| Method 2 | 804 | 8.7 (5.8-12.4) | 367 | 12.8 (8.7-18.1) | 814 | 4.9 (3.3-6.9) | ||||
| Method 3 | 171 | 9.1 (6.3-13.0) | 65 | 12.0 (8.8-16.2) | 187 | 4.6 (3.2-6.7) | ||||
| FSH | <.001 | <.001 | <.001 | <.001 | ||||||
| Method 1 | 51 | 4.7 (3.6-6.1) | 18 | 4.7 (3.6-5.0) | 25 | 4.9 (3.8-5.7) | ||||
| Method 2 | 804 | 5.9 (4.5-7.2) | 367 | 7.0 (5.8-8.4) | 814 | 4.8 (3.3-6.2) | ||||
| Method 3 | 171 | 5.6 (4.7-6.7) | 65 | 6.8 (6-7.6) | 187 | 5.0 (3.5-6.1) |
Values are medians with 25th and 75th percentiles for each cluster. For pairwise comparisons, Z scores were calculated to account for the use of different assays and a post hoc Bonferroni correction was used to adjust for multiple testing.
Abbreviations: BMI, body mass index; DHEAS, dehydroepiandrosterone sulfate; FSH, follicle-stimulating hormone; Glu0, glucose; Ins0, insulin; LH, luteinizing hormone; met, metabolic; rep, reproductive; SHBG, sex hormone–binding globulin; y, year.
Descriptive variables and statistics of hierarchical clustering—subset National Institutes of Health criteria
| N | Metabolic median (25-75) | N | Reproductive median (25-75) | N | Background median (25-75) | P total | P (met – rep) | P (met – back) | P (rep – back) | |
|---|---|---|---|---|---|---|---|---|---|---|
| Age, y | 652 | 28.1 (24.3-32.0) | 199 | 29.0 (25.9-31.8) | 216 | 28.2 (24.1-32.0) | .092 | .104 | ≥.999 | .232 |
| BMI | 652 | 30.6 (26.7-35.0) | 199 | 22.4 (20.4-24.8) | 216 | 22.8 (20.5-25.9) | <.001 | <.001 | <.001 | .845 |
| Testosterone | <.001 | <.001 | <.001 | <.001 | ||||||
| Method 1 | 5 | 3.0 (2.9 –3.3) | — | — | — | — | ||||
| Method 2 | 342 | 2.2 (1.7-2.8) | 80 | 3.1 (2.6-3.7) | 113 | 1.6 (1.3-2.1) | ||||
| Method 3 | 180 | 1.5 (1.2-1.9) | 74 | 2.2 (2.0-2.7) | 62 | 1.3 (0.9-1.5) | ||||
| Method 4 | 39 | 1.4 (1.2-2.0) | 15 | 2.1 (1.7-2.8) | 15 | 1.1 (1.0-1.5) | ||||
| Method 5 | 86 | 1.4 (1.1-1.8) | 30 | 2.2 (1.9-2.8) | 26 | 1.5 (1.1-1.7) | ||||
| SHBG | <.001 | <.001 | <.001 | <.001 | ||||||
| Method 1 | 3 | 30.7 (25.7-40.0) | — | — | ||||||
| Method 2 | 627 | 29.2 (21.4-37.5) | 188 | 58.4 (48.5-74.7) | 206 | 41.0 (31.8-52.6) | ||||
| Method 3 | 22 | 26.7 (21.1-35.3) | 11 | 67.1 (56.5-78.5) | 10 | 46.3 (35.1-62.3) | ||||
| DHEAS | <.001 | <.001 | .316 | <.001 | ||||||
| Method 1 | 3 | 12.6 (9.8-12.8) | — | — | — | — | ||||
| Method 2 | 380 | 5.8 (4.2-7.5) | 94 | 4.9 (3.6-6.3) | 123 | 6.3 (4.8-7.6) | ||||
| Method 3 | 269 | 5.2 (4.0-6.8) | 105 | 4.0 (3.0-5.7) | 93 | 5.95 (4.3-7.6) | ||||
| Glu0 | <.001 | <.001 | <.001 | .106 | ||||||
| Method 1 | 2 | 3.7 (3.7-3.8) | — | — | — | — | ||||
| Method 2 | 182 | 4.2 (3.8-4.4) | 38 | 3.9 (3.6-4.0) | 48 | 3.8 (3.5-4.0) | ||||
| Method 3 | 183 | 4.9 (4.7-5.2) | 50 | 4.6 (4.4-4.7) | 72 | 4.6 (4.2-4.8) | ||||
| Method 4 | 285 | 5.1 (4.9-5.4) | 111 | 4.9 (4.6-5.0) | 96 | 4.7 (4.6-5.0) | ||||
| Ins0 | <.001 | <.001 | <.001 | 1.0 | ||||||
| Method 1 | 94 | 93.5 (72.0-139.3) | 16 | 51.0 (42.1-68.7) | 11 | 36.1 (31.5-59.0) | ||||
| Method 2 | 88 | 86.5 (61.8-110.0) | 22 | 29.5 (24.5-35.8) | 37 | 38.0 (30.0-44.0) | ||||
| Method 3 | 386 | 86.0 (62.0-131.0) | 131 | 33.0 (17.5-48.0) | 143 | 32.0 (18.0-43.0) | ||||
| Method 4 | 84 | 98.5 (60.8-141.0) | 30 | 33.0 (31.0-44.8) | 25 | 40.0 (35.0-48.0) | ||||
| LH | <.001 | <.001 | .004 | <.001 | ||||||
| Method 1 | 3 | 4.8 (4.6-9.3) | — | — | — | — | ||||
| Method 2 | 565 | 8.4 (5.4-11.7) | 169 | 13.3 (10.0-18.8) | 191 | 7.1 (4.8-10.4) | ||||
| Method 3 | 84 | 8.1 (5.4-10.8) | 30 | 12.8 (10.4-17.3) | 25 | 6.6 (5.7-8.6) | ||||
| FSH | <.001 | <.001 | .248 | <.001 | ||||||
| Method 1 | 3 | 5.6 (5.2-5.8) | — | — | — | — | ||||
| Method 2 | 565 | 5.6 (4.0-7.0) | 169 | 6.4 (5.3-7.9) | 191 | 5.6 (4.5-7.0) | ||||
| Method 3 | 84 | 5.4 (4.0-6.3) | 30 | 6.4 (5.6-7.3) | 25 | 5.1 (4.7-5.6) |
Values are medians with 25th and 75th percentiles for each cluster. For pairwise comparisons, Z scores were calculated to account for the use of different assays and a post hoc Bonferroni correction was used to adjust for multiple testing.
Abbreviations: BMI, body mass index; DHEAS, dehydroepiandrosterone sulfate; FSH, follicle-stimulating hormone; Glu0, glucose; Ins0, insulin; LH, luteinizing hormone; met, metabolic; rep, reproductive; SHBG, sex hormone–binding globulin.
Cluster Analysis
Investigation of the previously defined 3 subtypes (8) showed in our total cohort the following distributions: (1) metabolic subtype (41.0%, 1026/2502) characterized by higher BMI, Glu0, and Ins0 levels with relatively low LH and SHBG levels; (2) reproductive subtype (18.0%, 450/2502), characterized by higher FSH, LH, and SHBG levels with relatively low BMI and Ins0 levels; and (3) background subtype (41.0%, 1026/2502), which has no distinguishable pattern in the phenotypic trait distributions (see Table 2, Fig. 1). Age did not differ between the 3 subtypes (P = .455). All other variables showed significant differences between the 3 subtypes (all P < .001), except for DHEAS levels, which were significantly higher only in the metabolic subtype (P < .001) (see Table 2). These results are also shown in the principal component analysis (PCA) plot and box plot and demonstrate that the reproductive subtype is mainly driven by LH and SHBG, contributing respectively 18.7% and 14.6% to the first 2 principal components, whereas the metabolic subtype is driven by the variables BMI and Ins0, contributing 16.8% and 15.9%, respectively (Fig. 1A and 1B). These results are supported by heat map visualization (Fig. 1C), which reflects the similarity of individual subjects in a row-based dendrogram compared to the trait Z scores of the 3 cluster groups.
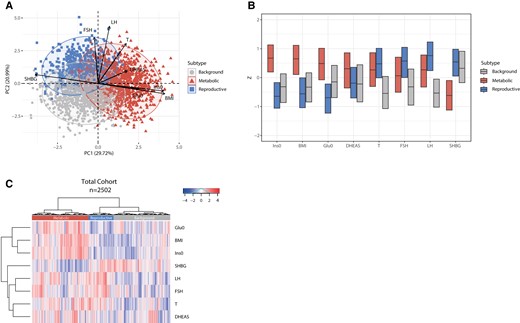
Principal component analysis (PCA) plot, box plot, and heat map of normalized variables of the 3 subtypes—total cohort. A, PCA based on 8 predefined variables. The metabolic subtype is highlighted in red triangles, the reproductive subtype is indicated with blue squares, and the background subtype is indicated with gray circles. The direction and length of the arrows indicate the contribution of that specific variable to define the clusters. B, Box plot indicating the median and interquartile ranges (IQR) for each normalized variable. The corresponding Z scores are shown on the y-axis. The metabolic, reproductive, and background subtypes are shown in red, blue, and gray. C, Heat map colors reflect the variable Z-scores. Red indicates high values and blue indicates low values. The 3 subtypes are indicated in the color bar on top of the graph. The metabolic subtype appears in red, the reproductive subtype in red, and the background subtype in gray. The row-based dendrogram indicates the relation and relative distances between variable distributions. BMI, body mass index; DHEAS, dehydroepiandrosterone sulfate; FSH, follicle-stimulating hormone; Glu0, glucose; Ins0, insulin; LH, luteinizing hormone; SHBG, sex hormone–binding globulin; T, testosterone.
Our results are in line with our previously published study on hierarchical clustering in women with PCOS diagnosed with the NIH criteria (8). Indeed, after subsetting our data based on the NIH criteria, and repeating the cluster analysis, 3 distinct subtypes could again be identified (see Table 3, Fig. 2). However, compared to the total cohort, the percentage of women having the metabolic subtype (61.1%, 652/1067) was higher while the percentage of women having the background subtype (18.7%, 199/1067) was lower compared to the total cohort (see Table 3). The percentage of women having the reproductive subtype was similar to the total cohort (20.2%, 216/1067). Age was again not significantly different among the 3 subtypes (P = .09) (see Table 3). In line with the analysis in the total cohort, the PCA plot, box plot, and heat map showed that the reproductive subtype is mainly driven by LH, SHBG, and FSH, each contributing 19.6% and 15.3% and 13.0% to the first 2 principal components, whereas the metabolic subtype is mainly driven by BMI and Ins0, contributing 17.4% and 18.2% (see Fig. 2). The background subtype has no distinguishable pattern in the phenotypic trait distributions (see Fig. 2).
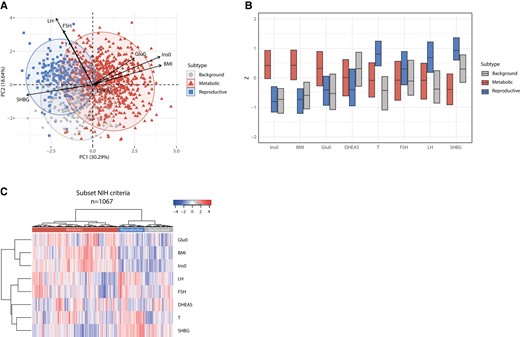
Principal component analysis (PCA) plot, box plot, and heat map of normalized variables of the 3 subtypes—subset NIH criteria. A, PCA based on 8 predefined variables. The metabolic subtype is highlighted in red triangles, the reproductive subtype is indicated with blue squares, and the background subtype is indicated with gray circles. The black arrows indicate the magnitude and direction of that specific variable to define the clusters. B, Box plot indicating the median and interquartile ranges (IQR) for each normalized variable. The corresponding Z scores are shown on the y-axis. The metabolic, reproductive, and background subtypes are shown in red, blue, and gray. C, Heat map colors reflect the variable Z scores. Red indicates high values and blue indicates low values. The 3 clusters are indicated in the color bar on top of the graph. The metabolic subtype appears in red, the reproductive subtype in red, and the background subtype in gray. The row-based dendrogram indicates the relation and relative distances between variable distributions. BMI, body mass index; DHEAS, dehydroepiandrosterone sulfate; FSH, follicle-stimulating hormone; Glu0, glucose; Ins0, insulin; LH, luteinizing hormone; SHBG, sex hormone–binding globulin; T, testosterone.
Comparison of Additional Clinical Variables Between Subtypes
We compared clinical variables not used for clustering to determine whether the subtypes captured additional distinctive biologic features related to reproductive or metabolic pathways (Tables 4 and 5). In the reproductive subtype, girls and women had significantly higher AMH levels and higher TFC compared to participants in the metabolic subtype (all P < .001). Participants in the metabolic subtype had significantly higher TG and LDL levels and significantly lower HDL levels, compared to those in the reproductive subtype (all P < .001). SBP and DBP were also significantly higher in the metabolic subtype compared to both the reproductive and background subtypes (P < .001). These results were similar when PCOS was defined by the NIH or Rotterdam diagnostic criteria.
Additional variables and statistics of the polycystic ovary syndrome subtypes—total cohort
| N | Metabolic median (25-75) | N | Reproductive median (25-75) | N | Background median (25-75) | P total | P (met – rep) | P (met – back) | P (rep – back) | |
|---|---|---|---|---|---|---|---|---|---|---|
| E2 | <.001 | <.001 | .071 | <.001 | ||||||
| Method 1 | 52 | 237.5 (195.0-303.3) | 18 | 263.0 (219.3-352.0) | 28 | 200.5 (127.0-263.8) | ||||
| Method 2 | 592 | 219.5 (164.0-294.0) | 275 | 243.0 (17.0-371.0) | 600 | 201.5 (123.3-354.0) | ||||
| Method 3 | 265 | 184.0 (139.0-297.5) | 117 | 229.0 (165.0-345.5) | 262 | 196.5 (123.8-400.3) | ||||
| Method 4 | 116 | 184.0 (138.5-323.5) | 40 | 213.0 (164.8-354.5) | 136 | 190.5 (122.8-416.0) | ||||
| Adion | <.001 | ≥.999 | <.001 | <.001 | ||||||
| Method 1 | 51 | 15.0 (10.3-20.2) | 18 | 13.3 (9.4-20.3) | 25 | 10.8 (6.3-13.7) | ||||
| Method 2 | 489 | 12.1 (9.3-15.4) | 236 | 11.3 (8.9-14.3) | 500 | 8.5 (6.5-11.4) | ||||
| Method 3 | 259 | 6.1 (4.8-7.8) | 106 | 6.1 (4.7-8.3) | 255 | 4.3 (3.4-5.5) | ||||
| Method 4 | 227 | 6.3 (4.7-7.9) | 89 | 6.9 (5.7-8.8) | 243 | 4.3 (3.4-5.4) | ||||
| DHEA | <.001 | <.001 | <.001 | <.001 | ||||||
| Method 1 | — | — | — | — | — | — | ||||
| Method 2 | 528 | 42.4 (29.3-60.4) | 260 | 36.1 (25.4-50.5) | 538 | 30.7 (20.4-44.6) | ||||
| Method 3 | 218 | 22.0 (15.0-29.9) | 82 | 18.8 (12.8-25.7) | 217 | 18.1 (12.9-25.6) | ||||
| Method 4 | 227 | 20.3 (14.9-28.1) | 89 | 18.5 (14.2-25.8) | 243 | 16.4 (11.8-23.6) | ||||
| Cortisol | ≥.999 | ≥.999 | ≥.999 | ≥.999 | ||||||
| Method 1 | 939 | 315.0 (243.0-405.0) | 420 | 309.0 (252.0-400.8) | 926 | 317.0 (251.0-400.0) | ||||
| Method 2 | 81 | 264.0 (180.5-339.0) | 28 | 293.0 (234.8-330.0) | 99 | 265.0 (210.0-332.0) | ||||
| TSH | .013 | .410 | .011 | 1.0 | ||||||
| Method 1 | 50 | 1.2 (0.8-2.0) | 18 | 1.4 (0.8-1.7) | 24 | 1.1 (0.7-1.5) | ||||
| Method 2 | 815 | 1.8 (1.2-2.4) | 373 | 1.5 (1.2-2.2) | 828 | 1.5 (1.1-2.3) | ||||
| Method 3 | 160 | 1.9 (1.4-2.5) | 59 | 1.8 (1.2-2.7) | 173 | 1.8 (1.3-2.3) | ||||
| AMH | <.001 | <.001 | .029 | <.001 | ||||||
| Method 1 | 1 | 51.0 (51.0-51.0) | — | — | — | — | ||||
| Method 2 | 246 | 14.4 (8.0-23.7) | 149 | 17.3 (10.4-30.4) | 239 | 11.8 (8.1-18.2) | ||||
| Method 3 | 378 | 7.0 (4.3-11.0) | 167 | 10.0 (5.7-15.4) | 420 | 5.7 (3.8-9.1) | ||||
| Method 4 | 151 | 6.8 (4.3-9.8) | 51 | 9.7 (6.9-19.3) | 161 | 6.0 (4.3-8.7) | ||||
| TFC | <.001 | <.001 | <.001 | <.001 | ||||||
| Method 1 | 770 | 38.0 (27.0-53.0) | 375 | 43.0 (30.0-61.0) | 783 | 33.0 (25.0-43.0) | ||||
| Method 2 | 139 | 52.0 (39.0-69.0) | 56 | 64.0 (45.5-87.0) | 162 | 51.0 (37.0-65.0) | ||||
| Prolactin | .535 | ≥.999 | ≥.999 | ≥.999 | ||||||
| Method 1 | 197 | 0.2 (0.1-0.2) | 50 | 0.2 (0.1-0.2) | 167 | 0.2 (0.1-0.2) | ||||
| Method 2 | 655 | 0.2 (0.2-0.3) | 334 | 0.2 (0.1-0.3) | 672 | 0.2 (0.1-0.3) | ||||
| Method 3 | 171 | 0.3 (0.2-0.4) | 65 | 0.3 (0.2-0.4) | 187 | 0.3 (0.2 –0.4) | ||||
| mFGs | 818 | 3.0 (1.0-7.0) | 386 | 1.0 (0.0-4.0) | 839 | 1.0 (0.0-4.0) | <.001 | <.001 | <.001 | ≥.999 |
| TG | 497 | 1.2 (0.9-1.7) | 177 | 0.7 (0.6-0.9) | 450 | 0.8 (0.6-1.1) | <.001 | <.001 | <.001 | .13 |
| Chol | 497 | 4.8 (4.2-5.4) | 177 | 4.7 (4.1-5.2) | 450 | 4.4 (3.9-5.0) | <.001 | .89 | <.001 | <.001 |
| LDL | 497 | 3.1 (2.6-3.6) | 177 | 2.8 (2.4-3.3) | 450 | 2.6 (2.2-3.1) | <.001 | <.001 | <.001 | .045 |
| HDL | 497 | 1.1 (0.9-1.4) | 177 | 1.6 (1.4-1.9) | 450 | 1.4 (1.2-1.7) | <.001 | <.001 | <.001 | <.001 |
| SBP | 780 | 120.0 (110.0-126.0) | 375 | 110.0 (105.0-120.0) | 822 | 110.0 (105.0-120.0) | <.001 | <.001 | <.001 | .464 |
| DBP | 780 | 80.0 (70.0-84.0) | 375 | 70.0 (65.0-80.0) | 822 | 70.0 (70.0-80.0) | <.001 | <.001 | <.001 | ≥.999 |
Values are medians with 25th and 75th percentiles for each cluster. For pairwise comparisons, Z scores were calculated to account for the use of different assays and a post hoc Bonferroni correction was used to adjust for multiple testing.
Abbreviations: Adion, androstenedione; AMH, antimüllerian hormone; back, background; Chol, cholesterol; DBP, diastolic blood pressure; DHEA, dehydroepiandrosterone; E2, estradiol; HDL, high-density lipoprotein; LDL, low-density lipoprotein; met, metabolic; mFGs, modified Ferriman Gallwey score; rep, reproductive; SBP, systolic blood pressure; TFC, total follicle count; TG, triglycerides; TSH, thyrotropin.
Additional variables and statistics of the polycystic ovary syndrome subtypes—subset National Institutes of Health criteria
| N | Metabolic median (25-75) | N | Reproductive median (25-75) | N | Background median (25-75) | P total | P (met – rep) | P (met – back) | P (rep – back) | |
|---|---|---|---|---|---|---|---|---|---|---|
| E2 | <.001 | .04 | <.001 | <.001 | ||||||
| Method 1 | 5 | 242.0 (199.5-337.5) | — | — | — | — | ||||
| Method 2 | 322 | 228.0 (117.0-335.3) | 107 | 240.0 (187.0-338.0) | 133 | 191.0 (137.0-290.0) | ||||
| Method 3 | 186 | 183.0 (138.8-355.0) | 77 | 237.0 (165.5-386.5) | 69 | 158.0 (104.0-276.0) | ||||
| Method 4 | 38 | 211.5 (160.5-278.0) | 15 | 261.0 (186.0-356.0) | 14 | 201.0 (123.0-357.5) | ||||
| Adion | <.001 | <.001 | <.001 | <.001 | ||||||
| Method 1 | 3 | 20.2 (15.2-20.2) | — | — | — | — | ||||
| Method 2 | 344 | 12.8 (9.7-16.0) | 82 | 15.2 (11.3-18.1) | 113 | 10.8 (8.8-13.8) | ||||
| Method 3 | 180 | 6.5 (5.0-8.2) | 72 | 8.3 (6.5-9.6) | 62 | 5.8 (4.1-7.2) | ||||
| Method 4 | 125 | 6.3 (8.1-4.7) | 45 | 8.4 (6.9-10.8) | 41 | 5.7 (4.6-7.7) | ||||
| DHEA | .028 | .024 | ≥.999 | .397 | ||||||
| Method 1 | — | — | — | — | — | — | ||||
| Method 2 | 380 | 43.4 (31.4-61.6) | 93 | 35.9 (26.2-47.3) | 123 | 42.7 (29.4-60.7) | ||||
| Method 3 | 144 | 23.0 (17.0-31.6) | 60 | 21.1 (16.3-23.0) | 52 | 21.7 (15.4-29.5) | ||||
| Method 4 | 125 | 21.0 (15.2-29.5) | 45 | 18.5 (14.7-24.1) | 41 | 21.6 (16.1-29.2) | ||||
| Cortisol | .787 | ≥.999 | ≥.999 | ≥.999 | ||||||
| Method 1 | 639 | 310.0 (237.0-394.0) | 192 | 312.0 (242.8-411.8) | 209 | 309.0 (247.5-393.5) | ||||
| Method 2 | 13 | 218.0 (178.5-354.5) | 6 | 235.5 (179.3-287.8) | 7 | 217.0 (203.0-250.0) | ||||
| TSH | .086 | ≥.999 | .148 | .137 | ||||||
| Method 1 | 3 | 1.1 (0.6—X) | — | — | — | — | ||||
| Method 2 | 578 | 1.7 (1.2-2.3) | 171 | 1.7 (1.2-2.3) | 192 | 1.5 (1.1-2.1) | ||||
| Method 3 | 71 | 1.9 (1.5-2.7) | 28 | 2.1 (1.2-3.0) | 24 | 1.7 (1.2-1.9) | ||||
| AMH | <.001 | <.001 | ≥.999 | <.001 | ||||||
| Method 1 | 193 | 14.3 (7.5-24.0) | 51 | 25.7 (13.4-38.9) | 72 | 12.9 (8.9-23.3) | ||||
| Method 2 | 267 | 7.5 (4.7-11.9) | 100 | 12.1 (7.8-18.9) | 97 | 7.0 (4.5-11.8) | ||||
| Method 3 | 62 | 6.6 (4.4-9.8) | 25 | 16.8 (12.6-23.0) | 20 | 8.8 (5.9-11.7) | ||||
| TFC | <.001 | <.001 | 1.0 | <.001 | ||||||
| Method 1 | 509 | 41.0 (29.0-57.0) | 161 | 55.0 (37.5-75.0) | 169 | 38.0 (29.0-52.0) | ||||
| Method 2 | 57 | 54.0 (37.5-77.5) | 27 | 75.0 (63.0-89.0) | 21 | 52.0 (42.0-71.5) | ||||
| Prolactin | .537 | .877 | 1.0 | ≥.999 | ||||||
| Method 1 | 94 | 0.2 (0.1-0.2) | 16 | 0.2 (0.2-0.3) | 11 | 0.2 (0.2-0.4) | ||||
| Method 2 | 474 | 0.2 (0.1-0.3) | 152 | 0.2 (0.2-0.3) | 180 | 0.2 (0.1-0.3) | ||||
| Method 3 | 84 | 0.3 (0.2-0.4) | 30 | 0.3 (0.2-0.3) | 25 | 0.3 (0.2-0.4) | ||||
| mFGs | 647 | 3.0 (0.0-7.0) | 197 | 2.0 (0.0-6.0) | 216 | 5.0 (1.0-7.0) | .002 | .012 | .70 | .003 |
| TG | 320 | 1.3 (0.9-1.9) | 90 | 0.7 (0.6-1.0) | 95 | 0.8 (0.6-1.1) | <.001 | <.001 | <.001 | .305 |
| Chol | 320 | 4.8 (4.2-5.4) | 90 | 4.5 (4.1-5.0) | 95 | 4.7 (4.0-5.2) | .154 | .311 | .498 | ≥.999 |
| LDL | 320 | 3.1 (2.6-3.6) | 90 | 2.6 (2.3-3.2) | 95 | 2.8 (2.4-3.5) | <.001 | <.001 | .083 | .576 |
| HDL | 320 | 1.1 (0.8-1.3) | 90 | 1.5 (1.2-1.8) | 95 | 1.4 (1.1-1.7) | <.001 | <.001 | <.001 | .084 |
| SPB | 523 | 120.0 (110.0-126.0) | 174 | 110.0 (105.0-120.0) | 191 | 110.0 (105.0-120.0) | <.001 | <.001 | <.001 | ≥.999 |
| DBP | 522 | 80.0 (70.0-85.0) | 174 | 70.0 (70.0-80.0) | 191 | 70.0 (68.0-80.0) | <.001 | <.001 | <.001 | ≥.999 |
Values are medians with 25th and 75th percentiles for each cluster. For pairwise comparisons, Z scores were calculated to account for the use of different assays and a post hoc Bonferroni correction was used to adjust for multiple testing.
Abbreviations: Adion, androstenedione; AMH, antimüllerian hormone; back, background; Chol, cholesterol; DBP, diastolic blood pressure; DHEA, dehydroepiandrosterone; E2, estradiol; HDL, high-density lipoprotein; LDL, low-density lipoprotein; met, metabolic; mFGs, modified Ferriman Gallwey score; rep, reproductive; SBP, systolic blood pressure; TFC, total follicle count; TG, triglycerides; TSH, thyrotropin.
Cases assigned to the background subtype showed a distinctive pattern of clinical variables. AMH and LDL levels as well as TFC were significantly lower compared to the metabolic and reproductive subtype (P = .03; P < .001; and P v< .001, respectively). Adion levels were significantly lower compared to the other 2 subtypes. E2 levels were lower compared to the reproductive subtype (all P < .001) and TSH levels were significantly lower in the background subtype compared to the metabolic subtype in the total cohort (P = .011).
Distribution of the Phenotypes Within the Subtypes
We assessed which phenotypic features used for the diagnosis of Rotterdam PCOS (OD, HA, and PCOM) were captured by the subtypes (Supplementary Table S1) (18). In the total cohort, data to determine the phenotype were missing for 258 participants. Based on the data from the remaining 2244 girls and women, the metabolic subtype predominantly had phenotype A (OD + HA + PCOM) (72.0%), while 9.4% had phenotype B (OD + HA), 4.2% phenotype C (HA + PCOM), and 13.0% phenotype D (OD + PCOM). In the reproductive subtype 52.9% had phenotype A, 2.4% phenotype B, 2.2% phenotype C, and 41.0% phenotype D. The background subtype had predominantly phenotype D (63.6%), while 26.0% had phenotype A, 4.6% phenotype B, and 2.3% phenotype C. Additionally, after performing the cluster analysis, we divided the total cohort into “classic NIH” and “non-NIH Rotterdam” based on the diagnostic criteria (Supplementary Table S2) (18). Comparison of the 2 subsets showed higher prevalence of the metabolic subtype in the classic NIH subset compared to the non-NIH Rotterdam subset (61.7% vs 18.3%; P < .001), whereas in the non-NIH Rotterdam subset the background subtype was the most prominent subtype (62.4% vs 20.8%; P < .001) (see Supplementary Table S2) (18).
After clustering the subset NIH criteria, data from 16 participants were missing in the resulting data set (see Supplementary Table 1) (18). In this subset, by design, 100% of the participants had OD in combination with HA, as defined by the NIH criteria, but PCOM was present in more than 85% of all participants as well. This resulted in a large percentage of girls and women with phenotype A (87.8% in metabolic, 93.9% in reproductive, and 92% in background subtype) and only a small percentage of participants with phenotype B (12.2% in metabolic, 6.1% in reproductive, and 8.0% in the background subtype).
Discussion
It has long been recognized that PCOS is a heterogeneous disorder with a spectrum of clinical presentations. The current diagnostic criteria, which are based on expert opinion, do not capture this heterogeneity because the phenotypes identified were genetically similar in the largest PCOS GWAS meta-analysis published to date (7). In contrast, a data-driven approach using unsupervised HC analysis of phenotypic traits identified reproducible reproductive, metabolic, and background subtypes in a European ancestry cohort of NIH PCOS cases from the United States (8). These subtypes were associated with unique genetic loci suggesting that they did capture biologically distinct causal pathways (8). Our study has replicated these subtypes in a Dutch European ancestry PCOS cohort fulfilling the broader Rotterdam diagnostic criteria, despite the fact that the Dutch cohort was substantially leaner (mean BMI 26) than the US cohort (mean BMI 35). Novel to the previous study, we were able to further characterize the different subtypes by comparing additional phenotypic traits not used for clustering. We have shown significant differences in these traits that align with these distinct causal pathways, for example, higher AMH and TFC in the reproductive subtype, and higher TG, Chol, LDL, SBP, and DBP in the metabolic subtype.
Our cluster analysis was based on 8 important phenotypic traits, but subsequent analysis of additional variables aligned with the pathways implicated. The reproductive subtype, which is characterized by higher levels of LH and SHBG, also had higher AMH levels and TFC compared to the other subtypes. This suggests that this subtype represents girls and women with PCOS with alterations in folliculogenesis. The metabolic subtype, which is characterized by increased BMI, Glu0, and Ins0 levels with lower SHBG and LH levels, also had unfavorable lipid profiles, suggesting an increased risk for cardiovascular diseases (CVDs). Therefore, girls and women in this subtype might indeed need to be screened for CVD throughout their lives, whereas those with the reproductive subtype may be at lower risk for CVD. While longitudinal studies are needed, subtype-specific differences in disease risk may account for conflicting results of studies investigating long-term health outcomes in PCOS (19, 20).
The background subtype had no distinguishable pattern in the phenotypic trait distributions. Nevertheless, this subtype had distinctive phenotypic features. The additional variables, AMH, Adion, TFC, and LDL, were significantly decreased compared to the 2 other subtypes. These findings taken together with the significant association of the background subtype with FSHB in our previous study (8), which we have recently replicated in a transethnic meta-analysis (21), support considering this subtype as etiologically distinct. The FSHB locus, which encodes the FSH β polypeptide, is associated not only with PCOS status but also with multiple fertility parameters, including twining, age of menarche, and menopause, and circulating FSH levels in GWAS (7, 22-24).
The distributions of the phenotypes in the total cohort indicated that phenotype A was highly prevalent in the metabolic and reproductive subtypes, whereas phenotype D was highly prevalent in the reproductive and background subtypes. To further investigate the effect of the diagnostic criteria, we repeated the cluster analysis limited to cases with the NIH phenotype. The percentage of cases in the metabolic subtype increased, whereas the percentage of cases in the background subtype decreased compared to the total cohort. We also statistically compared the prevalence of the phenotypes in the clusters stratified by diagnostic criteria. This analysis confirmed a significant increase in the prevalence of the metabolic subtype and a significant decrease in the background subtype in the NIH compared to the non-NIH Rotterdam cases. Taken together, these findings suggest that NIH or classic PCOS (phenotype A) predominates in the metabolic subtype, consistent with the well-established greater metabolic risk in this phenotype (3, 25, 26). The NIH (phenotype A) and non-NIH Rotterdam (phenotype D) contribute almost equally to the reproductive subtype; phenotype D predominates in the background subtype. GWAS have shown that the PCOS phenotypes are genetically similar (7). In our United States–based NIH cohort (which was included in the meta-analysis), we found that performing cluster analysis followed by GWAS identified subtypes that were associated with unique genetic loci (8). These findings suggest that the clusters captured biologically meaningful differences.
The present study included only European-ancestry PCOS cases. However, we have reported that the PCOS subtypes are present in regionally and ethnically diverse NIH PCOS cohorts, including Greek and Korean, in addition to US and Dutch (27). Further, 2 recent studies (28, 29) have replicated our subtypes using our clustering algorithm in Han Chinese PCOS cohorts. Other groups (30, 31), using different clustering approaches, have confirmed that there are reproductive and metabolic subsets of PCOS that are associated with distinct PCOS GWAS variants and risk scores. There have been previous attempts to resolve the heterogeneity of PCOS with PCA (32) or cluster analysis (33) of phenotypic traits. However, there has been no orthogonal validation with uncorrelated biomarkers, such as GWAS variants, to confirm that the resulting subtypes captured discrete biologic pathways (34).
It has frequently been hypothesized that comorbidities associated with PCOS change throughout the lifespan. One of the concepts proposed is that women with PCOS start with reproductive problems in their early reproductive years and that these problems improve over the course of life, while metabolic problems become more pronounced (35). In our cohort age was not different in three clusters, implying that reproductive and metabolic features are already present from an early age. Indeed, this is supported by other studies showing that metabolic issues are already present in adolescents with PCOS (36, 37). A recent study indicates that there is already evidence for discrete reproductive and metabolic subsets in adolescents with PCOS (38)
Strengths of our study include the availability of a large, deeply and consistently phenotyped PCOS cohort. Accordingly, we were able to assess the effect of subtyping on a number of additional important reproductive and metabolic traits not used for clustering. We were also able to investigate the distribution of Rotterdam PCOS phenotypes in the subtypes. Limitations of our study include the potential effect of referral bias in our academic medical center–based PCOS cohort so our findings may not accurately reflect the general PCOS population (39). In addition, we did not include prospective data, therefore, long-term health outcomes could not be assessed. Finally, we did not validate the clusters using uncorrelated biomarkers, as we did in our original publication (8). However, we plan GWAS to assess whether the subtypes remain associated with distinct genetic loci in the current cohort ascertained by Rotterdam criteria.
In conclusion, we were able to replicate the 3 PCOS subtypes, reproductive, metabolic, and background, in a large cohort of girls and women with PCOS fulfilling the Rotterdam criteria. Importantly, we show that additional traits not used for clustering differ significantly among the subtypes and align with the reproductive and metabolic pathways implicated. Our findings suggest that these PCOS subtypes have different underlying etiologies and clinical characteristics. The applicability of our findings is 2-fold. First, clustering will enable the data-driven diagnosis of PCOS. Second, the identification of mechanistically distinct subtypes will allow precision-medicine approaches to screening, therapy, and prevention of adverse health outcomes.
Acknowledgments
The authors would like to acknowledge the girls and women who participated in the study.
Funding
This work was supported by the foundation for the National Institutes of Health (reference No. R01 HD100812).
Disclosures
A.D. is a consultant for Quest Diagnostics, Inc and AcaciaBio, Inc. J.S.E.L. reports grants from Ansh Labs, Ferring, Roche Diagnostics, Merck, and personal fees from Ferring, Titus Healthcare, Gedeon Richter, Ansh Labs, from Roche Diagnostics, and is an unpaid board member and president of the AE-PCOS Society, and a member of the ASRM outside the submitted work. J.A.V. has received royalties from AMH assays, paid to the institute/laboratory with no personal financial gain. Y.V.L. received an internal research grant from the Erasmus MC (The Synergy grant) and she received fees from Ferring and Merck for presentations. The other authors do not have any conflicts of interest to declare.
Data Availability
Some or all data sets generated during and/or analyzed during the current study are not publicly available but are available from the corresponding author on reasonable request.
References
Abbreviations
- Adion
androstenedione
- AMH
anti-Müllerian hormone
- BMI
body mass index
- Chol
cholesterol
- CVD
cardiovascular disease
- DBP
diastolic blood pressure
- DHEA
dehydroepiandrosterone
- DHEAS
dehydroepiandrosterone sulfate
- E2
estradiol
- FSH
follicle-stimulating hormone
- Glu0
glucose
- GWAS
genome-wide association study
- HA
hyperandrogenism
- HC
hierarchical clustering
- HDL
high-density lipoprotein
- Ins0
insulin
- LC-MS/MS
liquid chromatography–tandem mass spectrometry
- LDL
low-density lipoprotein
- LH
luteinizing hormone
- mFGs
modified Ferriman Gallwey score
- NIH
National Institutes of Health
- OD
ovulatory dysfunction
- PCA
principal component analysis
- PCOM
polycystic ovarian morphology
- PCOS
polycystic ovary syndrome
- SBP
systolic blood pressure
- SHBG
sex hormone–binding globulin
- T
testosterone
- TFC
total follicle count
- TG
triglycerides
- TSH
thyroid-stimulating hormone
Author notes
Kim van der Ham and Loes M. E. Moolhuijsen share first authorship of this work.
Yvonne V. Louwers and Jenny A. Visser share last authorship of this work.
