


Abstract
The tumor microenvironment (TME) includes diverse cellular components such as mesenchymal stem cells (MSCs) and immune cells, among others. MSC have been isolated from different tumors and they favor tumor cell growth; however, their role in pituitary tumors (PTs) remains unknown.
Herein we report the presence of MSCs in 2 adrenocorticotropin (ACTH)-secreting PTs causing Cushing disease (MCU), 2 nonfunctioning adenomas of gonadotrope differentiation (MNF), and 2 nontumoral pituitary glands (MS).
We have analyzed the transcriptomic profiles by RNA sequencing and compared MSCs in terms of their immunosuppressive effects against lymphoid T-cell and macrophage populations by means of cocultures and flow cytometry.
Our transcriptomic analysis revealed molecular differences between MSCs derived from nontumoral pituitaries and MSCs derived from PTs. Two distinct subpopulations of MSC emerged: one displaying immunosuppressive properties and the other with increased proproliferative capabilities, regardless of their origin. MSCs derived from ACTH- and nonfunctioning PTs, but not those derived from nontumoral glands, significantly inhibited the proliferation of activated T cells, favored the generation of regulatory T cells, and promoted M2 macrophage polarization. Such immunosuppressive effects were correlated with an upregulation of programmed death ligand 1 and intracellular expression of macrophage colony-stimulating factor (M-CSF) and interleukin-10. Importantly, MSC derived from ACTH-PTs showed a higher immunosuppressive potential than MSC isolated from nonfunctioning tumors.
This study demonstrates the presence of at least 2 MSC subpopulations in the pituitary gland and suggests that immunosuppressive effects of MSCs may have important implications in PT growth.
The tumor microenvironment (TME) comprises diverse cellular components including immune cells such as regulatory T cell (Treg) lymphocytes and M2 macrophages, fibroblasts, pericytes, and endothelial cells as well as mesenchymal stem cells (MSCs), (1). MSCs are a heterogeneous population of plastic-adherent, spindle-shaped cells that are capable of differentiating into various lineages (2). To be considered MSCs, markers such as CD105, CD73, and CD90 must be highly expressed by the cell population, whereas CD45, CD34, CD11b, CD14, CD19, CD79a, and histocompatibility leukocyte antigen-DR isotype (HLA-DR), should be present in less than 2% (3). MSCs have the ability to differentiate into chondrocytes, osteoblasts, and adipocytes in vitro (4). These cells have been found in gastric, prostate, breast, and cervical cancers, whereby they promote tumor progression through immune suppression (5, 6).
Pituitary tumors (PTs) constitute a heterogeneous group of epithelial neoplasms comprising both functioning and nonfunctioning lesions (7, 8). Functioning PTs include prolactin (PRL)-, growth hormone (GH)-, adrenocorticotropin (ACTH)-, and thyrotropin (TSH)-secreting tumors (7, 8). GH-, PRL-, and TSH-secreting tumors also immunostain for the transcription factor POU1F1, whereas ACTH lesions do so for TBX19 (7, 8). Clinically nonfunctioning PTs do not produce a hormonal hypersecretion syndrome, yet more than two-thirds of them are of gonadotrope differentiation since they immunostain for gonadotropin α-subunit and/or β-luteinizing hormone or β-follicle-stimulating hormone, as well as for the transcription factor NR5A1 (7, 8). MSCs have previously been isolated from 3 GH-producing and 3 nonfunctioning tumors (9) as well as from 2 nonfunctioning PTs, 2 GH-, and 3 PRL-producing lesions (10). Both reports characterized MSCs by flow cytometry and immunofluorescence and demonstrated their adipogenic, osteogenic, and chondrogenic differentiation potential (10). To our knowledge, the presence of MSC in nontumoral pituitary tissue has not been sought and information regarding the role they play in PT biology is rather scarce since no functional studies have ever been conducted. In the present study we isolated and immunologically and transcriptomically characterized MSC from ACTH-producing (MCU) and nonfunctioning pituitary (MNF) tumors of gonadotrophic differentiation as well as from nontumoral pituitaries (MS). We also performed functional studies trying to ascertain the effect of MSC on T-cell proliferation, Treg generation, macrophage polarization, and phagocytosis.
Materials and Methods
Isolation and Culture of Mesenchymal Stem Cells
MSCs were isolated and cultured from 8 PTs (6 gonadotroph-derived nonfunctioning and 2 ACTH-secreting tumors), collected at surgery, and from 2 nontumoral pituitaries obtained from autopsies performed within 12 hours of death, as well as from the bone marrow (BM) of 4 healthy donors (11). All participating patients signed an informed consent, in compliance with the Helsinki Declaration, and the study protocol was approved by the institutional ethics and scientific committees of the Instituto Mexicano del Seguro Social (R-2022-3601-186 and R-2019-785-052).
The following were our selection criteria: male or female aged 18 years or older with complete clinical, biochemical, and imaging information, with a full histopathological and immunohistochemical evaluation of the PT, and enough fresh tumor available at the time of surgery. Control pituitary glands were used only if they did not show any cellular or histological alteration on examination by our pathologists.
Pituitary tissues were transported in low-glucose–Dulbecco’s modified Eagle’s medium (DMEM) (lg DMEM) (Cytiva) supplemented with 10% fetal bovine serum (FBS, Gibco) and processed immediately. Tissues were fragmented into sections no larger than 0.5 cm3, washed with 1× phosphate-buffered saline (PBS) (Biowest), and placed in 35-mm dishes (Corning) with lg-DMEM supplemented with 15% FBS. The medium was changed every week, and when the samples reached 80% confluence and colony-forming units could be clearly identified, they were harvested with 1× trypsin (Biowest), counted, and 10 000 cells were seeded in 100-mm tissue culture (TC) dishes (Corning) in lg-DMEM supplemented with 10% FBS, 1× L-glutamine (Biowest), 1× penicillin/streptomycin (Biowest), and 100 mg/L gentamicin (Biowest). This procedure was performed starting from the third passage, with medium changes twice a week. The cell samples were used at passages between 3 and 5.
Immunophenotype Evaluation of Mesenchymal Stem Cells
The evaluation of membrane markers in MSCs was performed according to a previously described protocol (11), using the following specific monoclonal antibodies: BV421 mouse antihuman CD105 (BD Biosciences catalog No. 563920, RRID:AB_2722606); PE-Cy5 mouse antihuman CD90 (BD Biosciences catalog No. 555597, RRID:AB_395971); PE-Cy7 mouse antihuman CD73 (BD Biosciences catalog No. 561258, RRID:AB_10643764); APC mouse antihuman CD13 (BD Biosciences catalog No. 557454, RRID:AB_398624); fluorescein isothiocyanate (FITC) mouse antihuman HLA-ABC (BD Biosciences catalog No. 555552, RRID:AB_395935); APC mouse antihuman CD34 (BD Biosciences catalog No. 555824, RRID:AB_398614); PE mouse antihuman CD45 (BD Biosciences catalog No. 555483, RRID:AB_395875); PE mouse antihuman CD14 (BD Biosciences catalog No. 555398, RRID:AB_395799); FITC mouse antihuman CD31 (BD Biosciences catalog No. 555445, RRID:AB_395838); and PE/Cyanine7 antihuman HLA-DR (BioLegend catalog No. 307616, RRID:AB_493588).
Morphological Evaluation
To evaluate morphology, 7000 cells were seeded in 35-mm TC dishes (Corning). At 70% confluence, cells were stained with Wright's stain (Sigma-Aldrich) and evaluated under a phase-contrast microscope (Zeiss).
Differentiation Capacity Assay
The evaluation of adipogenic, osteogenic, and chondrogenic differentiation capacity of MSCs was performed using previously described protocols (6, 11). Adipogenic differentiation was evidenced by the identification of lipid vacuoles stained with oil red O reagent (Sigma-Aldrich). Osteogenic differentiation was determined by alkaline phosphatase activity using the SIGMA FAST BCIP/NBT (5-bromo-4-chloro-3-indolylphosphate/nitroblue tetrazolium) reagent (Sigma-Aldrich). Chondrogenic differentiation was evaluated by the presence of extracellular matrix using Alcian blue staining (Sigma-Aldrich).
Proliferation Capacity of Mesenchymal Stem Cells
A total of 10 000 MSCs were seeded in the Lab-Tek Chamber Slide system, 0.8 cm2/well (Merck) for immunofluorescence, with lg-DMEM 10% FBS. Click-iT EdU coupled with Alexa Fluor 488 fluorochrome was added according to the manufacturer's instructions (Invitrogen). The immunofluorescence staining procedure was performed according to the manufacturer's instructions. Images were obtained on a Nikon Ti Eclipse inverted confocal microscope (Nikon Corp) using NIS Elements v.4.50. Imaging was performed using a 20× (dry, NA 0.8) objective lens. Zoom was performed at 3.4×. Images were analyzed using FIJI ImageJ Software.
Apoptosis Assay: Viability Evaluation of Mesenchymal Stem Cells in Culture
A total of 20 000 MSCs were cultured in 48-well TC plates (Corning) with lg-DMEM 10% FBS, and the negative population for phosphate iodide (PI) and FITC antiannexin V was evaluated to obtain viable cells according to the manufacturer's conditions (Invitrogen). Acquisitions were made on a spectral flow cytometer Aurora (Cytek Biosciences) and analyzed with FlowJo v10.
CD3+ T-Cell Isolation
Peripheral blood mononuclear cells (PBMCs) were obtained from healthy donors using density gradient (Lymphopred, Axis-Shield). Positive enrichment was performed using beads (Miltenyi) according to the manufacturer’s instructions. They were maintained in RPMI medium (Biowest) (RPMI 1640, 10% FBS, 2 mM L-glutamine, 100 U/mL penicillin, 100 μg/mL streptomycin, and 100 μg/mL gentamicin) until use.
Pituitary-Derived Mesenchymal Stem Cell Effect on T Cells: Proliferation Assay
MSCs derived from PTs and nontumoral gland and T lymphocytes were cocultured as follows: MSC/CD3+ T cells in direct cell contact (in a 1:1 ratio) in 48-well TC plates (Corning) with lg-DMEM/RPMI 10% FBS. T cells were stained with carboxyfluorescein succinimidyl ester (CFSE) (2.5 µM) before stimulation with anti-CD2/CD3/CD28 beads (Miltenyi) at a 1:1 ratio. As a positive control, stimulated T cells were cultured in the absence of MSCs, considered as 100% proliferation response for each T-cell donor. On the fifth day, cells were collected and staining data were acquired with a spectral flow cytometer Aurora (Cytek Biosciences). T-cell populations were detected using the following antibodies: APC mouse antihuman CD3 (Biogems catalog No. 05131-80, RRID:AB_3083037), PE-Cy5 mouse antihuman CD4 (BD Biosciences catalog No. 555348, RRID:AB_395753), and PE mouse antihuman CD8 (BD Biosciences catalog No. 555635, RRID:AB_395997). CFSE levels in stimulated cells were analyzed. All data were analyzed using FlowJo v10 (Ashland) software.
Pituitary-Derived Mesenchymal Stem Cell Effect on T Cells: Regulatory T-Cell Generation Assay
MSCs derived from PTs and nontumoral gland and T lymphocytes were cocultured as follows: MSC/CD3+ T cells were in direct cell contact (in a 1:1 ratio) in 48-well TC plates (Corning) with lg-DMEM/RPMI 10% FBS. T cells were stimulated with anti-CD2/CD3/CD28 beads (Miltenyi) at a 1:1 ratio. The generation of stimulated Treg lymphocytes in the absence of MSCs was considered the positive control, and the basal generation of T lymphocytes without stimulation and without MSCs was considered the negative control. On the fifth day of coculture, lymphocytes were harvested and stained with PE-Cy5 mouse antihuman CD4 and PE mouse antihuman CD25 (BD Biosciences catalog No. 555432, RRID:AB_395826) antibodies. Subsequently, the cell membrane was permeabilized using the FOXP3 staining buffer set (Invitrogen), according to the manufacturer's instructions, and PE-Cyanine7 mouse antihuman FOXP3 (Thermo Fisher Scientific catalog No. 25-4777-42, RRID:AB_2573450) antibodies were added. Acquisitions were made on a spectral flow cytometer Aurora and analyzed with FlowJo v10 software.
PD-L1 Expression in Mesenchymal Stem Cell Assay
MSCs derived from PTs and nontumor gland and T lymphocytes were cocultured as follows: MSC/CD3+ T cells were in direct cell contact (in a 1:1 ratio) in 48-well TC plates (Corning) with lg-DMEM/RPMI 10% FBS. T cells were stimulated with anti-CD2/CD3/CD28 beads (Miltenyi) at a 1:1 ratio. MSCs were stained with PE mouse antihuman PD-L1 (BD Biosciences catalog No. 557924, RRID:AB_647198) and APC mouse antihuman CD3 antibodies (Biogems), and then fixed with 1× paraformaldehyde (BD Biosciences). The percentage of basal PD-L1 expression in unstimulated MSCs without T cells was considered the control. PD-L1 expression in MSCs was analyzed by flow cytometry on the fifth day of coculture. Acquisitions were made on a spectral flow cytometer Aurora (Cytek Biosciences) and analyzed with FlowJo v10 software.
Isolation of CD14+ Monocytes
CD14+ monocytes were obtained from PBMCs of healthy adult donors. PBMCs were obtained using a density gradient with Lymphoprep at a density of 1.077 ± 0.001 g/mL (STEMCELL Technologies). CD14+ cells were isolated from PBMCs using negative magnetic selection with Micro Beads and MACS LS columns (Miltenyi Biotec) following the protocol provided by the supplier. These cells were incubated in RPMI-1640 medium (HyClone) supplemented with 10% FBS (Gibco), 2 mM L-glutamine (Biowest), 1× penicillin/streptomycin (Biowest), and 100 μg/mL gentamicin (Biowest) until use.
Pituitary-Derived Mesenchymal Stem Cell Effect on Monocytes: Macrophage Polarization Assay
Macrophages were polarized toward an M1 phenotype by culturing them in a medium consisting of 45% RPMI-1640 medium (HyClone), 45% lg-DMEM (HyClone), and 10% FBS (Gibco) with M1-inducing medium 1 (M1), containing granulocyte-macrophage colony-stimulating factor (50 ng/mL) (Miltenyi Biotec), for 96 hours. Then, the medium was removed, and lipopolysaccharides (100 ng/mL) (Miltenyi Biotec) and interferon-γ (50 ng/mL) (Peprotech) were added, and the cells were incubated for 48 hours. To induce M2 polarization, cells were cultured in a medium consisting of 45% RPMI-1640 medium (HyClone), 45% lg-DMEM (HyClone), and 10% FBS (Biowest) with M2-inducing medium 2 (M2), containing macrophage colony-stimulating factor (M-CSF) (50 ng/mL) (Peprotech), for 96 hours. Then, the medium was removed, and a new medium containing interleukin 4 (Peprotech) (50 ng/mL) and interleukin 13 (IL-13) (40 ng/mL) (Peprotech) was added, and the cells were incubated for 48 hours. To evaluate the exclusive effect of MSCs on macrophage polarization, CD14+ monocytes were cultured without cytokines in the absence of inducing medium (M0).
CD14+ monocytes were cocultured for 6 days in the presence or absence of BM, MS, MCU, or MNF-MSC at a 5:1 ratio (CD14+:MSC) either in a cell-to-cell contact system or in a Transwell system with a 0.4-μm pore size (Corning). The cocultures were maintained in the absence (control, M0) or presence of M1 or M2.
Pituitary-Derived Mesenchymal Stem Cell Effect on Monocytes: Macrophage Immunophenotype
The membrane markers of macrophages were evaluated by flow cytometry 6 days after initiating the treatments described earlier. Macrophages were washed with 1× PBS (Biowest) and blocked with FBS (Biowest) at 4 °C for 10 minutes. After blocking with FBS, antibodies were added to detect the characteristic markers of the M1 macrophage population: PE mouse anti-human CD80 (BD Biosciences catalog No. 557227, RRID:AB_396606) and PE/Cyanine7 mouse antihuman HLA-DR antibodies. To detect the M2 macrophage population, BV510 mouse antihuman CD14 (BioLegend catalog No. 301842, RRID:AB_2561946), FITC mouse antihuman CD163 (BioLegend catalog No. 333618, RRID:AB_2563094), and PE-Cy5 mouse antihuman CD206 antibodies (BD Biosciences catalog No. 551136, RRID:AB_394066) were added. After adding the antibodies, the cells were incubated at 4 °C for 20 minutes. Then, the cells were fixed with 1× paraformaldehyde (BD Bioscience) at 4 °C for 10 minutes and washed with PBS. Acquisitions were made on a spectral flow cytometer Aurora (Cytek Biosciences) and analyzed with FlowJo v10 software. Macrophages cultured in the absence of MSCs and under different induction conditions were used as controls. The calculation of M1 and M2 polarization was obtained by individual experiments to determine the fold change (compared to the control without MSCs) in the mean fluorescence intensity of positive expression of membrane molecules characteristic of M1 or M2 polarization in macrophages cocultured in cell-to-cell contact for 6 days in vitro.
Pituitary-Derived Mesenchymal Stem Cell Effect on Monocytes: Intracellular Marker Evaluation
After 6 days of direct coculture between MSCs and macrophages, the cocultures were treated with Golgi Stop reagent (BD Biosciences) to inhibit protein transport and evaluate intracellular molecules. After 5 hours of treatment, the cocultures were washed with 1× PBS and blocked with FBS (Biowest) at 4 °C for 15 minutes. After blocking, FITC mouse antihuman CD45 antibodies (BD Biosciences catalog No. 555482, RRID:AB_395874) were added, followed by incubation at 4 °C for 20 minutes and washing with 1× PBS (Biowest). The cell membrane was permeabilized following the instructions of the FOXP3 staining buffer set (Invitrogen). For macrophage evaluation, BV421 rat antihuman IL-10 (BioLegend catalog No. 501422, RRID:AB_2632952) and PE mouse antihuman indoleamine 2,3-dioxygenase (IDO) (R and D Systems catalog No. IC6030P, RRID:AB_3083038) antibodies were added. For MSC evaluation, BV421 rat antihuman IL-10 and PE mouse antihuman M-CSF (R&D Systems catalog No. IC2161P, RRID:AB_357294) antibodies (R&D Systems) were added. Acquisitions were made on a spectral flow cytometer Aurora (Cytek Biosciences) and analyzed with FlowJo v10 software.
Pituitary-Derived Mesenchymal Stem Cell Effect on Monocytes: Phagocytosis Capacity Assay
Macrophages were cocultured together with MSCs in a 0.4-µm Transwell system (Corning). The macrophages were seeded in the lower well of a Transwell and cultured in the presence of cytokines favoring M0, M1, or M2 polarization for 6 days; after incubation with polarization media they were challenged for 45 minutes with Escherichia coli bioparticles from the pHrodo kit (Invitrogen) and treated as indicated following the supplier's instructions, the cocultures were washed with 1× PBS and blocked with FBS (Biowest) at 4 °C for 10 minutes. After blocking, PE mouse antihuman CD45 (BD Biosciences catalog No. 560975, RRID:AB_2033960) and PE/Cyanine7 antihuman HLA-DR (BioLegend) antibodies were added, followed by incubation at 4 °C for 20 minutes and washing with 1× PBS (Biowest). Subsequently, the cells were fixed with 1× paraformaldehyde for 10 minutes at 4 °C, washed with 1× PBS, and evaluated by flow cytometry. Acquisitions were made on a spectral flow cytometer Aurora (Cytek Biosciences) and analyzed with FlowJo v10 software. Macrophages cultured in the absence of MSCs and under different polarization conditions were used as controls.
Regulatory T-Cell Generation by Macrophages Previously Cocultured With Mesenchymal Stem Cells
Macrophages previously cocultured with MSCs without cell-to-cell contact were retrieved, seeded, and cocultured with activated CD4+ T lymphocytes at a 1:1 ratio (macrophages:CD4+ T lymphocytes) in RPMI medium (HyClone) containing 10% FBS (Biowest) in the presence of M0-, M1-, or M2-inducing medium. After 5 days of coculture, T lymphocytes were harvested, washed, and blocked with FBS (Biowest) at 4 °C for 15 minutes After blocking, FITC mouse antihuman CD4 (BD Biosciences catalog No. 555346, RRID:AB_395751) and PE mouse antihuman CD25 antibodies (BD Biosciences catalog No. 555432, RRID:AB_395826) were added. Then, the cells were permeabilized following the supplier's instructions with the FoxP3 staining buffer set (Invitrogen). After permeabilization, PE-Cyanine7 mouse antihuman FoxP3 antibodies (eBioscience) were added. Acquisitions were made on a spectral flow cytometer Aurora (Cytek Biosciences) and analyzed with FlowJo v10 software. CD4+ T lymphocytes cultured in the absence of macrophages were used as a control.
RNA Purification
Total RNA was extracted from PT using the miRNAeasy Mini Kit (Qiagen Inc) according to manufacturer's instructions. Tissue samples were disrupted and homogenized in 700-μL Qiazol Lysis Reagent. They were then incubated at room temperature for 5 minutes. Next, 200 μL of chloroform was added, and samples were incubated at room temperature for 3 minutes. The mixture was centrifuged at 12 500 rpm for 15 minutes at 4 °C. The aqueous phase was transferred to a fresh tube and mixed with an equal volume of 70% ethanol. Samples were then transferred to an RNAeasy Column in a 2-mL tube and centrifuged at 10 000 rpm for 15 seconds. After centrifugation, 700 μL of RW1 buffer was added and the mixture was centrifuged at 10 000 rpm for 15 seconds. Flow-through was discarded and 500 μL of RPE buffer was added to the membrane and then centrifuged at 10 000 rpm for 15 seconds (2×). The column was transferred to a new collection tube adding 30 μL of RNAse free water and centrifuged for 1 minute at 10 000 rpm. RNA was quantified using a Nanodrop-ND-1000 spectrophotometer (Thermo Scientific); RNA integrity was evaluated by a Bioanalyzer 2100 (12).
Whole RNA Sequencing
The RNA integrity of each sample was assessed using an R1 RNA Cartridge for QSep 400 (BiOptic); RNA concentration was measured with the Qubit RNA HS Assay Kit (Invitrogen) and purity was analyzed with a NanoDrop 1000 (Thermo Fisher Scientific). Transcriptome libraries were prepared with the TruSeq Stranded Total RNA Library Prep with Ribo-Zero Gold (Illumina). Fragmentation times were adjusted based on RIN. Transcriptome libraries were quantified with the Qubit dsDNA HS Assay Kit (Invitrogen), libraries size was analyzed by the S2 Standard DNA Cartridge for QSep 400 (BiOptic), and sequencing was performed using a NovaSeq 6000 (Illumina) in a 150 bp pair-end configuration.
FastQC and Preprocessing
A quality assessment of the metagenomic and RNA sequencing and exome libraries was performed with FastQC (Babraham Bioinformatics). All raw sequences passed the initial quality filter. Adapters were removed and a quality and length filter were performed with Trimmomatic 0.40.
Differential Gene Expression
Preprocessed reads were aligned using STAR against the human reference sequence (hg38). Once the BAM files were obtained, the HT-Seq package was used to estimate gene expression where a count table is obtained that can be used to perform a differential expression analysis. Statistical analysis of differential expression among the groups was performed using the DESeq2 R package, version 2.13 (R Foundation for Statistical Computing). The false discovery rate was set at less than 0.01 and a threshold normalized absolute log 1.5-fold change greater than 1.0. To exclude genes with low counts across libraries, a CPM filter was set to 1, using TPM (transcripts per kilobase million) as the normalization method along with weighted trimmed mean of M values. The original data generated by this study, including the normalized RNA counts, and the statistical analysis have been uploaded to the Gene Expression Omnibus from the National Center for Biotechnology Information (GEO-NCBI) (13).
Statistical Analysis
Variables are expressed as means with SDs, according to data distribution. The Kruskal-Wallis H test was used, followed by the post hoc U-Mann-Whitney test to determine statistically significant differences. A P value less than .05 was considered statistically significant. The statistical package consisted of SPSS Statistics v21.0.
Results
Pituitary Tissue–Derived Mesenchymal Stem Cell Characterization: Immunophenotype and Differentiation Capacity
MSCs were successfully isolated and immunophenotyped from 2 nontumoral pituitary glands (MS), 2 ACTH-secreting (MCU), and 6 nonfunctioning tumors (MNFs). These plastic-adherent, spindle-shaped cells positively immunostained for CD105, CD90, CD73, CD13, and HLA-ABC, which are MSC markers, and were negative for HLA-DR, CD45, CD34, CD14, and CD31 which are hematopoietic and endothelial markers (Fig. 1A). The isolated MSCs showed fibroblast morphology; adipogenic differentiation capacity, which was evidenced by oil red staining of lipid vacuoles; osteogenic differentiation demonstrated by the presence of alkaline phosphatase activity; and chondrogenic differentiation demonstrated by the presence of extracellular matrix stained with Alcian blue (Fig. 1B).
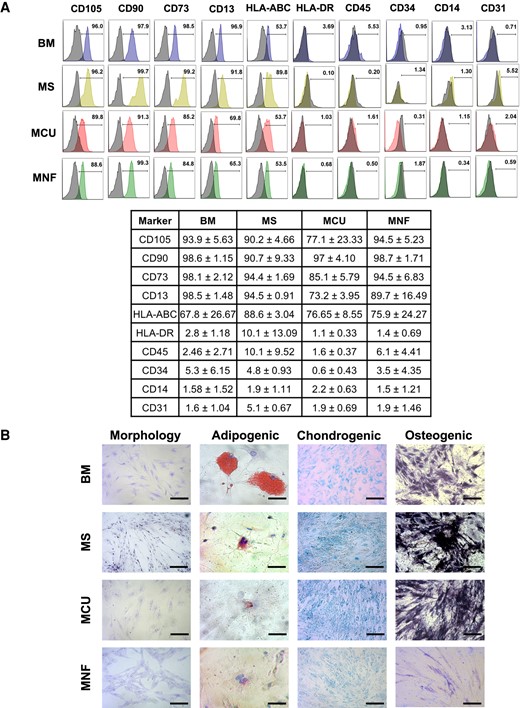
A, Characterization of mesenchymal stem cells (MSCs) isolated from adrenocorticotropin-secreting (MCU) and nonfunctioning pituitary tumors (MNFs), as well as from nontumoral pituitary gland (MS) and normal bone marrow (BM) by flow cytometry using specific markers. Pituitary MSCs showed expression of CD105, CD90, CD73, CD13 and HLA-ABC, whereas they are negative for HLA-DR, CD45, CD34, CD14 and CD31. B, Representative MSC morphology (observed with Wright stain; bar size 100 µm), as well as adipogenic (observed with oil red O; bar size 200 µm), chondrogenic (observed with Alcian blue; bar size 100 µm), and osteogenic (observed by alkaline phosphatase reaction; bar size 100 µm) differentiation capacity of the isolated pituitary MSCs.
Mesenchymal Stem Cell Transcriptome Reveals 2 Cell Populations
Compared to MS, MCUs and MNFs showed 339 differentially expressed genes, of which 237 were upregulated and 102 downregulated (Fig. 2A). Among these differentially expressed genes, we found those encoding proteins involved in leukocyte transendothelial migration such as CXCL12 (C-X-C motif chemokine 12), and in chemokine signaling, such as CXCR6 (C-X-C chemokine receptor 6, also known as CD186), as well as in stem cell pluripotency regulation such as MEIS1 (Meis homeobox 1) (Fig. 2B). Interestingly, MSCs derived from the 2 nonfunctioning tumors (MNFs) differed transcriptomically from each other, as did those derived from the 2 ACTH-secreting lesions (MCUs) (Fig. 2C). These prompted us to carry out whole-transcriptome analysis that corroborated the previously observed differences between MSCs from the same group. Immune-related genes such as those encoding interleukins 6 and 7 (IL-6 and IL-7) PTGS2 (prostaglandin synthase 2), CCL2 (C-C motif chemokine ligand 2), and ICAM1 (intercellular adhesion molecule, also known as CD54) were differentially expressed regardless of the tissue of origin of the MSCs, be it nontumoral or tumoral. In general, MSCs clustered in 2 groups (Fig. 2D). Group 1 comprised 1 MS, 1 MNF, and 1 MCU, with higher levels of immunosuppressive genes. Group 2, which comprised the other MS, MNF, and MCU, showed low expression of immunosuppressive genes and high expression of genes encoding proteins involved in the regulation of cellular proliferation such as TP53 (tumor protein 53), BRCA1 (breast cancer susceptibility protein 1), CCNA2 (cyclin A2), CCNE2 (cyclin E2), CDK6 (cyclin-dependent kinase 6), and POLR2B (DNA-directed RNA polymerase II, subunit B) (Fig. 2E). Thus, transcriptomically, we found 2 distinct MSC populations among tumoral and nontumoral pituitary tissues, one with more proliferative capabilities and the other with more immunosuppressive potential, although both cell populations showed immunomodulatory activity.
![A, Hierarchical cluster using differentially expressed genes in mesenchymal stem cells (MSCs) isolated from pituitary tumors (adrenocorticotropin-secreting [MCU] and nonfunctioning pituitary [MNF]) when compared to nontumoral pituitary gland MSC (MS) showing 237 upregulated and 102 downregulated genes. Differential gene expression was found between MSCs isolated from tumors of the same type. B, Enrichment results from the differentially expressed genes in pituitary tumor-derived MSCs. C, Whole-transcriptome hierarchical clustering depicting the transcriptomic differences between MSCs isolated from the same tissue of origin. Two clusters are observed, each cluster contains one MCU, one MNF and one MS; D, one cluster showed more immune suppressive gene expression and E, the other more proliferative gene expression. F, MSC isolated from pituitary tissues expressed neither genes encoding anterior pituitary hormones nor pituitary transcription factors. G, EdU incorporation into DNA of proliferative cells; again, proliferation capabilities differentiate each other from MSCs derived from the same tumor lineage and from the nontumoral pituitary gland, corroborating the transcriptomic findings.](https://oup.silverchair-cdn.com/oup/backfile/Content_public/Journal/jcem/109/11/10.1210_clinem_dgae212/1/m_dgae212f2.jpeg?Expires=1750555437&Signature=dwg2s6nrqi2OhAPWLcCmeoVd50JopzHbUZNqGIVPehSol8cDn0bxmQ-E-rqBMrZqPYxw6kTkCHKoxCTlINB0hwGQT0tjVsO5u~bfoIuCRL4AGPitlmnQo38HeNsJq3fugaFAS5bCFzDE-CvwgjkvnqrMHslyd2SWVU6-Wm4O7imqaiXernvm5vKon9M~gv25E724Uc~IdvXdGuX84Bs9~QwMz9C~FTR5a80oEhYMQshxvI0EZn4AdGc08AY31fvZGOwgIOue6ZgVd4ixInufu6DnaDzpQNlsj8GpT3w8O1rsYBzt2jnAL98yWKPuEbXEBm4hCqxEZ09Z5vP7k02aYA__&Key-Pair-Id=APKAIE5G5CRDK6RD3PGA)
A, Hierarchical cluster using differentially expressed genes in mesenchymal stem cells (MSCs) isolated from pituitary tumors (adrenocorticotropin-secreting [MCU] and nonfunctioning pituitary [MNF]) when compared to nontumoral pituitary gland MSC (MS) showing 237 upregulated and 102 downregulated genes. Differential gene expression was found between MSCs isolated from tumors of the same type. B, Enrichment results from the differentially expressed genes in pituitary tumor-derived MSCs. C, Whole-transcriptome hierarchical clustering depicting the transcriptomic differences between MSCs isolated from the same tissue of origin. Two clusters are observed, each cluster contains one MCU, one MNF and one MS; D, one cluster showed more immune suppressive gene expression and E, the other more proliferative gene expression. F, MSC isolated from pituitary tissues expressed neither genes encoding anterior pituitary hormones nor pituitary transcription factors. G, EdU incorporation into DNA of proliferative cells; again, proliferation capabilities differentiate each other from MSCs derived from the same tumor lineage and from the nontumoral pituitary gland, corroborating the transcriptomic findings.
The proliferation differences observed by transcriptome analysis were confirmed at the cellular level by the nuclear incorporation of EdU staining (Fig. 2G). The apoptosis rate was low for all MSC samples, which means that proliferation differences were due to distinct molecular cell profiles rather than cell viability or death (Supplementary Fig. S1). Neither MS nor tumor-derived MSCs showed any of the pituitary lineage markers, as they did not express any of the pituitary hormones or transcription factors (NR5A1, TBX19, and POU1F1) (Fig. 2F).
Mesenchymal Stem Cell and Clinical Phenotype
Based on our in vitro experiments, we defined 2 distinct MSC populations: one with a predominantly immunosuppressive effect (derived from MCU06, MNF09, and MS10) and the other with a predominant proliferative effect (MCU07, MNF12, and MS11). On comparing predominantly immunosuppressive vs predominantly proliferative MSCs derived from ACTH-secreting tumors, the former (MCU06) had significantly lower UFC concentrations than the latter (MCU07). As for the nonfunctioning tumors (MNF09-immunosuppressive and MNF12-proliferative), we did not find any significant differences pertaining to clinical or tumoral (tumor size and invasiveness) characteristics. Neither morphological nor histological abnormalities were found in the nontumoral pituitaries used as controls. Table 1 summarizes the clinical, biochemical, and imaging features of the patients whose tumors were used to isolate MSCs.
Clinical, hormonal and imaging characteristics of patients, stratified according to predominant mesenchymal cell phenotype
| Age/Sex | Maximum tumor diameter, mm | CSI | Visual abn. | Hormonal information | Predom. MSC phenotype | |
|---|---|---|---|---|---|---|
| MCU06 CD | 27/female | 10 | No | None | UFC 284 µg/d | Immunosuppressive |
| MNF09 NFPA | 46/male | 29 | Yes | Right temporal hemianopia | GH and TSH deficiency | Immunosuppressive |
| MCU07 CD | 19/female | 8 | No | None | UFC 1204 µg/d | Proproliferative |
| MNF12 NFPA | 50/female | 29 | Yes | Bitemporal hemianopia | No deficiencies | Proproliferative |
Abbreviations: CD, Cushing disease; CSI, cavernous sinus invasion; GH, growth hormone; MSC, mesenchymal stem cell; NFPT, nonfunctioning pituitary tumors; TSH, thyrotropin; UFC, urinary free cortisol.
Pituitary Tumor–Derived Mesenchymal Stem Cells Reduce T-Cell Proliferation and Induce Regulatory T-Cell Lymphocyte Polarization and PD-L1 Expression
Coculture of MCU and MNF with peripheral blood lymphocytes resulted in the inhibition of proliferation of CD3+ T cells (67.4 ± 21.44% and 79.4 ± 11.04%, respectively; P < .05), CD4+ T cells (77.8 ± 28.30% and 78.4 ± 10.47%, respectively; P < .05), and CD8+ T cells (45.7 ± 20.31% and 57.5 ± 19.64%, respectively; P < .05), when compared to T cells activated with MS (CD3+: 108.5 ± 9.02%; CD4+: 120.2 ± 4.26%; P < .05). Interestingly, MS decreased the proliferation of CD8+ T lymphocytes (74.8% ± 9.19; P < .05) (Fig. 3A). T lymphocyte cocultured with MCUs efficiently acquired a Treg cell phenotype (43.4 ± 14.23%) compared to activated T cells cultured without MSCs (18.06% ± 3.89; P < .05) or cocultured with MS (19.7% ± 4.07; P < .05) (Fig. 3B).
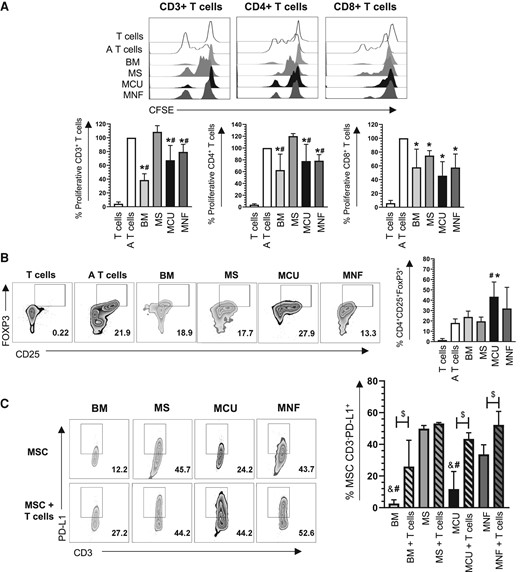
A, Representative histograms and bar graph with mean ± SD of normalized CD3+, CD4+, and CD8+ T-cell proliferation assessed using carboxyfluorescein succinimidyl ester (CFSE) staining. *Significant difference when compared to the control (A T cells). #Significant difference when compared to MS. B, Representative zebra plots and bar graphs with mean ± SD of the percentage of CD4 + CD25 + FoxP3+ cells generated in co-culture with mesenchymal stem cells (MSCs). *Significant difference when compared to the control (A T cells). #Significant difference when compared to MS. C, Representative zebra plots and bar graph with mean ± SD of the percentage of CD3-PD-L1+ MSCs in the presence or absence of T cells. &Significant difference when compared to MNF (without T cells). #Significant difference when compared to MS. $Significant difference compared with and without T cells. A T cells, activated T cells; BM, bone marrow; MCU, Cushing MSC; MNF, nonfunctional MSC; MS, normal pituitary gland MSC; T cells, nonactivated T cells. (P < .05); n = 4.
Following the confirmation of immunoregulatory capabilities of pituitary-derived MSCs, we evaluated the expression of PD-L1. MNF expressed higher levels of PD-L1 than MCU (33.6 ± 6.04% vs 11.7 ± 11.06%; P < .05) (Fig. 3C). However, PD-L1 expression was highest in MSC-derived nontumoral pituitary (49.9 ± 1.97% P < .05) (Fig. 3C). These results suggest that MNF and MCU have the ability to decrease the inflammatory response of T cells through the generation of Treg with a CD4 + CD25 + FoxP3 + phenotype, as well as increased expression of PD-L1.
Tumoral and Nontumoral Pituitary Gland–Derived Mesenchymal Stem Cells Induce M2 Macrophage Polarization
The capacity of MSCs to induce immunosuppressive (M2) or proinflammatory (M1) macrophages was evaluated by coculturing them with PBMC in cytokine- and chemokine-free medium to avoid factors that could favor polarization (M0) as well as M1- and M2-inducing medium. MSCs from the 3 evaluated sources decreased the expression of HLA-DR (fold change: MS 0.56 ± 0.22, MCU 0.32 ± 0.25, MNF 0.32 ± 0.21; P < .05) compared to monocytes/macrophages not exposed to MSCs, without affecting the expression of CD80 (Fig. 4A).
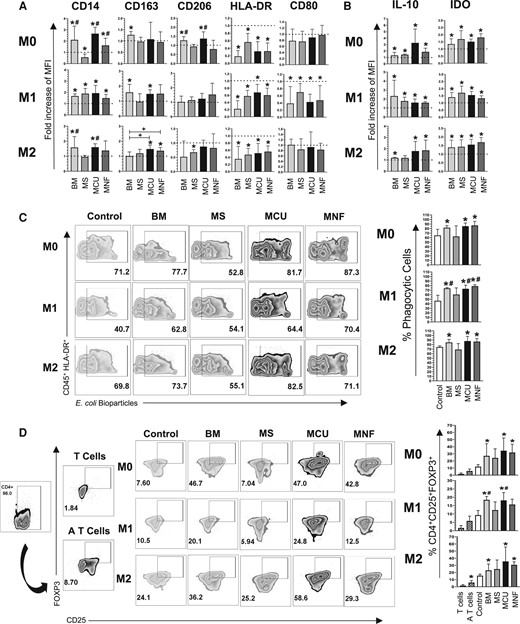
A, Bar graphs with mean ± SD of the fold change in the cell population positive for M1 markers HLA-DR, CD80, and M2 markers: CD14, CD163, CD206; in the presence of M0, M1, and M2 polarizing medium. B, Bar graphs with mean ± SD of the fold change in the cell population positive for intracellular markers IL-10 and IDO in the presence of M0, M1, and M2 polarizing medium. C, Representative zebra plots and bar graphs with mean ± SD of the percentage of CD45 + HLA-DR + cells capable of phagocytizing E coli in the presence of M0, M1, and M2 polarizing medium. D, Representative zebra plots and bar graphs with mean ± SD of CD4 + CD25 + FoxP3+ T reg cells generated in the presence of macrophages co-cultured with MSCs in the presence of M0, M1, and M2 polarizing medium. *Significant difference when compared to the control (macrophages without MSCs). #Significant difference compared to MS. +Significant difference compared to BM. BM, bone marrow MSC; IL-10, interleukin-10; MCU, Cushing MSC; MNF, nonfunctional MSC; MS, nontumoral pituitary gland; MSC, mesenchymal stem cell. (P < .05); n = 4. Dotted line indicates the control for the comparison of fold increase. M0, absence of inducer medium; M1, inducer medium for M1 polarization; M2, inducer medium for M2 polarization.
Coculturing of MNF and MCU with PBMC resulted in increased macrophage expression of molecules characteristic of M2 polarization, such as CD14 (fold change compared to control: MCU 2.66 ± 0.56, MNF 1.61 ± 0.60; P < .05), while MS decreased the expression of this marker (fold change compared to control: 0.56 ± 0.29; P < .05).
The expression of CD206 was increased by MCU but not by MNF or MS (fold change compared to control: 1.37 ± 0.37; P < .05), whereas the expression of CD163 was not modified by any of the isolated MSCs (see Fig. 4A).
We then evaluated the ability of MSCs to induce an immunosuppressive macrophage phenotype (M2) in the presence of proinflammatory molecules in the medium. Coculturing MSCs with peripheral blood monocytes/macrophages in the presence of proinflammatory molecules reduced the expression of M1 markers HLA-DR (fold change compared to control: MS 0.58 ± 0.15, MCU 0.68 ± 0.22, MNF 0.60 ± 0.19; P < .05) and CD80 (fold change compared to control: MS 0.70 ± 0.24, MCU 0.42 ± 0.21, MNF 0.47 ± 0.41; P < .05) (see Fig. 4A). In contrast, coculturing MS, MCU, and MNF in the presence of proinflammatory mediators resulted in an increased expression of the M2 marker CD14 (fold change compared to control: MS 1.89 ± 0.46, MCU 1.93 ± 0.68, MNF 1.49 ± 0.32; P < .05), while only MCU increased the expression of CD163 (fold change compared to control: 1.66 ± 0.42; P < .05). No difference was found in CD206 (see Fig. 4A).
Coculturing pituitary-derived MSCs with macrophages in the presence of M2-inducing molecules resulted in a reduced expression of HLA-DR (fold change compared to control: MS 0.47 ± 0.17, MCU 0.51 ± 0.27, MNF 0.56 ± 0.16; P < .05). Only MCU increased the expression of CD14 (fold change compared to control: 1.60 ± 0.23; P < .05). MCU and MNF, but not MS, increased the expression of CD163 (fold change compared to control: MCU 1.47 ± 0.26, MNF 1.36 ± 0.22; P < .05). MS, but neither MCU nor MNF, decreased CD206 expression (fold change compared to control: 0.74 ± 0.22; P < .05) (see Fig. 4A).
Pituitary Tumor–Derived Mesenchymal Stem Cells Induce M2 Macrophage Increased Function: Increased Phagocytosis and Interleukin-10 and Indoleamine 2,3-Dioxygenase–Induced Expression
We used the resulting polarized M2 macrophages from MSC cocultures to evaluate phagocytosis. MCU and MNF increased the percentage of phagocytic cells (85.26 ± 7.04%, 87.05 ± 8.775, respectively; P < .05) compared to the control (Fig. 4C) in the basal media. M1 and M2 challenges increased M2-polarized macrophage phagocytic capacity. In M1 media, the MCU- and MNF-derived M2 macrophages resulted in an increased phagocytic activity (MCU 73 ± 7.98%, MNF 78.76 ± 3.14%; P < .05) compared to the control (46.5 ± 12.17%; P < .05) and MS-derived M2 macrophages (60.32 ± 14.70%; P < .05) (Fig. 4C). In M2 media, the MCU- and MNF-derived M2 macrophages increased the percentage of phagocytic cells (87.63% ± 10.42, 86.45 ± 6.77, respectively; P < .05) compared to the control (see Fig. 4C). IL-10 and indoleamine 2,3-dioxygenase (IDO) expression was increased in macrophages when they were cocultured with pituitary-derived MSCs and exposed to M0, M1, and M2 challenges (Fig. 4B).
M2 Macrophages Polarized by Pituitary Mesenchymal Stem Cells Can Induce Regulatory T-Cell Phenotype: The Domino Effect
We evaluated the ability of the previously M2-polarized macrophages to generate Treg cell CD4 + CD25 + FoxP3+ populations. Again, we used the resulting polarized M2 macrophages from MSC cocultures with the 3 media, M0, M1, and M2 challenges. In the M0 and the M2 media, MCU- and MNF-derived M2 macrophages increased the percentage of CD4 + CD25 + FoxP3+ cells (M0 media: MCU 34.35 ± 17.88% MNF 31.82 ± 11.68%; P < .05) (M2 media: MCU 35.5 ± 20.20%, MNF 30.73 ± 4.33%; P < .05). In contrast, in the M1 media, only MCU-derived M2 macrophages increased the generation of Tregs (18.15 ± 4.62%; P < .05) compared to the control and MS (9.32 ± 2.7% and 12.33 ± 4.88%, respectively; P < .05) (Fig. 4D). These results indicate that PT-derived MSCs, particularly MCU, enhance the functional capacity of M2 macrophages.
Increased Adrenocorticotropin-Secreting Tumor and Nonfunctional Mesenchymal Stem Cell Interleukin-10 Expression When Cocultured With Macrophages
Tumoral (MCU and MNF) and nontumoral (MS) MSCs show the same level of IL-10 and M-CSF expression when cultured by themselves (Fig. 5A). Interestingly, when cocultured with macrophages, MCU and MNF, but not MS, increased their IL-10 expression in the absence of inducing medium (M0) (MCU 62.03 ± 3.28%, MNF 65.2 ± 22.62%; P < .05) (Fig. 5B). A similar effect was found in the presence of M1-inducing medium (MCU 60.27 ± 3.57%, MNF 65.25 ± 12.23%; P < .05) (see Fig. 5B). Interestingly, in the presence of M2-inducing medium only MCU increased IL-10 expression (58.7 ± 5.28%; P < .05) (see Fig. 5B). On the other hand, in the presence of M2-inducing medium, pituitary-derived MSCs increased M-CSF expression compared to BM-MSCs (MS 86.73 ± 3.55%, MCU 85.45 ± 5.29%, MNF 84.4 ± 5.82%; P < .05) (see Fig. 5B).
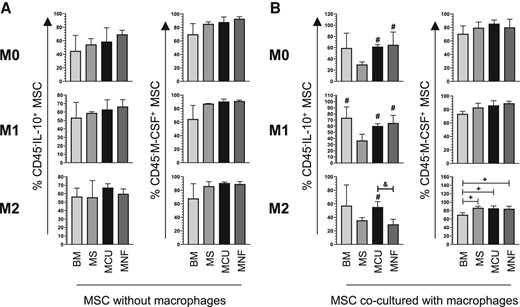
A, Bar graphs with mean ± SD of the percentage of CD45-IL-10+ MSC and CD45-M-CSF + MSC in the absence of macrophages and in the presence of M0, M1, and M2 polarizing medium; n = 2. B, Bar graphs with mean ± SD of the percentage of CD45-IL-10+ MSC and CD45-M-CSF + MSC cocultured with macrophages in the presence of M0, M1, and M2 polarizing medium; n = 4. #Significant difference when compared to MS. +Significant difference when compared to BM. &Significant difference when compared to MNF. BM, bone marrow MSC; IL-10, interleukin-10; MCU, Cushing MSC; MNF, nonfunctional MSC; MS, nontumoral pituitary gland; MSC, mesenchymal stem cell. (P < .05); M0, absence of inducer medium; M1, inducer medium for M1 polarization; M2, inducer medium for M2 polarization.
Discussion
We have successfully isolated and functionally characterized MSC from ACTH-secreting and nonfunctioning PTs of gonadotrope differentiation as well as from nontumoral pituitaries. Besides fully immunophenotyping these cells by means of flow cytometry and immunofluorescence, stemness was confirmed by demonstrating their adipogenic, chondrogenic, and osteogenic differentiation capacity. Although MSC have been previously identified in a few GH and nonfunctioning tumors (9, 10), to our knowledge this is the first time such cells have been isolated from ACTH-secreting tumors and from nontumoral pituitary glands. MSCs are known to be part of the TME of PT although their precise role in the development and maintenance of these neoplasms is not well understood. The functional consequences of MSCs in nontumoral pituitary tissue are even less well understood; however, at least in theory these cells could be instrumental in pituitary plasticity, which is a phenomenon that explains the neuroendocrine adaptations to certain physiological (puberty and pregnancy) and pathological (stress, systemic inflammation) states. It is based on these considerations that we decided to functionally characterize these cells in vitro, to unravel their potential immunoregulatory role.
Throughout the initiation, development, and progression of a neoplasm, tumor cells interact extensively with nonmalignant cell populations of the TME, including MSCs. The TME has been implicated in a wide variety of tumor-supporting functions, including the escape from the host immune response (14). The International Society for Cell and Gene Therapy (ISCGT) has indicated that MSCs is a heterogeneous population that presents a characteristic phenotype similar to BM-MSC (15). MSCs is a heterogeneous group of mixed cells with variable morphologies and properties (16, 17). Although we found MSCs to be transcriptomically heterogeneous, we were able to identify 2 distinct subpopulations among tumoral and nontumoral pituitary MSCs, one with more immunosuppressive potential and the other with more proliferative capabilities. At least 3 MSC subpopulations have recently been described in other tumoral and nontumoral tissues, namely a stemness, a functional, and a proliferative subpopulation (16). Our results are in line with this recent finding, although MSC subpopulations found in the present study showed immune suppression potential.
In recent years, MSCs isolated from several neoplasms have been shown to regulate immune cell populations by having anti-inflammatory and immunomodulatory activities (2, 18). It has been described that MSCs obtained from tumors have a greater immunoregulatory effect than MSCs derived from nontumoral tissue. Studies comparing the immunoregulatory properties of tumoral MSCs vs nontumoral MSCs are limited to lymphoma (19), pancreatic cancer (20), lung squamous cell carcinoma (21), and cervical cancer (6). Thus, ours is the first study that compares the immunoregulatory effect of MSCs derived from 2 types of PTs alongside MSCs obtained from nontumoral pituitaries.
MSCs modulate immune response primarily via suppressive mediators, such as transforming growth factor β (TGF-β), IL-10, and IDO, that inhibit B- and T-cell proliferation and prevent monocyte differentiation and dendritic cell maturation. The same mediators promote the generation of Tregs and B cells, as well as M2 macrophage differentiation (22, 23). Immunosuppressive roles of MSCs have been described in several malignant tumors including breast and colon cancer, as well as melanoma (24). Tregs (25) and macrophages (26), particularly M2 (12, 27) have been found infiltrating PTs of different lineages. Another group of investigators has found CD4+ and CD8+ T cells in the TME of PTs (28). Thus, the presence of these cells suggests that the TME in PT is immunosuppressive in nature (29). For a tumor to grow successfully, it must develop several escape mechanisms to avoid recognition and elimination by the immune system, including the inactivation of immune cells through the production of immunosuppressive factors (30).
MSC derived from cervical carcinomas, compared to those obtained from the nontumoral cervix, decrease the cytotoxic capacity of CD8+ T lymphocytes through molecules such as TGF-β and IL-10 (31, 32). Our data show that MSC derived from ACTH-secreting and nonfunctioning PTs, unlike MSC isolated from nontumoral pituitary, decreased the proliferation of CD3+ T lymphocytes and the CD4+ subpopulation, a phenomenon described previously in BM MSC (33). In the context of an inflammatory environment, MSCs are known to generate CD4 + CD25 + FoxP3+ Treg populations (33). In our study, MCU but not MNF increased the generation of these cells. This is in concordance with a previous report whereby MSCs derived from nonfunctioning PT did not increase the generation of FoxP3+ lymphocytes, which expectedly did not correlate with the biological behavior of the tumor and its capacity to invade the cavernous sinus (34).
PD-L1 is an immune checkpoint molecule that inhibits the antitumor response of T cells, thereby promoting tumor progression (35). It also constitutes a target for molecular therapy with specific, neutralizing monoclonal antibodies that are increasingly being used in the treatment of several types of advanced cancer (35). PD-L1 has been found to be expressed by PTs, particularly, functioning adenomas, at both the messenger RNA and protein levels (36, 37). Ours is the first study looking at PD-L1 expression in MSCs derived from pituitary tissues. PD-L1 expression was highest in MSCs derived from nontumoral pituitary glands, followed by MSCs derived from nonfunctioning tumors, and was lowest in MSCs derived from ACTH-secreting tumors. Furthermore, the expression of PD-L1 increases after interaction with CD3+ T cells, particularly in MSCs derived from ACTH-secreting tumors. These findings underscore the functional importance of pituitary MSCs as potential players in the immune regulation of cellular proliferation of these neoplasms.
We have previously shown that M2 macrophages are the most abundant infiltrating immune cell population in PTs (12). M2 macrophages are known to promote tumor progression, supporting processes such as angiogenesis, growth, extracellular matrix degradation, and epithelial-mesenchymal transition (38). In the present study, MCU and MNF preferentially increased the expression of CD14 and CD163 by macrophages. However, only MCU increased the expression of CD206, similar to BM-MSC induction of CD206 in microglia (39), as well as CD14 in macrophages (40); our data are consistent with these results. On the other hand, when evaluating the expression of molecules that define M1 polarization, MSCs derived from tumoral and nontumoral tissues decreased the expression of these molecules (40). The pituitary-derived MSCs not only skewed the macrophage phenotype but also enhanced their phagocytic activity and increased the Treg induction capacity as previously described in other tissues (41, 42). The presence of MSC also promotes the expression of IL-10 and IDO in macrophages, which contributes to the maintenance of an immunosuppressive TME that supports tumor growth (43-45). The effects of MSCs on macrophages could be mediated by IL-10 and M-CSF (6, 20).
We acknowledge the limitations of our experimental design due to the limited number of samples. Nevertheless, our experimental approach is in line with previously reported studies addressing the isolation and characterization of MSCs from both pituitary and non-PTs. Orciani et al isolated MSCs from only 3 PTs (9), whereas Megnis et al evaluated only 7 PT specimens (10). Furthermore, studies looking for MSCs in other type of tumors also include a limited number of samples (6). In conclusion, our study provides valuable insights into the immunoregulatory properties of MSCs from PT that suggest an important role in the TME. These findings highlight the potential of MSCs to influence the immune response and shape the TME in PTs, emphasizing the importance of understanding MSC-mediated immunomodulation for the development of targeted immunotherapies in PTs.
Acknowledgments
The authors thank all the patients who agreed to participate in the protocol, the endocrinology fellows, and all the doctors. We thank Jessica L. Prieto-Chavez and Vadim Perez-Koldenkova for technical assistance in the Laboratorio de Citometria de Flujo, and Laboratorio Naional de Microscopia Avanzada, respectively, Centro de Instrumentos, Coordinación de Investigación en Salud, Hospital de Especialidades, Centro Medico Nacional Siglo XXI (IMSS), 06720 Mexico City, Mexico.
Funding
This work was partially supported by the Instituto Mexicano del Seguro Social (grant Nos. R-2019-785-052 and R-2023-3602-013 to M.M. and J.J.M.).
Author Contributions
D.M.R., K.T.P., J.J.M., and M.M. conceived, designed, and coordinated the project, performed experiments, analyzed and discussed data, and prepared the manuscript. V.A.C.M., E.G.A., A.C.Z., F.M.M., J.K.S., S.V.P., E.P.M., S.A.E., A.C.S., S.H.A., and J.H.P. provided biological samples and collected detailed clinical and biochemical information from patient records, performed experiments, analyzed and discussed data, and prepared the manuscript. All authors read and approved the manuscript.
Disclosures
All authors declare not having any conflict of interest.
Data Availability
The original data generated by this study, including the normalized RNA counts, and the statistical analysis have been uploaded onto the Gene Expression Omnibus from the National Center for Biotechnology Information, accession number pending (GEO-NCBI) (13).
References
Abbreviations
- ACTH
adrenocorticotropin
- BM
bone marrow
- CD
Cushing disease
- CFSE
carboxyfluorescein succinimidyl ester
- CSI
cavernous sinus invasion
- FBS
fetal bovine serum
- GH
growth hormone
- HLA-DR
histocompatibility leukocyte antigen-DR isotype
- IDO
indoleamine 2,3-dioxygenase
- IL
interleukin
- lg-DMEM
low-glucose–Dulbecco’s modified Eagle’s medium
- M-CSF
macrophage colony-stimulating factor
- MCU
adrenocorticotropin-secreting tumor
- MNF
nonfunctional mesenchymal stem cell
- MS
nontumoral pituitary gland
- MSC
mesenchymal stem cell
- NFPT
nonfunctioning pituitary tumors
- PBMC
peripheral blood mononuclear cell
- PBS
phosphate-buffered saline
- PRL
prolactin
- PT
pituitary tumor
- TGF-β
transforming growth factor β
- TME
tumor microenvironment
- Treg
regulatory T cell
- TSH
thyrotropin
Author notes
These authors contributed equally and share co-first authorship of this work.
