


Abstract
Patients with diabetes are at increased risk of dying from liver-related events, but little is known on whether this increased risk has changed in recent years.
The aim of the present study is to describe time trends in cause-specific liver-related mortality in people with and without diabetes from the general Italian population.
Data were retrieved from the health care utilization databases of Lombardy, a region of Italy that accounts for about 16% (almost 10 million) of its population. Annual cause-specific mortality rates and proportionate mortality were computed among individuals with and without diabetes from 2010 to 2019. Liver-related deaths were categorized as viral, alcohol related, and nonviral nonalcohol related (NVNA).
Liver diseases were responsible for 2% and 1% of deaths in people with and without diabetes (2019). Among patients with diabetes, the crude mortality rate for liver diseases decreased from 1.13 to 0.64 deaths per 1000 person-years from 2010 to 2019. The largest proportion of liver-related deaths was attributable to NVNA diseases and it increased from 63% in 2010 to 68% in 2019, with a corresponding relative reduction of viral causes (from 27% to 23%). The standardized mortality ratio for patients with diabetes was 3.35 (95% CI 2.96-3.76) for NVNA, 1.66 (95% CI 1.33-2.01) for viral hepatitis, and 1.61 (95% CI 1.13-2.17) for alcoholic liver disease and it remained relatively stable over time. Excess mortality risk in patients with diabetes for liver-related mortality was higher than for cardiovascular mortality and cancer.
While liver-related mortality rates decreased significantly among patients with diabetes, NVNA causes made up the majority of cases. Excess mortality for liver-related causes in patients with diabetes compared with controls remained constant in the studied period.
Liver disease is associated with significant morbidity and mortality. In Europe, deaths from liver disease (including cirrhosis, hepatocellular carcinoma, and viral hepatitis) accounted for 3% of all deaths in 2019, with a 25% increase compared with 1990, albeit with significant differences across countries (1). Because liver disease affects younger individuals compared with most chronic debilitating conditions, it is considered the second cause of working life lost in Europe following ischemic heart disease (2).
The most common chronic liver conditions are represented by nonalcoholic fatty liver disease (recently renamed metabolic dysfunction–associated steatotic liver disease, MASLD (3, 4)), alcoholic liver disease (ALD) and viral hepatitis. The advent of direct-acting antiviral drugs leading to cure of most treated hepatitis C virus (HCV) infections, as well as the possibility to prevent and manage chronic hepatitis B, changed the hepatologic epidemiologic scenario in the last decade (5). Time trends in the relative contribution of these conditions to the development of end-stage liver disease have been described, with a reduction in chronic viral hepatitis and an increase in ALD and MASLD-related deaths in the last 10 years (6). MASLD represents by far the most common chronic liver condition worldwide, affecting approximately 25% to 30% of the general adult population (7). Moreover, its prevalence is increasing throughout the world (8-10), in parallel with the epidemic of obesity and type 2 diabetes (T2D) (11). Several studies have now documented that T2D is a major risk factor for its progression towards metabolic steatohepatitis, and that T2D doubles the risk of developing advanced liver fibrosis, cirrhosis, and hepatocellular carcinoma (12-15). Moreover, T2D and its associated metabolic abnormalities have been linked with increased rates of death not only in patients with MASLD, but in all forms of chronic liver disease, including viral hepatitis and ALD (16-18). While previous studies have shown increased mortality rates for liver-related conditions in patients with diabetes compared with nondiabetic controls (19), time trends in the relative contribution of different causes in these 2 groups have not been thoroughly investigated in recent years.
Based on these pieces of evidence, the present study aims to evaluate time trends in cause-specific liver-related mortality in people with and without T2D from the general Italian population. To achieve this goal, we analyzed data from health care utilization databases of the Lombardy region, Italy, from 2010 to 2019.
Materials and Methods
Setting
Data were retrieved from the health care utilization databases of Lombardy, a region of Italy that accounts for about 16% (almost 10 million) of its population, which is entirely covered by the National Health Service (NHS). In Lombardy, health care data are included in an automated system of databases that provides a variety of information on residents, such as (1) demographic characteristics, (2) inpatients diagnoses (coded according to the International Classification of Diseases, Ninth Revision, Clinical Modification—ICD-9-CM—system), (3) drug prescriptions (according to the Anatomical Therapeutic Chemical system), (4) copayment exemptions for chronic diseases (including diabetes), and (5) cause of death (according to ICD-10-CM). For each patient, we linked the information provided by these archives through a single identification code. To ensure privacy, each identification code was automatically converted into an anonymous code before receiving the dataset. To preserve privacy, each identification code is automatically deidentified, the inverse process being only allowed to the Regional Health Authority upon request from judicial authorities. Full details of health care utilization databases of the Lombardy region and of the procedure for linking them are reported in previous studies (20, 21).
Study Cohort
The target population consisted of all beneficiaries of the NHS resident in Lombardy aged 40 years or older. Among these, for each year between 2009 and 2018, patients with diabetes who were alive on December 31 were identified. Presence of diabetes was defined as having at least a hospitalization with diagnosis of diabetes, or a prescription of antidiabetic drugs, or an active copayment exception for diabetes in that year.
For each patient with diabetes, a subject without diabetes was randomly selected from the target population and matched for age and sex. Members of each cohort were followed over the year following that of their enrolment, from January 1 until the earliest date among death, emigration, or December 31. For instance, the 2009 cohort included patients with signs of diabetes during 2009 and alive on December 31, 2009. These cohort members were followed from January 1, 2010, until the earliest date among death, emigration, or December 31, 2010.
Cause of Death
Causes of death were grouped into 4 comprehensive and mutually exclusive categories: cardiovascular diseases (codes I00-I99), cancer (C00-D48), liver diseases (B15-B19, F10, K10, K72-K76), and other causes. Liver-related causes were further classified into ALD (F10, K10), viral hepatitis (B15-B19), and nonviral nonalcohol related (NVNA) (K72-K76).
Missing Data
Cause of death was not reported for about 11% of deaths recorded in the homonymous database. In the main analysis, we assumed these data were missing at random (ie, that the probability that the cause of death was not recorded does not depend on unobserved data). We imputed missing causes of death at an aggregated level, assuming that missing observations had the same distribution of observed values.
Statistical Analyses
Annual cause-specific mortality rates (express per 1000 person-years) and proportionate mortality were computed among individuals with and without diabetes. The Poisson model was fitted to assess differences between sex and age strata.
To evaluate whether the cause of death distribution was different between 2010 and 2019, the chi-square test was used.
Standardized mortality ratios (SMRs) with 95% CI, based on the Poisson distribution, were computed as the ratios between deaths observed in patients with diabetes and those observed among controls. In order to analyze trend in SMRs for hepatic subcauses from 2010 to 2019, the locally estimated scatterplot smoothing regression was fitted. The locally estimated scatterplot smoothing is a nonparametric regression method that allows to visually observe the possible trend of 1 variable (22).
Sensitivity Analysis
Since missingness could depend on patient characteristics, for those experiencing the event and having missing cause of death, the latter was imputed by the multiple imputation method (MI), using the iterative procedure known as fully conditional specification (FCS). This method consists of simulating a number of independent complete datasets, in each of which missing data are replaced by values drawn from the posterior predictive distribution of the missing data conditional on the observed data. The analysis of interest is then conducted on each complete dataset and the results combined in a single estimate with the relative CI. It has been shown that FCS MI generally yields estimates that are unbiased and provide appropriate coverage (23).
The multinomial logistic regression model was specified as the imputation model, considering the cause of death as the dependent variable, and sex, age, and comorbidities (stroke, heart failure, myocardial infarction, renal diseases, liver diseases, respiratory diseases, depression, and cancer) as predictors. Comorbidities were identified from in-hospital diagnoses and treatments from out of hospital prescriptions in the year preceding the date of death. The number of imputations was set equal to the percentage of missing data (n = 11), a threshold that ensures an adequate level of reproducibility of results (24).
Given the bilateral association between diabetes and liver disease, analyses were also repeated by excluding patients with diabetes who had a diagnosis of liver disease before entering the study.
The Statistical Analysis System Software (version 9.4; SAS Institute, Cary, NC, USA) was used for the analyses. For all hypotheses tested, a 2-tailed P < .05 was considered significant.
Results
All-Cause Mortality
Between 2010 and 2019 the number of patients with diabetes ranged from 462 257 to 634 347. In 2019, crude all-cause mortality rate was 40.8 deaths per 1000 person-years, with no difference between sexes (P = .935), and it increased progressively with aging (P < .001), going from 7.6 to 79 deaths per 1000 person-years among those aged 40-64 and those aged ≥75 respectively. Data on mortality in people with and without diabetes are reported in Table 1.
Crude mortality rate among individuals with and without diabetes, 2019
| Individuals with diabetes | Individuals without diabetes | |
|---|---|---|
| Strata | Crude mortality rate × 1000 person-years | Crude mortality rate × 1000 person-years |
| Overall | 40.8 | 25.2 |
| Sex | ||
| Females | 40.8 | 24.1 |
| Males | 40.8 | 26.2 |
| Age (years) | ||
| 40-64 | 7.6 | 2.8 |
| 65-74 | 21.1 | 10.7 |
| ≥75 | 79.0 | 51.5 |
Causes of Death
Cause of death significantly changed from 2010 to 2019 both in individuals with and without diabetes (P < .001 in both groups) (Fig. 1). In 2010, the main cause of death was cardiovascular diseases among patients with diabetes and cancer among subjects without diabetes, accounting for 34% and 37% of deaths, respectively. The proportion of deaths due to cancer decreased from 33% to 29% and from 37% to 32% among individuals with and without diabetes, respectively. Conversely, the proportion of death from other causes increased significantly from 2010 to 2019 in both groups. Finally, the proportionate mortality for liver-related causes and cardiovascular diseases was relatively stable both in individual with and without diabetes. Absolute mortality rates for participants with and without diabetes from in 2010 and 2019 are shown in Fig. 2.
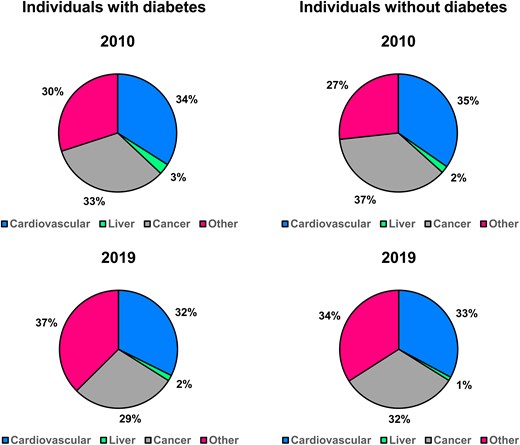
Causes of death among individuals with and without diabetes at the beginning (2010) and at the end (2019) of the studied period.
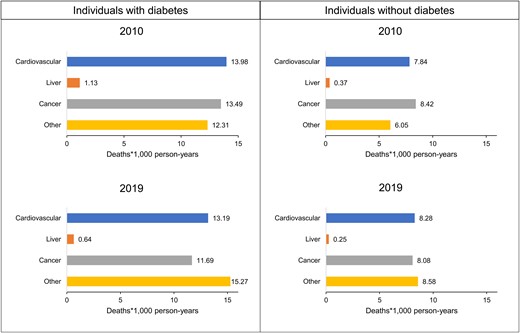
Absolute cause-specific mortality rates among individuals with and without diabetes at the beginning (2010) and at the end (2019) of the studied period.
Liver-Related Causes of Death
The crude mortality rate for liver diseases among patients with diabetes decreased from 1.13 to 0.64 deaths per 1000 person-years from 2010 to 2019 (Fig. 3, left). The largest proportion of liver-related deaths was attributable to NVNA diseases and it slightly increased from 63% in 2010 to 68% in 2019, with a corresponding relative reduction of viral causes (from 27% to 23%). Among individuals without diabetes, the crude mortality rate for liver diseases changed from 0.37 deaths per 1000 person-years in 2010 to 0.25 deaths per 1000 person-years in 2019 (Fig. 3, right). Liver-related proportionate mortality was relatively stable over time, with NVNA causes as the leading contributor (51% in 2019), even though to a lesser extent compared with patients with diabetes.
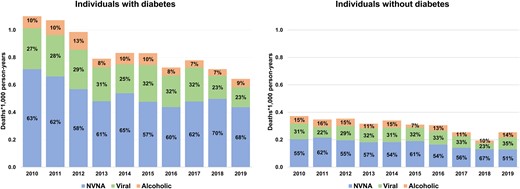
Time trends in absolute and relative rates of mortality for liver-related causes in individuals with and without diabetes in Lombardy, Italy, 2010 to 2019. Abbreviations: NVNA, nonalcoholic nonviral causes.
Excess of Mortality Risk
Patients with diabetes had a significantly greater mortality risk than individuals without diabetes for all causes. In 2019, the highest excess of risk associated with diabetes was due to liver-related causes (SMR = 2.53, 95% CI 2.29-2.78), followed by cardiovascular diseases (SMR = 1.57, 95% CI 1.54-1.60) and cancer (SMR = 1.45, 95% CI 1.41-1.48) (Fig. 4). The excess of mortality risk due to liver-related causes did not change over 10 years, even stratifying for liver subcause (Fig. 5). In 2019, NVNA diseases was associated with a higher SMR (3.35, 95% CI 2.96-3.76) than viral hepatitis (1.66, 95% CI 1.33-2.01) and ALD (1.61, 95% CI 1.13-2.17).
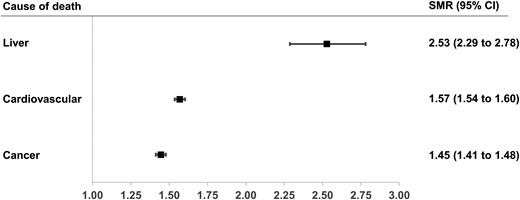
Standardized mortality ratios (SMRs) for liver, cardiovascular and cancer-related deaths among patients with diabetes compared with controls in Lombardy, Italy, in 2019.
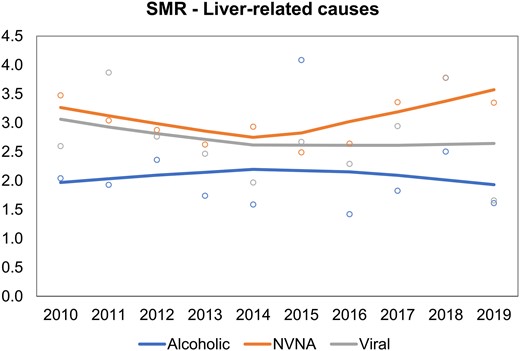
Time trends in standardized mortality ratios (SMR) for cause-specific liver-related mortality in individuals with and without diabetes in Lombardy, Italy, 2010 to 2019. Abbreviations: NVNA, non-alcoholic non-viral causes.
Sensitivity Analyses
As shown elsewhere (Tables S1, S2, S3, and S4 and in Figs. S1 and S2), the results described in the previous sections did not change by using the FCS MI method (25). Compared with individuals without diabetes, patients with diabetes had a higher risk of liver-related mortality even excluding those with a previous diagnosis of liver disease (SMR = 1.80, 95% CI 1.60-2.02 in 2019) (Table S5 (25)). This excess of risk remained the highest among all causes of death and was driven by NVNA diseases.
Discussion
In the present large population-based study performed in the Italian Lombardy region we made a series of observations. First, liver-related deaths accounted for approximately 2% and 1% of all deaths in patients with and without diabetes, respectively. Second, crude rates of liver-related deaths among patients with diabetes decreased significantly between 2010 and 2019. Third, in relative terms, the contribution of NVNA causes to liver-related mortality in patients with diabetes slightly increased from 63% to 68% in the same time frame. Fourth, people with diabetes have a 2- to 3-fold risk of dying from liver-related events compared with their nondiabetic counterparts. While this excess risk was present for all investigated causes (including viral hepatitis and ALD), the highest SMR was present for NVNA and remained relatively stable over time. Notably, relative risk for liver mortality in patients with diabetes was higher than that of both cardiovascular disease and cancer.
Since previous studies have shown that most patients with advanced chronic liver disease not attributable to viral hepatitis or alcohol consumption have MASLD (26), and given that MASLD affects approximately 70% of patients with T2D in Europe (27), it is reasonable to assume that a large fraction of deaths coded as NVNA are attributable to MASLD. Nonetheless, they also include rarer causes such as autoimmune hepatitis and biliary disorders, use of toxic substances or drugs, hemochromatosis and other conditions. The fact that NVNA causes were associated with the highest SMR corroborates the hypothesis that most of these cases are related to MASLD, a condition that is strictly associated with obesity, insulin resistance, and T2D (28).
Our data on excess risk of death from liver-related causes in patients with diabetes are in agreement with a previous study from the Italian Veneto region conducted in the years 2008-2010, showing similar SMR values for the 3 specific causes (29). Nonetheless, our data expand on these results by looking at more recent data and, most importantly, by evaluating time trends in the past decade.
A previous multicenter study conducted in 2014 in Italy in patients with cirrhosis (n = 832) at 16 hospitals showed that the proportions of people with cirrhosis due to alcohol consumption and HCV infection decreased, whereas the proportion of people with cirrhosis due to MASLD increased when compared with a historical cohort (2001) (30). Here, we show that up to 2019, the increase in NVNA-related cirrhosis cases was present in relative terms and not in absolute terms and that mortality rates for liver-related deaths continued to decline beyond 2014. While these results might be viewed as reassuring, it is well known that the natural history of MASLD, which is likely to have accounted for the larger part of NVNA deaths, is frequently characterized by slow progression over several decades before the development (in a fraction of patients) of compensated or decompensated cirrhosis (31). In a study conducted in a general population setting (age 18-90 years) in Sicily (Italy) in 2015, Petta et al showed a remarkable prevalence of MASLD in the studied cohort of 48% (based on a controlled attenuation parameter value greater than 248 dB/m), with 6.5% of patients with MASLD showing signs of significant liver fibrosis (32). While differences in the prevalence of diabetes and obesity between the 2 regions have been shown, these results are disconcerting for the upcoming decades, when a surge in liver-related deaths might occur. A future increase in MASLD-related cirrhosis and deaths has also been modeled in a large international study including Italy, with a doubling in mortality related to metabolic steatohepatitis being expected in 2030 (33).
The current study has some limitations. The most relevant is related to potential distortions in the reporting of data in terms of the etiology of liver disease. It has been shown that relying on ICD codes to identify cases of cirrhosis might to bias related to incomplete records or incorrect coding (34). In particular, in our study about 11% of causes of death were missing and we imputed them assuming they were missing at random. While this might have impacted the overall contribution of liver disease to total mortality, as well as the proportion due to specific causes, it is reasonable to assume that misclassification should have affected people with and without diabetes in a similar fashion, making our SMR results still valid. Moreover, our sensitivity analysis confirmed the results and provided estimates and confidence intervals that account for the uncertainty due to missing data. Another limitation is related to the lack of definitive data on diabetes subtype. Although it is possible that patients with type 1 diabetes were included in the present analysis, they are likely to represent a small minority. Indeed, while previous studies estimated that, among all patients with diabetes, 5-15% had type 1 diabetes (35), a large international study showed that in 2017 type 1 diabetes accounted for only 2% of all diabetes cases (36). Moreover, evidence on prevalence and outcomes related to MASLD in patients with type 1 diabetes is limited (37); for these reasons, they are likely to have contributed to a limited extent to the liver-related mortality outcomes considered in the present analysis. Finally, given that our analysis was based on administrative data, it lacked information on several clinical features of included participants, such as glycemic control, body mass index, diabetes duration, and previous microvascular and macrovascular complications. In particular, it is possible that increased awareness on MASLD and use of newer glucose-lowering agents might have had a favorable impact on progression of this condition towards liver cirrhosis and liver-related deaths. Lack of data on diabetes duration does not allow us to evaluate this possibility in the present study.
While information on these aspects would have enabled us a more thorough characterization of the cohort (as well as the possibility to look at associations between clinical factors and mortality), this was not the primary aim of the present study.
In conclusion, in the present large population-based study we showed while the rates of liver-related deaths decreased significantly among patients with diabetes between 2010 and 2019, the relative risk of dying from advanced liver disease is tripled in diabetic patients. Moreover, the contribution of NVNA causes to liver-related mortality in patients with diabetes slightly increased in the same time frame, making it the stable first cause of liver-related deaths. Future studies will evaluate whether the remarkable increase in obesity and diabetes rates in the general population in the last decades will invert the decreasing trend in liver-related mortality in Western countries.
Funding
This study was funded by a grant from the Italian Ministry of the Education, University and Research: “Modelling effectiveness, cost-effectiveness and promoting health care value in the real world. The Motive project” (grant number H45J17000500006). The funding source had no role in the design of the study, the collection, analysis and interpretation of the data, or the decision to approve publication of the finished manuscript.
Author Contributions
S.C. and G.P. conceived the idea for this manuscript. All authors designed the study. G.M. performed data analysis. S.C. and G.M. drafted the manuscript. All authors assisted the results interpretation and manuscript revision. All authors read and approved the final manuscript. S.C. is the guarantor of this work.
Disclosures
Giovanni Corrao received research support from the European Community (EC), the Italian Medicines Agency (AIFA), Italian Ministry of Health, and the Italian Ministry of Education, University and Research (MIUR). He took part to a variety of projects that were funded by pharmaceutical companies (ie, Novartis, GSK, Roche, AMGEN, BMS, and Servier). He also received honoraria as member of Advisory. Other authors have no disclosures.
Data Availability
Restrictions apply to the availability of some or all data generated or analyzed during this study to preserve patient confidentiality or because they were used under license. The corresponding author will on request detail the restrictions and any conditions under which access to some data may be provided.
Data Transparency Statement
The data that support the findings of this study are available from Lombardy region, but restrictions apply to the availability of these data, which were used under license for the current study, and so are not publicly available. Data are however available from the Lombardy region upon reasonable request.
References
Abbreviations
- ALD
alcoholic liver disease
- FCS
fully conditional specification
- MASLD
metabolic dysfunction–associated steatotic liver disease
- MI
multiple imputation method
- NVNA
nonviral nonalcohol related
- SMR
standardized mortality ratio
- T2D
type 2 diabetes
