


Abstract
The European Increlex® Growth Forum Database (Eu-IGFD) is an ongoing surveillance registry (NCT00903110) established to collect long-term safety and effectiveness data on the use of recombinant human insulin-like growth factor-1 (rhIGF-1, mecasermin, Increlex) for the treatment of children/adolescents with severe primary insulin-like growth factor-1 deficiency (SPIGFD).
This analysis of Eu-IGFD data aimed to identify the frequency and predictive factors for hypoglycemia adverse events (AEs) in children treated with rhIGF-1.
Data were collected from December 2008 to May 2021. Logistic regression was performed to identify predictive risk factors for treatment-induced hypoglycemia AEs. Odds ratios (ORs) are presented with 95% CIs for each factor.
In total, 306 patients were enrolled in the registry; 84.6% were diagnosed with SPIGFD. Patients who experienced ≥ 1 hypoglycemia AE (n = 80) compared with those with no hypoglycemia AEs (n = 224) had a lower mean age at treatment start (8.7 years vs 9.8 years), a more frequent diagnosis of Laron syndrome (27.5% vs 10.3%), and a history of hypoglycemia (18.8% vs 4.5%). Prior history of hypoglycemia (OR 0.25; 95% CI: [0.11; 0.61]; P = .002) and Laron syndrome diagnosis (OR 0.36; 95% CI: [0.18; 0.72]; P = .004) predicted future hypoglycemia AEs. Total hypoglycemia AEs per patient per treatment year was 0.11 and total serious hypoglycemia AEs per patient per treatment year was 0.01.
Hypoglycemia occurs more frequently in patients with prior history of hypoglycemia and/or Laron syndrome compared with patients without these risk factors, and these patients should be carefully monitored for this AE throughout treatment.
Severe primary insulin-like growth factor-1 (IGF-1) deficiency (SPIGFD) is a rare endocrine disorder characterized by a low serum concentration of IGF-1 (<2.5th percentile for age and sex in Europe and ≤ −3 SD score [SDS] in the United States), and insensitivity to growth hormone (GH), indicated by normal or elevated GH production, as well as exclusion of acquired GH insensitivity (1-3). SPIGFD is associated with postnatal growth failure, with longitudinal growth typically affected from 1 year of age. SPIGFD is characterized by excess abdominal body fat, thin bones, underdeveloped muscles, and severe short stature defined as a height SD score (HtSDS) ≤ −3 (2, 4, 5). Approximately 1.2% (30/2496) of children referred for growth disorders due to short stature meet the criteria for SPIGFD (3), and the prevalence of SPIGFD in the EU is thought to be less than 2 per 10 000 (6).
GH insensitivity in children with SPIGFD may be associated with pathological variants of the GH receptor (GHR) gene (Laron syndrome), or genes in the post-GHR signaling pathway (including signal transducer and activator of transcription 5B [STAT5b] and IGF-binding protein acid labile subunit [IGFALS]) (7). Complete genetic workup is not mandatory for SPIGFD diagnosis and was not performed in most children included in The European Increlex® Growth Forum Database (Eu-IGFD). Therefore, the true prevalence of these pathological variants in the Eu-IGFD cohort is not known. Laron syndrome is the most severe phenotype of SPIGFD, causing GH insensitivity and severe to extreme short stature (−4 to −10 HtSDS), although the degree of GH insensitivity can vary significantly (1, 8, 9). GH acts to induce IGF-1 and promote growth, as well as mediating resting lipolysis, which helps maintain blood glucose homeostasis. Therefore, the degree of GH insensitivity in patients with SPIGFD closely correlates with the risk of serious and sustained hypoglycemia, and the risk of developing hypoglycemia during treatment with recombinant DNA-derived human IGF-1 (rhIGF-1, mecasermin, Increlex®) (1, 2).
Treatment options for SPIGFD are limited (10). rhIGF-1 is approved by the US Food and Drug Administration (FDA) and the European Medicines Agency (EMA) for the treatment of children and adolescents aged 2 to 18 years with confirmed SPIGFD (5, 11). There is potential for height gain among patients who start treatment at an early age, with the possibility of improving final or attainment of near adult height. Previous publications have reported average total height gain between 0.5 and 2.5 HtSDS over the entire rhIGF-1 treatment course (1, 10, 12-14).
Hypoglycemia is the most frequently reported adverse event (AE) associated with rhIGF-1 treatment (1, 4, 10, 13). A raised concentration of circulating total and free IGF-1 increases glucose uptake in human skeletal muscle and is mediated by the IGF-1 receptor (IGF-1R), which is highly abundant in skeletal muscle, whereas the expression of IGF-1R in liver and fat tissue is low (15). Suspected factors which could augment the risk of hypoglycemia in patients with SPIGFD include young age, height, and low IGF-binding protein-3 (IGFBP-3) concentration (10, 13, 14). Although most hypoglycemia events are mild to moderate (with symptoms including hunger, headaches, dizziness, and weakness), a small percentage of patients experience severe hypoglycemia leading to seizures and loss of consciousness (1, 5, 13). The frequency and severity of these hypoglycemia events, coupled with the lack of established risk factors, highlights the need for further investigation.
The Eu-IGFD registry was established to collect long-term, real-world safety and effectiveness data from clinical practice on the use of rhIGF-1 for the treatment of children with SPIGFD. The current analysis of data from the registry aims to identify the frequency of and predictive risk factors for treatment-induced hypoglycemia events, as well as their potential impact on safety management and effectiveness outcomes, to provide data to support evidence-based treatment recommendations in patients treated with rhIGF-1.
A plain language summary of this article is available in the supplementary materials (16).
Methods
Study Design
The registry is an ongoing, descriptive, multicenter, observational, prospective, open-ended, noninterventional, postauthorization surveillance registry (NCT00903110). Real-world clinical data across 10 European countries on the use of rhIGF-1 have been collected in the registry since December 2008. Children were eligible for enrollment in the registry if they were beginning therapy (or were previously treated) with rhIGF-1 by a qualified practitioner, and if informed consent was granted from their parents or legally authorized representatives, and from themselves where appropriate.
The registry was initiated in accordance with independent ethics committees/institutional review boards, informed consent regulations, the Declaration of Helsinki, International Conference on Harmonization, and Good Epidemiological Practice Guidelines.
Data for this analysis on hypoglycemia AEs were collected from the registry using an electronic case report form and comprised clinical data from patients’ medical records including age, serum IGF-1 and IGFBP-3 concentrations (by local assay providers), Laron syndrome diagnosis, hypoglycemia medical history, daily rhIGF-1 dose, treatment outcomes including HtSDS, and suspected or documented hypoglycemia (blood glucose concentration <50 mg/dL or <2.78 mmol/L). Nonserious hypoglycemia AEs and serious hypoglycemia AEs were reported irrespective of relationship to treatment. Seriousness of AEs (ie, serious/nonserious) were based on the regulatory definition and relate to any AE which resulted in death, was life-threatening, required in-patient hospitalization or prolongation of existing hospitalization, was medically important, resulted in persistent or significant disability or incapacity, or was a congenital anomaly/birth defect (17). Additionally, all AEs were assessed for clinical intensity (intensity was defined as: mild, moderate, or severe). A mild AE was defined as an event that was easily tolerated by the patient, causing minimal discomfort, and not interfering with everyday activities. A moderate AE was defined as an event that was sufficiently discomforting to interfere with normal everyday activities. A severe AE was defined as an event that prevented normal everyday activities. Longitudinal data from the registry are presented over more than 10 years, from December 9, 2008, up to the data cutoff on May 12, 2021.
Patient Populations
The enrolled population comprised patients who had given their written informed consent to participate in the registry study. The registry population was defined as patients who received ≥ 1 dose of rhIGF-1 and attended ≥ 1 follow-up visit. The safety population was defined as patients who received ≥ 1 dose of rhIGF-1 and attended ≥ 1 follow-up visit, or for whom there were post-study treatment safety data available.
Statistical Analysis
The following risk factors for hypoglycemia were hypothesized and investigated: age at first rhIGF-1 administration, sex, pubertal stage (defined according to Tanner Staging) (18), rhIGF-1 dose at the onset of first hypoglycemia event, a history of prior hypoglycemia, previous growth-promoting therapy (recombinant human GH and rhIGF-1), a diagnosis of Laron syndrome, circulating IGF-1 and IGFBP-3 concentration at baseline and HtSDS at baseline, as well as weight and body mass index (BMI), measured at both baseline and at the onset of first hypoglycemia event.
Univariate logistic regression analysis was performed for each of these risk factors on the safety population. Odds ratios (ORs) were calculated for each analysis and are presented with 95% CIs. Factors for which the OR reached a threshold of statistical significance (P value < .2) were included in multivariate logistic regression analyses. Comparisons of patients were as follows: (1) those who did not experience hypoglycemia vs those who had ≥ 1 hypoglycemia event; (1a) all patients and all potential risk factors; (1b) all patients excluding those with Laron syndrome as a potential risk factor; (1c) patients who were rhIGF-1 treatment-naïve and did not have Laron syndrome; and (2) those who experienced 1 hypoglycemia event vs those who had ≥ 2 hypoglycemia events. Patients with Laron syndrome (a subgroup of patients with SPIGFD), were those patients reported as presenting with Laron syndrome by the investigator and the presence of a GHR gene variant.
Effectiveness (HtSDS) was analyzed descriptively in the registry population and compared between patients who did not experience hypoglycemia and patients who experienced ≥ 1 hypoglycemia event over the course of rhIGF-1 treatment.
Time to a hypoglycemia AE was assessed in the safety population according to mean 1-year rhIGF-1 dose (≤ 100 μg/kg twice daily vs >100 μg/kg twice daily) using a Gehan test and was drawn on a survival curve using the Kaplan-Meier method.
Results
Hypoglycemia AE Characteristics
As of May 12, 2021, 306 patients had been enrolled in the study. The registry population included 301 patients and the safety population included 304 patients (Fig. 1).
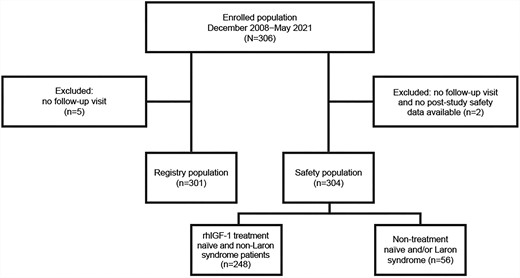
Patient disposition. The enrolled population comprised patients who had given their written informed consent to participate in the registry; the registry population comprised patients who received ≥ 1 dose of rhIGF-1 and attended ≥ 1 follow-up visit; the safety population comprised patients who received ≥ 1 dose of rhIGF-1 and either attended ≥ 1 follow-up visit(s) or had post-study treatment safety data available. Patients with Laron syndrome, N = 45.
A total of 132 hypoglycemia AEs were experienced by 80 patients (26.3%) in the safety population; 78 of these were classified as mild, 35 as moderate, 9 as severe, and 10 were not classified. A total of 13 serious hypoglycemia AEs were experienced by 8 patients (2.6%); 1 of these events was classified as being of mild intensity, 6 were of moderate intensity, and 6 were of severe intensity. Where patients experienced multiple hypoglycemia AEs, the highest intensity of AE was recorded. Capillary blood glucose testing was used to confirm and document 64 of the hypoglycemia AEs, while 55 were reported as suspected by the treating physician, and for 13 it was not specified whether they had been verified. The number of hypoglycemia AEs per patient per treatment year was 0.11 and the number of serious hypoglycemia AEs per patient per treatment year was 0.01.
Patient Characteristics
In the safety population (male n = 193; female n = 111), 25 patients (8.2%) had a history of prior hypoglycemia, and 45 patients (14.8%) had a diagnosis of Laron syndrome (defined in this analysis by the presence of a GHR gene variant, with the exception of 1 patient reported to have Laron syndrome as a secondary diagnosis) (Table 1). Ten patients with Laron syndrome also had a history of prior hypoglycemia.
Patient characteristics according to occurrence of hypoglycemia AEs
| Statistic | Safety population (N = 304) | Patients without a hypoglycemia AE (N = 224) | Patients with ≥ 1 hypoglycemia AE (N = 80) | |
|---|---|---|---|---|
| Age, yearsa | n | 304 | 224 | 80 |
| Mean (SD) | 9.5 (4.1) | 9.8 (3.9) | 8.7 (4.6) | |
| Median (Q1; Q3) | 9.6 (6.3; 13.0) | 10.1 (6.7; 13.1) | 8.3 (5.6; 12.8) | |
| Male | n (%) | 193 (63.5%) | 147 (65.6%) | 46 (57.5%) |
| Female | n (%) | 111 (36.5%) | 77 (34.4%) | 34 (42.5%) |
| Height SDS | n | 276 | 203 | 73 |
| Mean (SD) | −3.8 (1.4) | −3.7 (1.3) | −4.0 (1.6) | |
| Median (Q1; Q3) | −3.4 (−4.4; −2.9) | −3.3 (−4.3; −2.8) | −3.5 (−4.6; −3.0) | |
| IGF-1 concentration, ng/mL | n | 255 | 192 | 63 |
| Mean (SD) | 120.6 (122.5) | 120.9 (127.6) | 119.7 (106.3) | |
| Median (Q1; Q3) | 82.1 (46.0; 143.0) | 75.0 (44.3; 144.0) | 87.3 (51.0; 141.0) | |
| IGFBP-3 concentration, ng/mL | n | 207b | 158 | 48 |
| Mean (SD) | 1973.0 (1475.2)b | 1962.8 (1550.2) | 1999.7 (1227.8) | |
| Median (Q1; Q3) | 1830.0 (500.0; 2990.0)b | 1827.0 (500.0; 3000.0)b | 1892.5 (905.0; 2900.0)b | |
| Height velocity, cm/year | n | 164 | 127 | 37 |
| Mean (SD) | 4.8 (2.5) | 4.7 (1.8) | 5.3 (4.1) | |
| Median (Q1; Q3) | 4.7 (3.7; 5.6) | 4.7 (3.7; 5.7) | 4.7 (3.9; 5.5) | |
| Pubertal status | n | 295 | 217 | 78 |
| Prepubertal, n (%)c | 248 (84.1) | 180 (82.9) | 68 (87.2) | |
| Pubertal, n (%)d | 47 (15.9) | 37 (17.1) | 10 (12.8) | |
| Diagnosis of Laron syndromee | n | 304 | 224 | 80 |
| Yes, n (%) | 45 (14.8) | 23 (10.3) | 22 (27.5) | |
| No, n (%) | 259 (85.2) | 201 (89.7) | 58 (72.5) | |
| History of hypoglycemia | n | 304 | 224 | 80 |
| Yes, n (%) | 25 (8.2) | 10 (4.5) | 15 (18.8) | |
| No, n (%) | 279 (91.8) | 214 (95.5) | 65 (81.3) | |
| Previous growth-promoting therapy | n | 304 | 224 | 80 |
| Yes, n (%) | 95 (31.3) | 71 (31.7) | 24 (30.0) | |
| No, n (%) | 209 (68.8) | 153 (68.3) | 56 (70.0) |
Patient characteristics were measured at baseline.
Abbreviations: AE, adverse event; GH(R), growth hormone (receptor); IGF-1, insulin-like growth factor-1; Q1, quartile 1; Q3, quartile 3; SDS, standard deviation score; SPIGFD, severe primary IGF-1 deficiency.
aMeasured at first rhIGF-1 intake.
bData are only available from the enrolled population (N = 306); patients without a hypoglycemia AE, n = 159 (+1 vs safety population) and patients with ≥ 1 hypoglycemia AEs, n = 48 (equal to safety population).
cTanner stage 1 of genital development for boys and breast development for girls, respectively.
dTanner stage 2 or above of genital or breast development for boys or girls, respectively.
eLaron syndrome: SPIGFD and Laron syndrome confirmed by a reported GH receptor variant (with the exception of 1 patient reported to have “Laron Syndrome” as a secondary diagnosis).
Patients who had a history of prior hypoglycemia at treatment start (n = 25), compared with those who did not have a history of prior hypoglycemia (n = 279), had a significantly lower mean age (6.8 years [95% CI: 4.7; 8.9] vs 9.7 years [95% CI: 9.3; 10.2]), lower mean baseline HtSDS (−5.3 [95% CI: −6.3; −4.3] vs −3.6 [95% CI: −3.8; −3.5]), and more frequent diagnosis of Laron syndrome (40% [95% CI: 21.1; 61.3] vs 12.5% [95% CI: 8.9; 17.0]) (Supplementary Table S1 (16)).
Compared with patients who did not experience hypoglycemia (n = 224), patients who experienced ≥ 1 hypoglycemia AEs (n = 80) had a lower mean age at first rhIGF-1 injection (8.7 years vs 9.8 years, P = .054), a more frequent diagnosis of Laron syndrome (27.5% vs 10.3%, P < .001), and a more frequent history of hypoglycemia (18.8% vs 4.5%, P < .001), while baseline IGFBP-3 concentrations were similar (1999.7 ng/mL vs 1962.8; P = .879) (Table 1).
Most patients were younger 10 years of age when they experienced their first hypoglycemia AE; age at onset was recorded for 63 patients, of whom 17 were aged 2 to 7 years, 17 were aged >7 to 10 years, and 29 were aged >10 years. Of the 8 patients who experienced a serious hypoglycemia AE, 4 were aged 2 to 7 years, 1 patient was aged >7 to 10 years, and 3 patients were aged >10 years.
Of the 80 patients who experienced hypoglycemia AEs, 50 experienced a single event over the course of their treatment span. Of the remaining 30 patients, 20 patients experienced 2 hypoglycemia AEs, 9 patients experienced 3 to 6 hypoglycemia AEs, and 1 patient experienced the maximum number of 8 hypoglycemia AEs in total. This patient began treatment at 3 years old with a history of prior hypoglycemia and did not have Laron syndrome. A full list of diagnoses of patients with at least one hypoglycemia event is provided in Supplementary Table S2 (16).
Compared with patients who experienced 1 hypoglycemia AE (n = 50), patients who experienced ≥ 2 hypoglycemia AEs (n = 30) had a lower mean age at first rhIGF-1 injection, although this was not statistically significant (7.5 years vs 9.5 years, P = .071). In addition, compared with patients who experienced 1 hypoglycemia AE, patients who experienced ≥ 2 hypoglycemia AEs had a more frequent diagnosis of Laron syndrome (33.3% vs 24.0%, P = .367), a more frequent history of hypoglycemia prior to rhIGF-1 treatment start (30.0% vs 12.0%, P = .052), and a lower baseline IGFBP-3 concentration (1762.6 ng/mL vs 2155.0 ng/mL, P = .278).
At baseline, patients who experienced serious hypoglycemia AEs had a mean age of 8.1 years (SD: 6.4), mean HtSDS of −4.9 (SD: 1.4), and median circulating IGF-1 concentration of 67.1 ng/mL (Q1−Q3: 45.6; 157.0). Two patients (25.0%) who experienced serious hypoglycemia AEs had a history of hypoglycemia, and 5 patients (62.5%) had a diagnosis of Laron syndrome (Table 2).
Patient characteristics according to occurrence and intensity of serious hypoglycemia AEs
| Statistic | Moderate intensity (N = 2) | Severe intensity (N = 6) | Total (N = 8) | |
|---|---|---|---|---|
| Age, yearsa | n | 2 | 6 | 8 |
| Mean (SD) | 2.5 (0.5) | 10.0 (6.3) | 8.1 (6.4) | |
| Median (Q1; Q3) | 2.5 (2.1; 2.9) | 11.4 (3.1; 15.3) | 6.1 (2.5; 14.5) | |
| Height SDSa | n | 1 | 6 | 7 |
| Mean (SD) | −6.8 (NA) | −4.6 (1.2) | −4.9 (1.4) | |
| Median (Q1; Q3) | −6.8 (−6.8; −6.8) | −4.3 (−6.1; −3.9) | −4.4 (−6.2; −3.9) | |
| IGF-1 concentration, ng/mL | n | 0 | 4 | 4 |
| Mean (SD) | NA (NA) | 101.3 (98.5) | 101.3 (98.5) | |
| Median (Q1; Q3) | NA (NA) | 67.1 (45.6; 157.0) | 67.1 (45.6; 157.0) | |
| Height velocity, cm/year | n | 0 | 4 | 4 |
| Mean (SD) | NA (NA) | 4.0 (0.5) | 4.0 (0.5) | |
| Median (Q1; Q3) | NA (NA) | 4.1 (3.7; 4.4) | 4.1 (3.7; 4.4) | |
| Pubertal statusa | n | 2 | 5 | 7 |
| Prepubertal, n (%)b | 2 (100.0) | 4 (80.0) | 6 (85.7) | |
| Pubertal, n (%)c | 0 | 1 (20.0) | 1 (14.3) | |
| Diagnosis of Laron syndromed | n | 2 | 6 | 8 |
| Yes, n (%) | 2 (100.0) | 3 (50.0) | 5 (62.5) | |
| No, n (%) | 0 | 3 (50.0) | 3 (37.5) | |
| History of hypoglycemia | n | 2 | 6 | 8 |
| Yes, n (%) | 0 | 2 (33.3) | 2 (25.0) | |
| No, n (%) | 2 (100.0) | 4 (66.7) | 6 (75.0) | |
| Pubertal stage and previous growth-promoting therapy | n | 2 | 6 | 8 |
| Naïve prepubertal, n (%) | 2 (100.0) | 3 (50.0) | 5 (62.5) | |
| Previously treated with GPT, n (%) | 0 | 3 (50.0) | 3 (37.5) |
Patient characteristics were measured at baseline. A total of 13 serious hypoglycemia AEs were experienced by 8 patients, where patients experienced multiple hypoglycemia AEs, the highest intensity AE was recorded.
Abbreviations: AE, adverse event; GH, growth hormone; GPT, growth-promoting therapy; IGF-1, insulin-like growth factor-1; NA, not applicable; Q1, quartile 1; Q3, quartile 3; SDS, standard deviation score; SPIGFD, severe primary IGF-1 deficiency.
aMeasured at first rhIGF-1 intake.
bTanner stage 1 of genital development for boys and breast development for girls, respectively.
cTanner stage 2 or above of genital or breast development for boys or girls, respectively.
dLaron syndrome: SPIGFD and/or GH receptor variant or “Laron Syndrome” in secondary diagnosis.
Treatment Discontinuations
Treatment discontinuations due to an AE (including but not limited to hypoglycemia AEs) occurred in 16 patients (5.3%). Three patients discontinued treatment due to hypoglycemia, and 2 patients discontinued treatment due to hypoglycemic unconsciousness. Baseline characteristics of these 5 patients were similar to those of the whole safety population; mean age and HtSDS at the start of treatment were 13.2 years and −4.3 respectively, and 1 of these patients had a diagnosis of Laron syndrome.
Predictive Factors for Hypoglycemia
Predictors of future hypoglycemia in the safety population, which reached a threshold for significance of P < .2 and were included in the multivariate analysis, were age at first rhIGF-1 injection, sex, HtSDS at baseline, a diagnosis of Laron syndrome, and a history of hypoglycemia (Table 3). Only a history of hypoglycemia (OR 0.25; 95% CI: [0.11; 0.61]; P = .002) and a diagnosis of Laron syndrome (OR 0.36; 95% CI: [0.18; 0.72]; P = .004) reached significance in the multivariate analysis (Table 3). Baseline age did not significantly predict an increased risk of hypoglycemia. A history of hypoglycemia was the only predictive factor for an increased risk of hypoglycemia when Laron syndrome was excluded as a covariate (OR 0.20; 95% CI: [0.09; 0.47]; P < .001).
Predictive factors for occurrence of hypoglycemia (univariate and multivariate analyses)
| Variable | ≥ 1 hypoglycemia AEa (N = 304) | ≥ 2 hypoglycemia AEsb (N = 80) | ≥ 1 hypoglycemia AE in rhIGF-1 treatment-naïve and non-Laron syndrome patientsa (N = 248) | |||
|---|---|---|---|---|---|---|
| Odds ratio (95% CI) | P value | Odds ratio (95% CI) | P value | Odds ratio (95% CI) | P value | |
| Univariate analysis | ||||||
| Age at first rhIGF-1 injection | 0.94 (0.88; 1.00) | .054 | 0.91 (0.82; 1.01) | .071 | 0.95 (0.88; 1.02) | .165 |
| Sex (male as reference) | 1.41 (0.84; 2.38) | .196 | 1.06 (0.42; 2.64) | .907 | 1.54 (0.84; 2.82) | .162 |
| HtSDS at baseline | 0.83 (0.69; 1.00) | .053 | 0.80 (0.59; 1.09) | .156 | 0.87 (0.68; 1.11) | .265 |
| Pubertal stage (prepubertal as reference)c | 0.72 (0.34; 1.52) | .383 | 0.65 (0.15; 2.74) | .558 | 0.54 (0.20; 1.48) | .234 |
| rhIGF-1 dose at time of hypoglycemia* | 1.00 (1.00; 1.01) | .460 | 1.02 (1.00; 1.04) | .030 | 1.01 (1.00; 1.02) | .195 |
| History of hypoglycemia (yes as reference) | 0.20 (0.09; 0.47) | <.001 | 0.32 (0.10; 1.01) | .052 | 0.16 (0.05; 0.51) | .002 |
| Previous growth-promoting therapy | 1.08 (0.62; 1.89) | .779 | 1.69 (0.61; 4.73) | .316 | 1.09 (0.55; 2.15) | .815 |
| Laron syndrome (yes as reference)d | 0.30 (0.16; 0.58) | <.001 | 0.63 (0.23; 1.71) | .367 | NA | NA |
| IGF-1 concentration at baseline | 1.00 (1.00; 1.00) | .946 | 1.00 (1.00; 1.01) | .923 | 1.00 (1.00; 1.00) | .771 |
| IGFBP–3 concentration at baseline | 1.00 (1.00; 1.00) | .879 | 1.00 (1.00; 1.00) | .278 | 1.00 (1.00; 1.00) | .660 |
| Weight at baseline | 0.99 (0.97; 1.02) | .696 | 0.96 (0.92; 1.01) | .087 | 0.99 (0.95; 1.03) | .577 |
| BMI at baseline | 1.05 (0.95; 1.15) | .327 | 0.86 (0.69; 1.06) | .156 | 0.98 (0.83; 1.15) | .765 |
| Multivariate analysis | ||||||
| History of hypoglycemia | 0.25 (0.11; 0.61)e | .002 | NA | NA | 0.16 (0.05; 0.51) | .002 |
| Laron syndrome (yes as reference) | 0.36 (0.18; 0.72) | .004 | NA | NA | NA | NA |
aCompared with patients without any hypoglycemia AEs.
bCompared with patients with one hypoglycemia AEs.
cPrepubertal patients: Tanner stage 1 of genital development for boys and breast development for girls, respectively. Pubertal: Tanner stage 2 or above of genital or breast development for boys or girls, respectively.
dLaron syndrome: SPIGFD and/or GH receptor variant or “Laron Syndrome” in secondary diagnosis.
eA history of hypoglycemia remained as the only predictive factor when excluding Laron syndrome as a covariate (OR 0.20; 95% CI: [0.09; 0.47]; P < .001).
*For patients with multiple hypoglycemia AEs, the greatest dose at a given hypoglycemia AE was used, and for patients without hypoglycemia, the average dose during the first year of treatment was used.
Abbreviations: AE, adverse event; HtSDS, height standard deviation score; IGF-1, insulin-like growth factor-1; GH, growth hormone; rhIGF-1, recombinant human IGF-1; IGFBP-3, insulin-like growth factor-binding protein 3; NA, not applicable; OR, odds ratio; SPIGFD, severe primary IGF-1 deficiency.
In patients who were rhIGF-1 treatment-naïve and did not have Laron syndrome (n = 248), predictors included in the multivariate analysis were: age at first rhIGF-1 injection, sex, rhIGF-1 dose, and a history of hypoglycemia. Of these predictors, only a history of hypoglycemia (OR 0.16; 95% CI: [0.05; 0.51]; P = .002) reached the threshold for significance of P < .05 (Table 3). Baseline age, sex, and IGF-1 concentration did not significantly predict an increased risk of hypoglycemia in these patients.
In patients who experienced ≥ 2 hypoglycemia events compared with 1 hypoglycemia event, age at first rhIGF-1 injection, HtSDS at baseline, rhIGF-1 dose, a history of hypoglycemia, weight, and BMI reached threshold significance (P < .2) in the univariate analysis. However, none of the predictors had a statistically significant OR in the multivariate analysis, despite increased rhIGF-1 dose mildly affecting the odds of patients being at risk of experiencing multiple hypoglycemia events (OR 1.02; 95% CI: [1.00; 1.04]; P = .030) in the univariate analysis.
rhIGF-1 Dose and Duration of Treatment in Relation to Hypoglycemia
In patients who experienced hypoglycemia events, mean rhIGF-1 dose at the onset of first hypoglycemia event did not significantly differ from the average first-year dose of patients who did not experience hypoglycemia (93.3 µg/kg [SD: 34.7] vs 89.4 µg/kg [SD: 35.8]; P = .460). However, in the univariate analysis, the mean rhIGF-1 dose was significantly higher in patients who experienced 2 or more hypoglycemia events compared with patients who experienced a single hypoglycemia event (117.0 µg/kg [SD: 26.1] vs 98.4 µg/kg [SD: 35.3]; P = .030). Most patients (81.0%) did not have a dose adjustment following their first hypoglycemia event. The percentage of patients whose dose remained unadjusted was numerically similar between those who experienced 1 hypoglycemia event (80.0%) and those who experienced 2 or more events (82.8%).
Patients who experienced hypoglycemia had a median treatment duration of 188.0 days (95% CI: [98.0; 367.0]) before their first hypoglycemia event and a median rhIGF-1 dose of 100.0 µg/kg twice daily (95% CI: [90.0; 120.0]) at the onset of their first hypoglycemia event. Patients who experienced serious hypoglycemia had a median treatment duration of 88.0 days (95% CI: [14.0; 1620.0]) before their first hypoglycemia event and a median rhIGF-1 dose of 80.0 µg/kg twice daily (95% CI: [40.0; 120.0]) at the onset of their first serious hypoglycemia event.
Of the patients who experienced early hypoglycemia (within 30 days of initiating rhIGF-1 treatment; n = 15), 4 (26.7%) had a diagnosis of Laron syndrome. Additional characteristics of these patients, including rhIGF-1 dose and prior hypoglycemia status, are available in Supplementary Table S3 (16).
For serious and nonserious hypoglycemia events in patients who were rhIGF-1 treatment-naïve and did not have Laron syndrome (n = 56), the median treatment duration was 142.0 days (95% CI: [61.0; 457.0]) and median rhIGF-1 dose was 115.0 µg/kg twice daily (95% CI: [90.0; 120.0]) at the onset of their first hypoglycemia event. Serious hypoglycemia events were experienced by 3 of these patients, and they had a median treatment duration of 77.0 days (95% CI: [8.0; 78.0]) and a median rhIGF-1 dose of 65.0 µg/kg twice daily (95% CI: [50.0; 80.0]) at the onset of their first serious hypoglycemia event.
Time to onset of first hypoglycemia event did not differ significantly between patients who received a mean rhIGF-1 dose ≤ 100 µg/kg twice daily and patients who received a mean rhIGF-1 dose >100 µg/kg twice daily in their first year of treatment (Gehan test: P = .636) (Fig. 2). The total amount of rhIGF-1 treatment exposure in the enrolled population was 1165.0 patient-years.
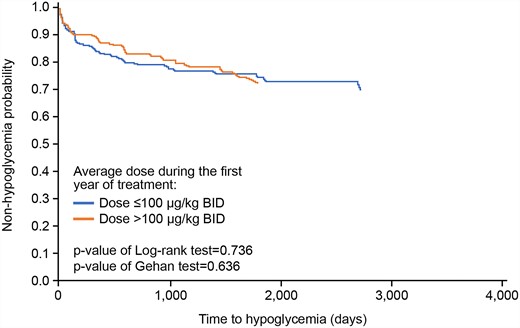
Time to first hypoglycemia AE. Time to a hypoglycemia AE was compared in the safety population according to mean 1-year rhIGF-1 dose (≤ 100 μg/kg twice daily vs >100 μg/kg twice daily ) using a Gehan test and was drawn on a survival curve using the Kaplan-Meier method. Abbreviations: AE, adverse event; rhIGF-1, recombinant DNA-derived human insulin-like growth factor 1.
Hypoglycemia Events and Height Change From Baseline
Mean change in HtSDS remained numerically similar between patients who did and did not experience hypoglycemia throughout the length of the study, and mean HtSDS tended to increase over time in all patient groups irrespective of hypoglycemia occurrence (Table 4). The greatest height gain was observed in Year 1 of treatment and this increase tended to decline from there on. Mean HtSDS remained above baseline over the duration of the analysis. The occurrence of hypoglycemia did not impact overall height gain (Fig. 3).
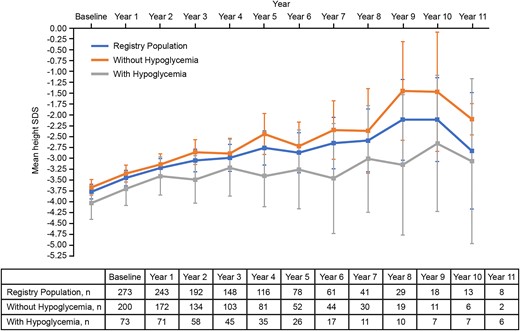
Mean height SDS across patient populations. Mean height SDS was analyzed descriptively in the registry population, between patients who did not experience hypoglycemia and patients who experienced ≥ 1 hypoglycemia AEs over the course of treatment. Error bars represent 95% CIs. Abbreviations: AE, adverse event; SDS, standard deviation score.
Mean height SDS and mean change from baseline in height SDS in patients who did or did not experience hypoglycemia AEs (registry population)
| n | Mean height SDS (95% CI) | n | Mean change from baseline in height SDS (95% CI) | |
|---|---|---|---|---|
| Registry population | ||||
| Baseline | 273 | −3.77 (−3.93; −3.60) | NA | NA |
| Year 1 | 243 | −3.45 (−3.63; −3.28) | 219 | 0.35 (0.29; 0.41) |
| Year 2 | 192 | −3.22 (−3.44; −3.01) | 176 | 0.67 (0.57; 0.78) |
| Year 3 | 148 | −3.05 (−3.31; −2.79) | 135 | 0.86 (0.73; 0.99) |
| Year 4 | 116 | −2.99 (−3.30; −2.68) | 104 | 1.03 (0.88; 1.18) |
| Year 5 | 78 | −2.76 (−3.16; −2.37) | 69 | 1.12 (0.91; 1.32) |
| Year 6 | 61 | −2.87 (−3.33; −2.41) | 54 | 1.01 (0.80; 1.22) |
| Year 7 | 41 | −2.65 (−3.24; −2.06) | 36 | 1.32 (1.02; 1.61) |
| Year 8 | 29 | −2.59 (−3.32; −1.87) | 27 | 1.31 (0.89; 1.72) |
| Year 9 | 18 | −2.11 (−3.04; −1.19) | 16 | 1.73 (1.34; 2.13) |
| Year 10 | 13 | −2.11 (3.07; −1.15) | 11 | 1.98 (1.48; 2.47) |
| Year 11 | 8 | −2.83 (−4.16; −1.49) | 6 | 1.81 (0.83; 2.79) |
| Patients without a hypoglycemia AE | ||||
| Baseline | 200 | −3.67 (−3.84; −3.49) | NA | NA |
| Year 1 | 172 | −3.35 (−3.54; −3.16) | 154 | 0.33 (0.26; 0.40) |
| Year 2 | 134 | −3.14 (−3.38; −2.90) | 121 | 0.64 (0.52; 0.76) |
| Year 3 | 103 | −2.86 (−3.14; −2.57) | 92 | 0.85 (0.69; 1.01) |
| Year 4 | 81 | −2.89 (−3.25; −2.54) | 71 | 1.01 (0.84; 1.18) |
| Year 5 | 52 | −2.44 (2.91; −1.97) | 46 | 1.16 (0.91; 1.42) |
| Year 6 | 44 | −2.72 (−3.26; −2.17) | 40 | 1.05 (0.81; 1.29) |
| Year 7 | 30 | −2.35 (−3.02; −1.68) | 28 | 1.30 (0.97; 1.62) |
| Year 8 | 19 | −2.37 (3.34; −1.40) | 19 | 1.35 (0.83; 1.86) |
| Year 9 | 11 | −1.45 (−2.58; −0.32) | 11 | 1.69 (1.25; 2.14) |
| Year 10 | 6 | −1.47 (−2.84; −0.10) | 6 | 2.07 (1.55; 2.60) |
| Year 11 | 2 | −2.10 (−2.46; −1.74) | 2 | 1.75 (−4.92; 8.42) |
| Patients with ≥ 1 hypoglycemia AE | ||||
| Baseline | 73 | −4.03 (−4.40; −3.66) | NA | NA |
| Year 1 | 71 | −3.70 (−4.08; −3.32) | 65 | 0.40 (0.28; 0.52) |
| Year 2 | 58 | −3.41 (−3.85; −2.97) | 55 | 0.75 (0.57; 0.94) |
| Year 3 | 45 | −3.49 (−4.03; −2.94) | 43 | 0.88 (0.65; 1.11) |
| Year 4 | 35 | −3.22 (−3.87; −2.57) | 33 | 1.07 (0.77; 1.37) |
| Year 5 | 26 | −3.41 (−4.11; −2.72) | 23 | 1.02 (0.66; 1.37) |
| Year 6 | 17 | −3.26 (−4.16; −2.35) | 14 | 0.91 (0.41; 1.42) |
| Year 7 | 11 | −3.46 (−4.73; −2.20) | 8 | 1.38 (0.52; 2.25) |
| Year 8 | 10 | −3.01 (−4.24; −1.79) | 8 | 1.20 (0.29; 2.11) |
| Year 9 | 7 | −3.15 (−4.76; −1.54) | 5 | 1.82 (0.60; 3.03) |
| Year 10 | 7 | −2.66 (−4.22; −1.09) | 5 | 1.86 (0.60; 3.12) |
| Year 11 | 6 | −3.07 (−4.96; −1.17) | 4 | 1.84 (0.04; 3.64) |
Abbreviations: AE, adverse event; NA, not applicable; SDS, standard deviation score.
Discussion
There are only limited data on the frequency, timing, and severity of hypoglycemic events in patients with severe GH insensitivity syndrome (GHIS), and even fewer data for patients with less severe forms of the disease. To our knowledge, this is the first report of an extended analysis of subgroups and risk factors for the development of hypoglycemia under treatment with rhIGF-1 and presents data from the largest and longest running database of children with SPIGFD treated with rhIGF-1. In addition, there is a discrepancy between the frequency of symptomatic hypoglycemia events reported in clinical trials (49%) and in postmarketing data (28%) for rhIGF-1 (2, 10, 11). Our analysis of data from the Eu-IGFD registry demonstrates that 26.3% (n = 80/304) of patients with SPIGFD experienced treatment-induced hypoglycemia events, in line with postmarketing data. Serious hypoglycemia events were experienced by a total of 8 patients (2.6%). The number of hypoglycemia events per patient per treatment year was 0.11, and the number of serious hypoglycemia events per patient per treatment year was 0.01.
In agreement with previous studies, this analysis found that a prior history of hypoglycemia predicted future hypoglycemia events, along with a diagnosis of Laron syndrome (1, 19). However, Laron syndrome represents the most extreme form of SPIGFD, and hypoglycemia is known to occur spontaneously in these patients (1, 20). Nevertheless, a prior history of hypoglycemia remained a significant predictor of future hypoglycemia events, even when analyses excluded patients with a diagnosis of Laron syndrome, or when the multivariate analysis model excluded Laron syndrome as a covariate. This result aligns with current models, where more severe GH insensitivity tends to result in greater concentrations of free circulating IGF-1, unbalanced insulin-like effects of rhIGF-1 and reduced blood glucose levels (21). No other potential predictors reached significance in the multivariate analyses, although in the univariate analysis, a greater rhIGF-1 dose was found to slightly increase the odds of multiple hypoglycemia events in patients who had already experienced at least one event previously. Previous study data suggest that most hypoglycemia events experienced by patients with SPIGFD are due to rhIGF-1 overdosage or dosing without an adequate meal (22, 23). Thus, for patients who are at high risk for hypoglycemia, treatment dose should be tightly controlled and monitored (19). In addition, an emphasis on patient/family education is crucially important to mitigate the risk of developing hypoglycemia events.
Of the 80 patients who experienced hypoglycemia events, 32 underwent genetic testing for Laron syndrome, and the prevalence of Laron syndrome in patients who underwent genetic tests was 65.6% (n = 21/32). Therefore, the number of patients with Laron syndrome may be greater than previously thought. Although a genetic test is not necessary to diagnose SPIGFD, increasing the use of genetic tests for patients with suspected SPIGFD could help to determine risk status for hypoglycemia, especially considering the challenges of accurately measuring serum IGF-1 and IGFBP-3 concentrations, due to the wide variety of assay providers, which may have obfuscated any relationship between these measurements and hypoglycemia risk in this analysis.
There is a need for further research into the causes of hypoglycemia in patients with SPIGFD. For example, patients with severe GH insensitivity are at risk of developing hypoglycemia (as observed in patients with Laron syndrome) (21). However, it is not known whether high plasma concentration of free IGF-1 following treatment with rhIGF-1, and/or extremely low concentration of circulating IGF-binding proteins (IGFBPs) further contribute to hypoglycemia risk in these patients (24). In rare cases, patients with Laron syndrome can present with asymptomatic hypoglycemia before rhIGF-1 treatment, with postprandial hyperglycemia, as demonstrated by continuous glucose monitoring. Postprandial hyperglycemia is a possible metabolic consequence of chronic IGF-1 deficiency (1, 19, 25). The documented beneficial effect of rhIGF-1 treatment on postprandial hyperglycemia may be ascribable to improved postprandial transfer of glucose.
Hypoglycemia is also a complication observed in the management of type 1 diabetes mellitus (26, 27). However, in a cohort of children and adolescents with type 1 diabetes mellitus, advancements in care, including regular glucose monitoring, patient management, and proper education successfully reduced hypoglycemia incidence estimates from a high of 17.3 per 100 patient-years in 2001 down to 5.8 per 100 patient-years in 2006 (27, 28). The heterogeneity of risk profiles in patients with SPIGFD may suggest that in children with a high risk of hypoglycemia, monitoring of blood glucose should be encouraged until a well-tolerated dose is established and in case of severe hypoglycemic symptoms. However, educational efforts to make sure that rhIGF-1 injections are not given in the absence of a meal or following exercise is paramount in the management of patients with SPIGFD. Furthermore, highlighting the risk of hypoglycemia, as well as the signs, symptoms and treatment of hypoglycemia is also a major component of the education of patients/caregivers. In some centers, regular blood glucose monitoring during the first weeks of treatment is recommended; however, the lack of association from the time of treatment to the start of a hypoglycemic event does not support that this approach may identify children at risk of having a hypoglycemic event (29).
Hypoglycemia prior to rhIGF-1 treatment can be part of the phenotype of SPIGFD and could increase the risk of developing hypoglycemia during treatment. Short stature prior to treatment is also part of the phenotype for SPIGFD, with HtSDS associated with height gain in response to rhIGF-1 treatment (1, 2). It is recommended that the dose of rhIGF-1 is reduced if a patient develops hypoglycemia. Therefore, a dose decrease of rhIGF-1 could have an impact on effectiveness as treatment response is known to be dose dependent (10). To this end, the current analysis aimed to evaluate the effectiveness of rhIGF-1 treatment through HtSDS gain in the registry population, and to assess HtSDS gain between patients who did and did not experience hypoglycemia events. In line with previous research, rhIGF-1 therapy was found to promote linear growth in children with SPIGFD, and the greatest change in height velocity was observed in the first year of treatment, diminishing in subsequent years, but remaining above baseline for at least 6 years following treatment initiation (10, 13, 30). The occurrence of one or more hypoglycemia events had no statistically significant impact on HtSDS gain overall and had no clinically relevant impact on the effectiveness of rhIGF-1 in the real-world setting.
Limitations
The noninterventional and observational nature of the registry precluded any investigation into the causality of predictive factors. Furthermore, it was not possible to perform a meaningful analysis on circulating total and free IGF-1, and on the role of IGFBPs in the pathophysiology of hypoglycemia due to the heterogeneity of laboratory assays and the temporal variation of blood sampling. Similarly, sex and age defined normative ranges for IGF-1/IGFBPs concentrations were unavailable and could not be converted to SDSs as many assay providers do not provide these data. Therefore, a comparison of normative ranges between countries/centers/assays could not be performed.
This analysis found a similar incidence of hypoglycemia to that reported in postmarketing data for rhIGF-1 (28%) (11). However, another long-term controlled study reported hypoglycemia in 49% of patients treated with rhIGF-1, a markedly higher incidence than reported in the current analysis (10). Although hypoglycemia should be reported systematically in the registry, the observational nature of the study means that it is possible that not all hypoglycemia events experienced by patients were reported. In addition, a large number of hypoglycemia events were not verified by a physician (ie, were suspected events) and others may have gone undocumented by the patients/parents, therefore the number of hypoglycemia events reported in this study may be an under/over estimation. Capillary blood glucose monitoring would allow for easier verification of hypoglycemia events and would potentially highlight any relationship between rhIGF-1 dose, feeding, and hypoglycemia risk, which could not be determined in this analysis.
The clinical diagnoses categories could be a limitation and subject to investigator bias, exacerbated by the lack of requirement for genetic testing. In addition, subsequent to data collection and analysis of the current study data, the study registry report form has been updated to contain a more advanced genetic reporting panel. This enables the reporting physician to select a specific genetic result in specific genes and state whether a pathogenic variant was found or not. Variant data from specific genes can be captured in the updated registry report form, in addition to capturing findings from genes that are not predefined in the form. However, the report form that was used in the present analysis does not allow for this level of detail to be captured, so it is not possible to tell which genes were unaffected.
Lastly, the impact of hypoglycemia on quality of life (QoL) was not determined and remains insufficiently reported in patients presenting with SPIGFD. Both short stature and hypoglycemia negatively impact QoL, and future reports of hypoglycemia-related QoL in patients with SPIGFD would provide a clearer understanding of the degree of burden, which could support treatment decisions (31-33).
Despite these limitations, this study provides a valuable insight into the long-term (>11 years) safety and efficacy of rhIGF-1 treatment.
Conclusion
Patients with a history of hypoglycemia and/or presenting with Laron syndrome are at the greatest risk of developing hypoglycemia following treatment with rhIGF-1 and should be carefully monitored following rhIGF-1 administration that should coincide with feeding schedules. However, these risk factors identify only a minority of children who will experience hypoglycemia events, and the severity of such events underlines the importance of patient/caregiver education and treatment management for all children receiving rhIGF-1. More studies are required to ascertain the mechanisms and risk factors for hypoglycemia in patients receiving rhIGF-1.
Acknowledgments
The authors thank all patients involved in the study, as well as their caregivers, care team, investigators, and research staff in participating institutions. The authors thank Reuben Duncan, and Marc Lynch, PhD, of Costello Medical, for medical writing support, which was sponsored by Ipsen in accordance with Good Publication Practice guidelines.
Funding
This study was sponsored by Ipsen.
Author Contributions
Substantial contributions to study conception and design: P.B., M.P., A.B., M.M., J.A., M.R.K., C.S., V.P., S.M., J.W.; substantial contributions to analysis and interpretation of the data: P.B., M.P., A.B., M.M., J.A., M.R.K., C.S., V.P., S.M., J.W.; drafting the article or revising it critically for important intellectual content: P.B., M.P., A.B., M.M., J.A., M.R.K., C.S., V.P., S.M., J.W.; final approval of the version of the article to be published: P.B., M.P., A.B., M.M., J.A., M.R.K., C.S., V.P., S.M., J.W.
Disclosures
P.B. received: advisory board/board of directors’ fees from Ipsen, Lilly; and consultancy fees from Ipsen, Sandoz, Pfizer, Lilly, and Versatis. M.P. received: advisory board/board of directors’ fees from Ipsen, Novo Nordisk, Pfizer, France; research support from Ipsen, Novo Nordisk, Pfizer, Sandoz, Merck, Sanofi, and French Public Research funds (ANR and PHRC); and speaker fees from Novo Nordisk, and Ipsen. A.B. received: travel grants from Ipsen, Sandoz, and IBSA; speaker fees from Ipsen, IBSA, Sandoz, Pfizer, and Novo Nordisk. M.M. received: advisory board fees from Sandoz, Pfizer, Merck Serono, Ipsen, Ferring, Biomarin, and Novo Nordisk; research support from Pfizer, Novo Nordisk, and Merck Serono; and speaker fees from Pfizer Sandoz, Pfizer, Novo Nordisk, and Biomarin. J.A. received: speaker fees from Pfizer, Sandoz, and Novo Nordisk. M.R.K. received: advisory board fees from Pfizer and Novo Nordisk; speaker fees from Novo Nordisk, Pfizer, and Sandoz. C.S., V.P., and S.M. are employees of Ipsen. J.W. received: advisory board/board of directors’ fees from Ipsen and Novo Nordisk; research support from Pfizer and Ipsen; and speaker fees from Merck-Serono, Hexal, Pfizer, and Novo Nordisk.
Data Availability
Qualified researchers may request access to patient-level study data that underlie the results reported in this publication. Additional relevant study documents, including the clinical study report, study protocol with any amendments, annotated case report form, statistical analysis plan, and dataset specifications may also be made available. Patient-level data will be anonymized, and study documents will be redacted to protect the privacy of study participants.
Where applicable, data from eligible studies are available 6 months after the studied medicine and indication have been approved in the US and EU or after the primary manuscript describing the results has been accepted for publication, whichever is later.
Further details on Ipsen's sharing criteria, eligible studies and process for sharing are available here (https://vivli.org/members/ourmembers/). Any requests should be submitted to www.vivli.org for assessment by an independent scientific review board.
Clinical Trial Information
ClinicalTrials.gov registration No. NCT00903110.
References
Abbreviations
- AE
adverse event
- BMI
body mass index
- GH
growth hormone
- GHR
growth hormone receptor
- HtSDS
height standard deviation score
- IGF-1
insulin-like growth factor 1
- IGF-1R
insulin-like growth factor 1 receptor
- IGFBP
insulin-like growth factor binding protein
- OR
odds ratio
- QoL
quality of life
- rhIGF-1
recombinant DNA-derived human IGF-1
- SDS
standard deviation score
- SPIGFD
severe primary insulin-like growth factor-1 deficiency
