


Abstract
There is little evidence regarding the joint effect of serum adipocyte fatty acid binding protein (A-FABP) levels and obesity phenotype on the risk of cardiovascular events.
To explore the association between serum A-FABP levels and obesity phenotype defined by fat percentage (fat%) and visceral fat area (VFA), and their joint impact on incident cardiovascular events.
A total of 1345 residents (579 men and 766 women) without previous cardiovascular diseases at baseline, with body composition and serum A-FABP data available, were included. A bioelectrical impedance analyzer and magnetic resonance imaging were used to assess fat% and VFA, respectively.
During a mean follow-up of 7.6 years, 136 cases of cardiovascular events (13.9 per 1000 person-years) occurred. Per 1-unit increase in loge-transformed A-FABP levels was associated with an increase in cardiovascular events risk (hazard ratio [HR] 1.87, 95% CI 1.33-2.63). The highest tertiles of fat% and VFA levels were related to higher risks of cardiovascular events (fat%: HR 2.38, 95% CI 1.49-3.81; VFA: HR 1.79, 95% CI 1.09-2.93). The association between A-FABP levels and cardiovascular events was more pronounced in participants with low fat%, regardless of VFA levels. The joint effect of high A-FABP levels and obesity resulted in a greater risk of cardiovascular events.
Serum A-FABP levels were significantly associated with the risk of cardiovascular events, and this pattern of association was more prominent among the population with low fat%, which was independent of VFA.
The prevalence of obesity is increasing considerably and is a global epidemic. According to the latest World Health Organization (WHO) data in 2016, over 1.9 billion adults were overweight, of which over 650 million were obese (1). If the trend continues, the proportion of men and women with obesity is estimated to be at least 18% and 21% in 2025, respectively (2). Furthermore, the increasing prevalence of obesity is threatening cardiovascular health, leading to numerous metabolic disorders, including hypertension (3), diabetes (4), and coronary heart diseases (5). Accumulating studies have focused on the microenvironment of the adipose tissue and its impact on systemic metabolism (6, 7), which shed light on the pathogenesis of obesity-related cardiovascular diseases (CVDs).
Adipokines work as a crucial component of the “adipo–cardiovascular axis”, mediating the crosstalk between adipose tissues and CVD (8). Adipocyte fatty acid binding protein (A-FABP, also known as aP2 or FABP-4) is a member of the intracellular lipid chaperone family, which orchestrates lipid transportation and integrates inflammation and metabolic deterioration. Though A-FABP has no typical secretory signal peptides in the sequence, previous studies have indicated that it could be secreted from adipocytes via a nonclassical pathway and acting as an adipokine (9). Experimental evidence showed that A-FABP knockout mice exhibited a preserved cardiac function after myocardial ischemia/reperfusion injury (10). Moreover, increasing studies from population-based studies have implied that A-FABP might play an important role in CVD. A study of 61 patients with end-stage renal disease found that, after a 7-year follow-up, serum A-FABP levels were positively associated with the risk of cardiovascular events (11). Another study of 176 patients with type 2 diabetes revealed that serum A-FABP levels had negative effects on cardiovascular outcomes (12). However, evidence from previous studies is somehow limited by population selection or relatively small sample size. There are very few studies based on the community-dwelling population.
Our previous study found that fat mass and visceral fat area (VFA) were significantly associated with serum A-FABP levels in a nondiabetic population (13). Considering the close relationship between A-FABP and obesity, we infer that A-FABP and obesity may interact to promote vascular damage. Nevertheless, it is still unclear whether the predictive ability of A-FABP can be modified by different types of obesity.
To fill this gap, we aimed to explore the association and joint effect between serum A-FABP levels and obesity phenotype with future cardiovascular events in a middle-aged and elderly community-based population.
Materials and Methods
Study Population
The study participants were acquired from an ongoing, community-based, prospective cohort study in Shanghai, China. From October 2013 to October 2014, 2433 residents were recruited to participate in the study. They were asked to complete standardized questionnaires, physical examinations, laboratory tests, and body composition measurements. The contents of the questionnaires included the history of current and past diseases, medication, family diseases, and personal habits. From October 2021 to February 2022, the follow-up was conducted by phone calls or through electronic medical records, with a mean follow-up period of 7.6 ± 0.6 years. All participants signed informed consent before participating in the study. This study was approved by the Ethics Committee of the Sixth People's Hospital affiliated to Shanghai Jiao Tong University School of Medicine.
In the current analyses, we excluded those with previous malignant tumors (n = 27), thyroid dysfunction or hyperthyroidism or hypothyroidism (n = 94), liver or kidney dysfunction (n = 23), CVD or cerebrovascular diseases (n = 43), treated with steroids or thyroxine (n = 43), aged < 50 years (n = 298), missing data on VFA or serum A-FABP levels (n = 114), and premenopausal women (n = 79) at baseline. After excluding those who were lost to follow-up (n = 336) or died due to non-CVD events (n = 31) during the follow-up, a total of 1345 participants aged 50-80 years, who were CVD-free at baseline, with body composition and A-FABP data available, were finally included. There were no significant differences in age, and the proportion of sex, lifestyle-related parameters, comorbidities, and metabolic profiles between those included and excluded from the study for the absence of follow-up or missing data (all P > .05).
Baseline Anthropometric and Laboratory Measurements
Height, weight, waist circumference, and blood pressures were measured by trained staffs using standard protocols: body mass index (BMI) = weight (kg)/height2 (m2).
At baseline, all participants fasted for at least 10 hours before blood sample collection; measurement included fasting plasma glucose, fasting insulin, glycated hemoglobin A1c, total cholesterol, triglyceride, high-density lipoprotein cholesterol, low-density lipoprotein cholesterol, C-reactive protein, and A-FABP levels.
Serum adipocyte-specific isoform of FABP (A-FABP or FABP4) levels were quantified by sandwich enzyme-linked immunosorbent assay (Cat#31030, RRID:AB_2933962, Antibody and Immunoassay Services, University of Hong Kong, Hong Kong, China). The corresponding intra-assay and interassay coefficients were 6.6% and 8.7%, respectively.
Participants with a history of diabetes received 100 g of steamed bread meal, while those without a history of diabetes received a 75-g oral glucose tolerance test instead. All measurements were tested according to the standardized protocol as previously described (14). The homeostatic model assessment of insulin resistance (HOMA-IR) was calculated as fasting plasma glucose (mmol/L) × fasting insulin (mU/L)/22.5 (15).
Baseline Body Composition Measurement
Total fat mass, fat percentage (fat%), and fat-free mass were measured using an automatic bioelectrical impedance analyzer (BIA; TBF-418B; Tanita Corp., Tokyo, Japan). Magnetic resonance imaging (Archiva 3.0 T; Philips Medical System, Amsterdam, The Netherlands) was used to assess VFA, and image analysis software (slice-O-matic, version 4.2; Tomovision Inc., Montreal, Quebec, Canada) was used to calculate VFA values.
Ascertainment of Cardiovascular Events
The outcome of the study was a composite of the first occurrence of ischemic heart disease and cerebrovascular event (16). Ischemic heart disease included myocardial infarction, unstable angina pectoris, hospitalization for heart failure, coronary revascularization, and cardiac death. Cerebrovascular event included ischemic stroke and death due to a cerebrovascular event. Information on cardiovascular events was first collected by phone calls, which included specific details of illness, hospitalization, laboratory tests, and medication according to standardized questionnaires. For outcome ascertainment, parts of the medical records (discharge summary and results of relevant diagnostic and laboratory tests) were requested and assembled. Fatal cardiovascular events were confirmed by hospital records or listed as the cause of death on death certificates. Afterward, all incident cardiovascular events were adjudicated by 2 trained physicians independently, who were masked to the baseline characteristics of study participants. The International Classification of Diseases-10 (ICD-10) codes were further used to classify cardiovascular events (cardiovascular events were coded from I00 to I99). The self-reported events and death had high sensitivity (96.7%) and specificity (99.8%) confirmed by medical records and death certificates.
Definitions
Two definitions for high fat% and VFA were used to test the robustness of our results. According to body fat distribution in our cohort, the highest tertiles of fat% and VFA were defined as high fat% and high VFA. For fat%, the cut-off values were 22.3% for men and 35.2% for women. For VFA, the cut-off value was 103.3 cm2. According to the WHO 2000 criteria, fat% ≥ 25% in men or fat% ≥ 35% in women was classified as high fat% (17). VFA ≥ 80 cm2 was defined as high VFA (18).
Based on fat% and VFA levels, the obesity phenotype was classified into 4 categories (1): low fat% with low VFA (2); low fat% with high VFA (3); high fat% with low VFA (4); high fat% with high VFA.
Participants who smoked at least 1 cigarette per day for more than 6 months at baseline were defined as current smokers. Alcohol use was defined as drinking at least 20 g per day for at least 6 months. Physical activity levels were classified as light, moderate, and high, according to the International Physical Activity Questionnaire 2010 (19).
According to the 2020 guidelines of the International Society of Hypertension, those with systolic blood pressure ≥140 mmHg, and/or diastolic blood pressure ≥90 mmHg, and/or use of antihypertensive medications were identified as hypertension (20). Based on the American Diabetes Association 2021 guidelines, diabetes was identified by fasting plasma glucose ≥7.0 mmol/L, and/or 2 hours plasma glucose ≥11.1 mmol/L, and/or glycated hemoglobin A1c ≥6.5%, and/or a previous diagnosis of diabetes (21). The Chinese guidelines for the management of dyslipidemia in adults 2016 were used to assess dyslipidemia (22).
Statistical Analysis
Baseline characteristics were summarized according to sex-specific serum A-FABP levels to avoid potential sex influence: for men, lowest tertile ≤4.26 ng/mL; middle tertile 4.27 to 7.44 ng/mL; highest tertile ≥7.45 ng/mL; for women, lowest tertile ≤8.12 ng/mL; middle tertile 8.13 to 13.59 ng/mL; highest tertile ≥13.60 ng/mL. Continuous variables are presented as median (interquartile range), while categorical variables are described as number (proportion). The Kruskal–Wallis test was used to compare continuous variables and the chi-square test for categorical variables. For those who died or developed cardiovascular events during the follow-up, the duration of follow-up (person-years) was tabulated from baseline to the date of death or diagnosis of cardiovascular events, whichever came first. For those who did not die or develop cardiovascular events, the duration of follow-up was tabulated from baseline to the date of follow-up. The incidence rate of cardiovascular events was calculated per 1000 person-years with the event number as the numerator and the total person-years as denominator.
Cox proportional hazards models were used to investigate the association between baseline A-FABP levels and subsequent cardiovascular events in the total population, men, and women. Multivariate analyses were adjusted for age, sex, smoking, alcohol use, family history of CVD, physical activity, fruit and vegetable intake, red meat intake, diabetes, hypertension, dyslipidemia, C-reactive protein, HOMA-IR, fat%, and VFA. We applied 3 sensitivity analyses: (1) excluding cases within the first year of follow-up; (2) excluding participants with extreme A-FABP concentration (below the 1st and above 99th percentile in men and women, respectively); and (3) excluding participants aged ≥75 years.
Furthermore, stratified analyses were performed to assess the risk of cardiovascular events associated with A-FABP levels according to different obesity phenotypes. We analyzed the effect of multiplicative interactions of obesity phenotype with A-FABP on cardiovascular events by including the respective product term (obesity phenotype × A-FABP) in the model. The joint effects of A-FABP tertiles and obesity phenotype on cardiovascular events were further evaluated.
To compare the performance of the models with and without A-FABP, receiver operating characteristic analysis, changes in continuous net reclassification improvement (NRI), and integrated discrimination improvement (IDI) were examined. The traditional risk factors included age, sex, systolic blood pressure, antihypertensive drug, smoking, total cholesterol, and high-density lipoprotein cholesterol.
Statistical analyses were conducted by R software 4.0.3 (R Foundation for Statistical Computing, Vienna, Austria). A 2-tailed P < .05 was considered to be statistically significant.
Results
Baseline Characteristics
A total of 1345 participants (579 men and 766 women) were analyzed with a median age of 60 (56-63) years. The median BMI was 23.9 (22.0-25.9) kg/m2. The median fat% and VFA values were 27.5 (20.9-33.8)% and 86.1 (60.1-115) cm2. Participants were divided into 3 groups according to sex-specific tertiles of baseline serum A-FABP levels. The baseline characteristics are presented in Table 1. As baseline serum A-FABP levels increased, the baseline age, BMI, waist circumference, fat%, VFA, blood pressure, 2-hour plasma glucose, glycated hemoglobin A1c, fasting insulin, HOMA-IR, triglyceride, low-density lipoprotein cholesterol, and C-reactive protein levels increased linearly (P for trend < .05), while the level of high-density lipoprotein cholesterol decreased linearly (P for trend < .001). Participants with higher A-FABP levels were more likely to have a higher proportion of hypertension and dyslipidemia. However, there were no differences in fasting plasma glucose, total cholesterol levels, smoking, alcohol use, family history of CVD, physical activity, fruit and vegetable intake, red meat intake, and diabetes across tertiles of A-FABP (all P for trend > .05).
Baseline characteristics according to sex-specific tertiles of serum A-FABP levels
| Variables | Tertiles of serum A-FABP levels | P for trend | ||
|---|---|---|---|---|
| 1 | 2 | 3 | ||
| Demographics | ||||
| Men/Women, n | 192/255 | 196/253 | 191/258 | |
| Age, years | 58 (55, 62) | 60 (56, 64) | 61 (56, 64) | <.001 |
| Social history | ||||
| Current smoker, n (%) | 106 (23.7) | 98 (21.8) | 87 (19.4) | .287 |
| Alcohol use, n (%) | 56 (12.5) | 55 (12.2) | 46 (10.2) | .509 |
| Family history of CVD, n (%) | 157 (35.1) | 160 (35.6) | 143 (31.8) | .431 |
| Physical activity, n (%) | .080 | |||
| Light | 82 (18.3) | 84 (18.7) | 90 (20.0) | |
| Moderate | 186 (41.6) | 216 (48.1) | 217 (48.3) | |
| High | 179 (40.0) | 149 (33.2) | 142 (31.6) | |
| Fruit and vegetable intake, cups/day | 2 (2, 3) | 2 (2, 3) | 2 (2,3) | .555 |
| Red meat intake, g/day | 42.9 (21.4, 100) | 42.9 (21.4. 71.4) | 42.9 (28.6, 71.4) | .636 |
| Comorbidities | ||||
| Diabetes, n (%) | 88 (19.7) | 83 (18.5) | 110 (24.5) | .064 |
| Hypertension, n (%) | 191 (42.7) | 233 (51.9) | 253 (56.3) | <.001 |
| Dyslipidemia, n (%) | 285 (63.8) | 320 (71.3%) | 344 (76.6%) | <.001 |
| Metabolic profile | ||||
| BMI, kg/m2 | 22.6 (20.7, 24.4) | 24.0 (22.2, 25.8) | 25.2 (23.5, 27.3) | <.001 |
| WC, cm | 81.0 (75.0, 87.0) | 84.5 (78.0, 90.5) | 88.0 (82.0, 94.0) | <.001 |
| Fat%, % | 24.7 (18.7, 31.0) | 27.6 (21.0, 33.9) | 29.9 (22.9, 35.7) | <.001 |
| VFA, cm2 | 68.9 (46.5, 99.4) | 87.2 (62.2, 116) | 95.8 (77.7, 127) | <.001 |
| SBP, mmHg | 129 (119, 141) | 133 (121, 145) | 134 (121, 149) | <.001 |
| DBP, mmHg | 79 (72, 85) | 80 (73, 87) | 80 (74, 87) | .015 |
| FPG, mmol/L | 5.23 (4.89, 5.73) | 5.28 (4.92, 5.81) | 5.32 (4.93, 5.80) | .400 |
| 2hPG, mmol/L | 7.10 (5.76, 9.57) | 7.17 (5.90, 9.38) | 7.92 (6.23, 10.1) | <.001 |
| HbA1c, % | 5.60 (5.40, 5.90) | 5.70 (5.40, 6.00) | 5.80 (5.50, 6.10) | <.001 |
| FINS, mU/L | 6.93 (4.78, 10.0) | 8.00 (5.83, 10.9) | 9.63 (6.90, 13.8) | <.001 |
| HOMA-IR | 1.64 (1.10, 2.46) | 1.96 (1.36, 2.81) | 2.31 (1.60, 3.46) | <.001 |
| TC, mmol/L | 5.02 (4.46, 5.75) | 5.09 (4.57, 5.67) | 5.24 (4.55, 5.77) | .105 |
| TG, mmol/L | 1.20 (0.86, 1.71) | 1.33 (0.93, 1.87) | 1.60 (1.13, 2.15) | <.001 |
| HDL-C, mmol/L | 1.37 (1.15, 1.65) | 1.28 (1.10, 1.58) | 1.24 (1.04, 1.48) | <.001 |
| LDL-C, mmol/L | 2.98 (2.52, 3.58) | 3.14 (2.67, 3.63) | 3.28 (2.69, 3.73) | <.001 |
| CRP, mg/L | 0.67 (0.36, 1.39) | 0.81 (0.45, 1.64) | 1.09 (0.54, 2.19) | <.001 |
| A-FABP, ng/mL | ||||
| Men | 2.92 (2.10, 3.55) | 5.87 (5.01, 6.48) | 10.7 (8.87, 13.5) | <.001 |
| Women | 5.53 (4.26, 6.93) | 10.5 (9.00, 12.1) | 18.2 (15.5, 23.4) | <.001 |
Abbreviations: 2hPG, 2-hour plasma glucose; A-FABP, adipocyte fatty acid binding protein; BMI, body mass index; CRP, C-reactive protein; CVD, cardiovascular disease; DBP, diastolic blood pressure; fat%, fat percentage; FINS, fasting insulin; FPG, fasting plasma glucose; HbA1c, glycated hemoglobin A1c; LDL-C, low-density lipoprotein cholesterol; SBP, systolic blood pressure; HDL-C, high-density lipoprotein cholesterol; HOMA-IR, homeostatic model assessment of insulin resistance; TC, total cholesterol; TG, triglyceride; VFA, visceral fat area; WC, waist circumference.
Association Between Serum A-FABP Levels and Cardiovascular Events
During a mean follow-up of 7.6 years, 136 cases of cardiovascular events (13.9 per 1000 person-years) occurred, with 54 cases of ischemic heart disease (5.51 per 1000 person-years) and 82 cases of cerebrovascular events (8.36 per 1000 person-years). The cumulative incidence of cardiovascular events increased across tertiles of baseline A-FABP levels (P for trend < .001).
As shown in Table 2, adjusting for age, sex, smoking, alcohol use, family history of CVD, physical activity, fruit and vegetable intake, red meat intake, diabetes, hypertension, dyslipidemia, C-reactive protein, HOMA-IR, fat%, and VFA, every 1-unit increase in loge-transformed A-FABP levels was associated with an increased risk of cardiovascular events (hazard ratio [HR] 1.87, 95% confidence interval [CI] 1.33-2.63). HRs of cardiovascular events across tertiles of A-FABP levels at baseline were 1.00, 1.72 (95% CI 1.04-2.85), and 2.25 (95% CI 1.37-3.70).
Hazard ratios for cardiovascular events associated with serum adipocyte fatty acid binding protein (A-FABP) levels among the total population, men, and women
| Per 1-unit increasea | Tertiles of serum A-FABP levels | |||
|---|---|---|---|---|
| 1 | 2 | 3 | ||
| Total | ||||
| Person-years | 9809 | 3354 | 3280 | 3175 |
| Cases, n | 136 | 25 | 46 | 65 |
| Per 1000 person-years | 13.9 | 7.45 | 14.0 | 20.5 |
| Hazard ratio | 1.87 (1.33, 2.63) | Reference | 1.72 (1.04, 2.85) | 2.25 (1.37, 3.70) |
| Men | ||||
| Person-years | 4152 | 1422 | 1401 | 1329 |
| Cases, n | 74 | 15 | 25 | 34 |
| Per 1000 person-years | 17.8 | 10.5 | 17.8 | 25.6 |
| Hazard ratio | 2.10 (1.29, 3.40) | Reference | 1.59 (0.82, 3.05) | 1.98 (1.01, 3.86) |
| Women | ||||
| Person-years | 5657 | 1932 | 1879 | 1846 |
| Cases, n | 62 | 10 | 20 | 32 |
| Per 1000 person-years | 11.0 | 5.18 | 10.6 | 17.3 |
| Hazard ratio | 1.74 (1.04, 2.92) | Reference | 1.78 (0.80, 3.93) | 2.69 (1.26, 5.75) |
Models were adjusted for age, sex, smoking, alcohol use, physical activity, fruit and vegetable intake, red meat intake, family history of cardiovascular disease, diabetes, hypertension, dyslipidemia, C-reactive protein, homeostatic model assessment of insulin resistance, fat percentage, and visceral fat area.
Serum A-FABP levels were loge transformed.
When stratified by sex, 74 men (17.8 per 1000 person-years) and 62 women (11.0 per 1000 person-years) developed cardiovascular events. The incidence of cardiovascular events was higher in men than in women (P = .006). Compared with those with the lowest tertile, men with the highest tertile of A-FABP levels had a HR of 1.98 (95% CI 1.01-3.86); women with the highest tertile of A-FABP levels had a HR of 2.69 (95% CI 1.26-5.75). There was no significant interaction between A-FABP levels and sex (P interaction = .905).
To further verify the association between serum A-FABP levels and cardiovascular events, we excluded participants who were followed up for less than 1 year, or those with extreme serum A-FABP levels, or aged ≥ 75 years. After these exclusions, the association between serum A-FABP levels and cardiovascular events remained robust (all P < .05, Table 3).
Sensitivity analyses of serum A-FABP levels for cardiovascular events
| Exclusions | Events/participants, n | HR (95% CI)a | P for trend | ||
|---|---|---|---|---|---|
| Tertile 1 | Tertile 2 | Tertile 3 | |||
| First year of follow-up | 124/1333 | Reference | 1.76 (1.03, 3.01) | 2.29 (1.36, 3.88) | .002 |
| Extreme A-FABP concentrationsb | 132/1318 | Reference | 1.66 (1.00, 2.76) | 2.16 (1.31, 3.56) | .002 |
| Participants aged ≥ 75 years | 135/1342 | Reference | 1.71 (1.03, 2.84) | 2.28 (1.39, 3.75) | .001 |
Models were adjusted for age, sex, smoking, alcohol use, physical activity, fruit and vegetable intake, red meat intake, family history of cardiovascular disease, diabetes, hypertension, dyslipidemia, C-reactive protein, homeostatic model assessment of insulin resistance, fat percentage, and visceral fat area.
Abbreviations: A-FABP, adipocyte fatty acid binding protein.
Serum A-FABP levels were loge transformed.
Defined as values below the 1st percentile (men: 1.10 ng/mL; women: 1.69 ng/mL) and above the 99th percentile (men: 23.32 ng/mL; women: 31.70 ng/mL) of A-FABP level in men and women, respectively.
Association of Fat% and VFA Levels With Cardiovascular Events
As shown in Table 4, every 10% increase in fat% was associated with an 84% increased risk of cardiovascular events (HR 1.84, 95% CI 1.34-2.54). Compared with those with the lowest tertile of fat%, participants with the highest tertile of fat% had an elevated risk of cardiovascular events (HR 2.38, 95% CI 1.49-3.81). Similarly, increasing VFA levels were positively associated with the risk of cardiovascular events (HR 1.04, 95% CI 1.00-1.09). And the highest tertile of VFA was related to a 1.79-fold (95% CI 1.09-2.93) risk of cardiovascular events compared with the lowest tertile of VFA.
Association of fat% and visceral fat area (VFA) levels with the risk of cardiovascular events
| Variables | Per 10-unit increase | Tertiles of body fat | ||
|---|---|---|---|---|
| 1 | 2 | 3 | ||
| Fat%, % | ||||
| Person-years | 9809 | 3271 | 3282 | 3256 |
| Cases, n | 136 | 25 | 41 | 70 |
| Per 1000 person-years | 13.9 | 7.64 | 12.5 | 21.5 |
| Hazard ratio | 1.84 (1.34, 2.54) | Reference | 1.40 (0.84, 2.34) | 2.38 (1.49, 3.81) |
| VFA, cm2 | ||||
| Person-years | 9,809 | 3,310 | 3,281 | 3,218 |
| Cases, n | 136 | 26 | 45 | 65 |
| Per 1000 person-years | 13.9 | 7.85 | 13.7 | 20.2 |
| Hazard ratio | 1.04 (1.00, 1.09) | Reference | 1.40 (0.85, 2.30) | 1.79 (1.09, 2.93) |
Models were adjusted for age, sex, smoking, alcohol use, physical activity, fruit and vegetable intake, red meat intake, family history of cardiovascular disease, diabetes, hypertension, dyslipidemia, C-reactive protein, and homeostatic model assessment of insulin resistance.
Hazard Ratios of Cardiovascular Events Associated With Serum A-FABP Levels According to Obesity Phenotype
Considering that the highest tertiles of fat% and VFA could significantly increase the risk of cardiovascular events, the highest tertiles of fat% and VFA were used as cut-off values for high and low levels, respectively. As shown in Fig. 1, the association between A-FABP levels and cardiovascular events was positive in participants with low fat% regardless of VFA levels, and HRs were 2.67 (95% CI 1.52-4.70) in the low fat%–low VFA group and 4.39 (95% CI 1.23-15.7) in the low fat%–high VFA group. However, such associations did not reach statistical significance in those with high fat%, regardless of VFA levels (both P > .05).
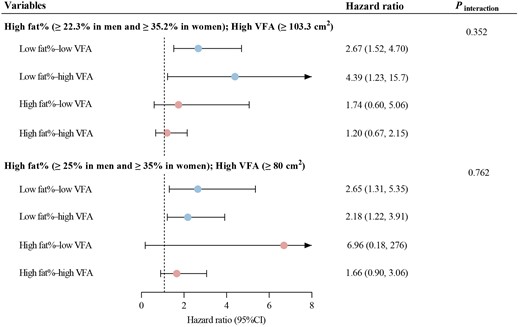
Associations between serum A-FABP levels and cardiovascular events stratified by obesity phenotype. Hazard ratios (95% confidence intervals) were estimated per 1-unit increase of loge-transformed A-FABP levels. The model was adjusted for age, sex, smoking, alcohol use, family history of cardiovascular diseases, physical activity, fruit and vegetable intake, red meat intake, diabetes, hypertension, dyslipidemia, C-reactive protein, and homeostatic model assessment of insulin resistance.
When using the WHO and Chinese criteria to define high fat% and high VFA, the association patterns were consistent. The association between A-FABP levels and cardiovascular events was consistent in the low fat%–low VFA (HR 2.65, 95% CI 1.31-5.35) and the low fat%–high VFA groups (HR 2.18, 95% CI 1.22-3.91), but disappeared in those with high fat% (both P > .05).
Joint Effect of A-FABP Tertiles and Obesity on Cardiovascular Events
When using the highest tertiles of fat% and VFA to define high fat% and high VFA, elevated A-FABP levels and elevated fat% were synergistically associated with a 2.52- to 4.86-fold risk of cardiovascular events compared with participants with the lowest tertile of A-FABP levels and low fat% (Fig. 2A). The highest tertile of A-FABP was associated with HRs of 3.57 (95% CI 1.79-7.11) among those with low fat%, and 4.86 (95% CI 2.41-9.82) among those with high fat%. As shown in Fig. 2B, compared with participants with the lowest tertile of A-FABP and low VFA, those with the middle or highest tertile of A-FABP had higher risks of cardiovascular events, irrespective of VFA levels (all P < .05).
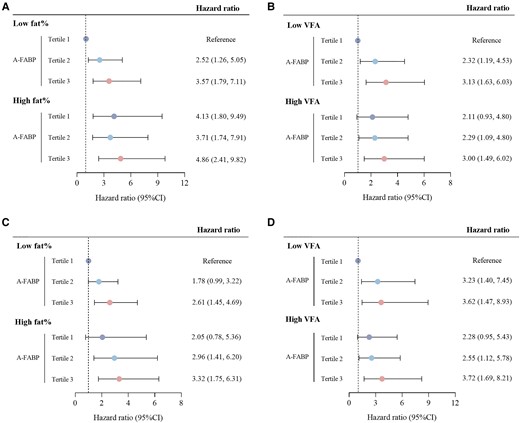
The joint effect of A-FABP tertiles and obesity on cardiovascular events. (A) Hazard ratio of cardiovascular events according to A-FABP tertiles and fat percentage. The highest tertile of fat% was defined as high fat%. (B) Hazard ratio of cardiovascular events according to A-FABP tertiles and visceral fat area. The highest tertile of VFA was classified as high VFA. (C) Hazard ratio of cardiovascular events according to A-FABP tertiles and fat percentage. High fat% was defined according to the WHO criteria. (D) Hazard ratio of cardiovascular events according to A-FABP tertiles and visceral fat area. High VFA was defined according to the Chinese criteria. Models were adjusted for age, sex, smoking status, alcohol use, physical activity, fruit and vegetable intake, red meat intake, family history of cardiovascular disease, diabetes, hypertension, dyslipidemia, C-reactive protein, homeostatic model assessment of insulin resistance. Fat percentage and visceral fat area were mutually adjusted for each other.
When using the WHO and Chinese criteria to define high fat% and high VFA, the results were similar (Fig. 2C-2D). The highest tertile of A-FABP and high fat% resulted in the highest risk of cardiovascular events compared with the lowest tertile of A-FABP and low fat% (HR 3.32, 95% CI 1.75-6.31). Also, the highest tertile of A-FABP and high VFA resulted in the highest risk of cardiovascular events, compared with the lowest tertile of A-FABP and low VFA (HR 3.72, 95% CI 1.69-8.21).
Additional Value of A-FABP in Predicting Cardiovascular Events
We evaluated a traditional risk model (including age, sex, systolic blood pressure, antihypertensive drug, smoking, total cholesterol, and high-density lipoprotein cholesterol) with and without fat% and VFA (Table 5). The receiver operating characteristic curves showed that the prediction of cardiovascular events was slightly improved (C-statistic, 95% CI: 0.682, 0.639-0.725 vs 0.693, 0.650-0.736, P = .012). The estimated NRI and IDI were 0.145 and 0.010, respectively.
Additional predictive value of A-FABP
| C statistic | NRI | IDI | ||||
|---|---|---|---|---|---|---|
| Estimate | P value | Estimate | P value | Estimate | P value | |
| Traditional risk factors | 0.682 | Reference | Reference | .046 | Reference | .040 |
| + fat% and VFA | 0.693 | .012 | 0.145 | 0.010 | ||
| Traditional risk factors + fat% and VFA | 0.693 | Reference | Reference | .042 | Reference | .016 |
| +A-FABP | 0.706 | .007 | 0.283 | 0.014 | ||
Traditional risk factors included age, sex, systolic blood pressure, antihypertensive drug, smoking, total cholesterol, and high-density lipoprotein cholesterol.
Abbreviations: A-FABP, adipocyte fatty acid-binding protein; Fat%, fat percentage; IDI, integrated discriminant index; NRI, continuous net classification improvement; VFA, visceral fat area.
Moreover, when the full model, additionally including fat% and VFA, was used as the reference, A-FABP improved the discriminative performance to moderate (C-statistic 0.706, 95% CI 0.665-0.747, P = .007) and exerted excess improvement in the estimated NRI (0.283, P = .042) and IDI (0.014, P = .016) as well.
Discussion
This study demonstrated that participants with higher levels of A-FABP, fat%, and VFA had higher risks of cardiovascular events. The association between A-FABP levels and cardiovascular events risk was more pronounced among participants with low fat%, regardless of VFA levels. The joint effect of increased A-FABP levels and obesity resulted in increased risks of cardiovascular events. Taken together, our data provide novel and further insights into the effect of serum A-FABP levels on incident cardiovascular events.
Adipokines are biological molecules released by adipose tissues, which may act at the interface of inflammatory and metabolic pathways, thus exerting impacts on cardiovascular events (23). As one of the most abundant cytoplasmatic proteins expressed in mature adiposity, serum A-FABP levels were suggested to be closely associated with metabolic disorders (9, 24), and reported to be a significant predictor of cardiovascular events, in both basic and clinical studies. Data from a study conducted among 61 patients with end-stage renal disease demonstrated that per 1-unit increase in loge-transformed A-FABP levels conferred a 6.75-fold increased risk of cardiovascular events during 7 years of follow-up (11). In a 10.7-year prospective study among a population of 4179 Americans with a mean age of 75 years, circulating A-FABP was significantly associated with the risk of heart failure (25). Such an association was quite consistent among patients with type 2 diabetes (12) and with stable angina undergoing percutaneous coronary intervention (26). However, there are limited studies conducted in communities. Herein, we conducted our study in a community-based cohort. Similar to previous studies, it is noteworthy that A-FABP seems to be a valid prognostic biomarker for CVD outcomes during 7.6 years of follow-up.
It is now generally accepted that obesity is accompanied by high levels of A-FABP. Our previous finding in 2108 women demonstrated that serum A-FABP levels were independently associated with VFA and fat mass (13). Haider et al examined 33 morbidly obese patients and found that A-FABP levels changed dynamically with BMI before and 6 months after surgery (27). Given the close association between serum A-FABP levels and obesity, it is of great interest to explore the interaction of serum A-FABP levels and obesity on cardiovascular events. However, when the association between serum A-FABP levels and cardiovascular events was evaluated, most of the previous studies were performed using parameters of obesity as the covariates. Only 1 study of 2194 people in Germany aged 35-65 years analyzed the relationship stratified by BMI and waist circumference categories. They observed a stronger association between serum A-FABP levels and stroke risks among men with BMI <25 kg/m2 or waist circumference <94 cm (28). Nevertheless, BMI cannot distinguish between fat mass and fat-free mass, and waist circumference does not reflect fat distribution around the abdomen. In the current analysis, fat% and VFA were measured by BIA and magnetic resonance imaging, respectively. In line with the German study, our data revealed a more predominant association between serum A-FABP levels and cardiovascular events among participants with low fat%. Considering that fat distribution is different from person to person, the inability of fat% to discriminate the fat distribution may partly explain why, in our cohort, serum A-FABP levels were not significantly associated with cardiovascular events in the high fat% population.
However, our findings still have some important implications for CVD prevention and control in China and other East Asian countries. First, our finding observed a stronger association between serum A-FABP levels and cardiovascular events in lean individuals, though the interaction between serum A-FABP levels and obesity was not found. These results may suggest direct effects of A-FABP on CVD, independent of adiposity as the basic study postulated (29). Second, although individuals from East Asia have a lower BMI than individuals of European ancestry, they are genetically predisposed to accumulate visceral adipose tissue for the same BMI (30). Based on the Chinese criteria, the prevalence of abdominal obesity increased rapidly, with 1 out of every 3 people having abdominal obesity (31). Those with normal BMI but abdominal obesity deserve particular attention in China. Data from the China Cardiovascular Health and Disease Report 2021 showed that the prevalence of normal-weight abdominal obesity increased from 6.65% in 1993 to 13.24% in 2011 (32). Individuals with this subtype of obesity are still at a higher risk of cardiovascular events (33, 34). In this study, the predictive effect of A-FABP on cardiovascular events was observed in a population with low fat% and high VFA, which also supports the clinical potential of A-FABP in Chinese population. Finally, adding A-FABP to the model including fat% and VFA improved the predictive ability of cardiovascular events, which further implies the clinical application of A-FABP as a potential biomarker in the future.
The underlying mechanisms linking A-FABP to cardiovascular events are not clearly understood. However, some mechanisms may explain this phenomenon. Liao et al found that A-FABP promoted the activation of MMP-9 by potentiating JNK/c-Jun signaling, resulting in blood–brain barrier disruption and cerebral ischemia injury (29). Furthermore, A-FABP was regarded as a stress-induced protein. In ischemia/reperfusion–induced hepatic injury, A-FABP was elevated by hypoxia inducible factor 1α. Overexpression of A-FABP sensitized mice to hepatic ischemia/reperfusion injury (35), while A-FABP deficiency protected them against cardiac ischemia/reperfusion injury (10). Further mechanism studies are still warranted to clarify the role of A-FABP in cardiovascular or other metabolic diseases.
The strengths of our study include the long duration of follow-up, the prospective study design, and the robust analysis by stratifications, allowing us to account for potential confounding factors and reverse causality. However, there are still some limitations. First, we only included populations from Shanghai, and the generalizability may be limited to populations with similar characteristics. Second, some socioeconomic variables were missing in the dataset such as occupation, marital status, family income, etc. Third, fat% was measured by BIA. Although dual-energy X-ray absorptiometry was not applied, validation studies have revealed that BIA and dual-energy X-ray absorptiometry have high correlations (intraclass correlation coefficient > 0.8) (36). Moreover, BIA is supported by the Asian Working Group of Sarcopenia in community-dwelling settings (37).
Conclusions
In summary, this community-based prospective study showed that serum A-FABP, fat%, and VFA levels were significantly associated with the risk of future cardiovascular events. The association between A-FABP and cardiovascular events risk was more prominent among the low fat% population, which was independent of VFA levels. The findings from this study provide novel and comprehensive insights into prevention and control of CVD in China, especially for the lean population.
Acknowledgments
The study team would like to acknowledge the contributions of our collaborators from the communities.
Funding
This work was partly funded by the Shanghai Municipal Science and Technology Commission Medical Guide Project (19411964300), Shanghai Pujiang Program (21PJ1411800), and Shanghai Research Center for Endocrine and Metabolic Diseases (2022ZZ01002). The funders of the study had no role in study design, data collection, data analysis, data interpretation, or writing of the manuscript.
Author Contributions
M.X.J and B.Y.Q conceived the study. H.T.T. and S.Y. analyzed the data and wrote the manuscript. C.W.J., X.Y.T., and W.Y.F. collected the data. S.Y and B.Y.Q. obtained fundings. All authors contributed to the conception and design of the work, interpretation of the data, reviewed and provided edits and comments on manuscript, approved the final version of the manuscript, and agree to be accountable for all aspects of the work. B.Y.Q. and M.X.J. are the guarantors of this work and, as such, have full access to all the data in the study.
Disclosures
The authors declare that they have no competing interests in this section.
Availability of Data and Materials
The dataset analyzed during the current study is available from the corresponding author upon reasonable request.
Ethics Approval and Consent to Participate
The current study was carried out in accordance with the principles of the Declaration of Helsinki and approved by the institutional review board at the Ethics Committee of Shanghai Sixth People's Hospital Affiliated to Shanghai Jiao Tong University School of Medicine, approved number 2019-067. All participants provided written informed consent.
Reference
Abbreviations
- A-FABP
adipocyte fatty acid binding protein
- BIA
bioelectrical impedance analyzer
- BMI
body mass index
- CI
confidence interval
- CVD
cardiovascular disease
- HOMA-IR
homeostatic model assessment of insulin resistance
- HR
hazard ratio
- IDI
integrated discrimination improvement
- NRI
net reclassification improvement
- VFA
visceral fat area
- WHO
World Health Organization
Author notes
Tingting Hu and Yun Shen contributed equally to this work.
