


Abstract
Severe insulin resistance (IR) in the presence of insulin receptor autoantibodies (InsR-aAb) is known as type B insulin resistance (TBIR). Considerable progress in therapy has been achieved, but diagnosis and monitoring of InsR-aAb remains a challenge.
This work aimed to establish a robust in vitro method for InsR-Ab quantification.
Longitudinal serum samples from patients with TBIR at the National Institutes of Health were collected. A bridge-assay for InsR-aAb detection was established using recombinant human insulin receptor as bait and detector. Monoclonal antibodies served as positive controls for validation.
The novel assay proved sensitive, robust, and passed quality control. The measured InsR-aAb from TBIR patients was associated with disease severity, decreased on treatment, and inhibited insulin signaling in vitro. Titers of InsR-aAb correlated positively to fasting insulin in patients.
Quantification of InsR-aAb from serum samples via the novel in vitro assay enables identification of TBIR and monitoring of successful therapy.
Type B insulin resistance (TBIR) is a rare acquired autoimmune disorder, in which altered insulin signaling is elicited by autoantibodies (aAbs) to the insulin receptor (InsR-aAb) (1, 2). The prevalence is unknown, with only a few severe cases diagnosed and reported (3). Based on referrals to a specialty center, the likely incidence in the United States is between 15 and 1500 patients per 300 million population per year. The clinical features of TBIR can vary from severe IR with uncontrolled diabetes and ovarian hyperandrogenism, to spontaneous hypoglycemia (4, 5). TBIR belongs to the growing family of autoimmune diseases amenable to immunosuppressive treatment (6, 7). As the correct diagnosis of TBIR and monitoring of treatment pose considerable problems in daily practice, we decided to develop a novel sensitive in vitro assay for InsR-aAb quantification.
Materials and Methods
Study Population
Participants provided written, informed consent for a natural history study of IR (NCT00001987) approved by the institutional review board of the National Institutes of Health (NIH). Patients with TBIR were studied before, during, and after immunosuppression as reported previously (8). For this preliminary study, a subset of patient samples were chosen to allow quantification of InsR-aAb across a range of disease presentations and stages. A total of 28 samples from 9 patients with TBIR were included from among 22 patients with TBIR studied at the NIH between 2007 and 2020. At each visit, patient disease status was categorized as active-severe (usually the initial presentation of TBIR; fasting insulin > 100 μU/mL; insulin total daily dose ≥ 100 units in patients on insulin; uncontrolled diabetes), active-mild (either on immunosuppression with improving IR [fasting insulin < 100 μU/mL] or early presentation of recurrence without uncontrolled diabetes, and insulin total daily dose < 100 units in patients on insulin), hypoglycemia (without insulin or secretagogues), or remission (completed initial immunosuppression and off insulin). Subjects with IR from causes other than TBIR served as controls, including 1 with type 1 diabetes and high insulin requirement (> 3 units/kg/d), 4 with type 2 diabetes, 2 with congenital generalized lipodystrophy, and 1 with type A IR. Blood was obtained after an 8- to 12-hour fast. Insulin, C-peptide, and glycated hemoglobin A1c (HbA1c) were measured using standard techniques at the NIH. HbA1c data in one individual with hemolytic anemia were excluded from analyses as increased red blood cell turnover lowers HbA1c. Serum samples for measurement of InsR-aAb were stored at −80 °C until analyzed. Scientists analyzing these samples (WBM, CS, TW, and PS) were blinded to the clinical information.
Assessment of Insulin Receptor Autoantibodies
A novel assay for InsR-aAb was established based on a bridge assay detection format (9), and developed to a standardized product (IRaBtest, catalog No. IRT, selenOmed GmbH). To this end, the coding sequence of human InsR was fused to luciferase, yielding InsR-Luc, which was expressed in HEK293 cells as described previously (10, 11). An InsR containing a C-terminal peptide tag for immobilization (InsR-tag) was recombinantly expressed and used as bait. Two commercial monoclonal antibodies (mAbs) to human InsR (Millipore catalog No. MAB1137Z, RRID:AB_2127121, and selenOmed catalog No. SM-MAB-5325, RRID:AB_2928140) were purchased. An unrelated mAb to selenium-binding protein 1 (SELENBP1-mAb1) (12) served as negative control. Human serum samples were assessed for InsR-aAb using the novel bridge assay. Briefly, serum samples were diluted and incubated in 96-well plates precoated with a tag-specific mAb and the InsR-tag overnight at 4 °C. After intensive washings, the detector fusion protein InsR-Luc was added, incubated at 4 °C overnight, washed intensively, and Luc activity was determined in a luminometer (Mitras, Berthold Technologies GmbH). Results were recorded as relative light units (RLU), and binding indices (BI) were calculated relative to control sera.
Activity Test of Insulin Receptor Autoantibodies
Immunoglobulins (Igs) from positive and negative serum were isolated via protein G–mediated immunoadsorption as described previously (11). Isolated Igs were concentrated (Centricon Plus-70, Sigma-Aldrich), the buffer was exchanged to Dulbecco’s modified Eagle’s medium/F12 medium, and protein concentration was adjusted to approximately 2 mg/mL. Hepatic (HepG2) cells were exposed to the isolated Ig in the presence or absence of 1 ng/mL insulin (Sigma-Aldrich) for 30 minutes and subjected to Western blot analysis. Activated InsR was detected using a phosphorylation-specific antibody (rabbit anti-phospho-IR pTyr1361, Novus Biologicals). Signals were recorded by x-ray film (Kodak) and quantified by ImageJ software (NIH).
Statistical Analysis
Data are reported as mean ± SD or median (25th-75th percentile) based on data distribution. Nonnormal data were log transformed. Correlation between InsR-aAb and insulin was analyzed by Spearman correlation. For categorical outcomes, comparisons among controls and TBIR in different disease states were analyzed using mixed models with subject as repeated measure, including only the first time point for a participant in each state of TBIR. Post hoc comparisons of each phase of TBIR were Bonferroni corrected, 2-sided. Categorical outcomes were analyzed by chi-square tests. P less than .05 defined statistical significance. Analyses were conducted using SAS Enterprise Guide version 4.3 and GraphPad Prism version 9.1.0 (GraphPad Software, www.graphpad.com).
Results
Assay Design and Detection of Antibodies to the Insulin Receptor
The analytical assay consists of an immobilized recombinant InsR at the plastic surface and an InsR-Luc fusion protein for the detection of InsR-aAb (Fig. 1A). Signals showed dose-dependent increase in intensity over at least 2 orders of magnitude with InsR-specific commercial mAb, but not with a control mAb (Fig. 1B). In the concentration range tested, MAB1137Z showed the typical sigmoid curve, whereas mAb SM-MAB-5325 showed a linear increase in signal intensity under the test conditions. The observed difference in binding characteristics may be due to steric hindrances of the autoantigen, as it is present in the assay as a transmembrane protein with attached lipids. The unrelated mAb (SELENBP1-mAb1) showed background signals only.
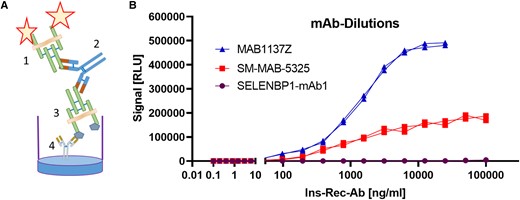
Establishment of a novel assay for the quantification of antibodies to the insulin receptor. A, Detection principle by a bridge format; the fusion protein of insulin receptor with luciferase (1) is used as detector, the antibodies (Abs) serve as a bridge (2) between detector and the catcher antigen (3) that is a tagged insulin receptor immobilized to the support via a precoated tag-specific monoclonal Ab (mAb) (4). B, Dose-response curve of luciferase signals (RLU; relative light units) in response to increasing concentrations of Abs (unrelated SELENBP1-mAb1 as negative control, vs 2 InsR-specific mAb as positive controls) under the standardized test conditions for InsR-aAb.
Analysis of Autoantibodies to the Insulin Receptor in Type B Insulin Resistance
Clinical data on patients with TBIR and controls with other forms of IR are provided in Table 1. InsR-aAb titers changed in parallel to changes in disease state and severity (Fig. 2A), being highest in active and severe TBIR, and moderate in hypoglycemic and remission states. All TBIR patient samples showed clearly elevated signal intensities vs controls (Fig. 2B). During treatment, InsR-aAb declined with amelioration of disease symptoms (Fig. 2C). Fasting insulin was strongly correlated with InsR-aAb titers (Fig. 2D).
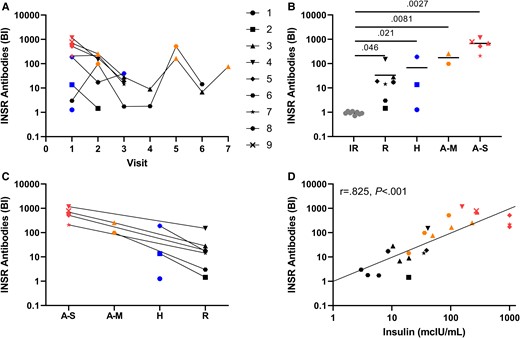
Analysis of autoantibodies to the insulin receptor in patients with insulin resistance (IR). A, InsR-aAb concentrations of type B insulin resistance (TBIR) patients at serial visits mirror disease state (color coded: red; active/severe, orange; active/mild, blue; hypoglycemic, black; in remission). B, Patients with IR unrelated to TBIR (gray symbols) showed no InsR-aAb (binding index of 1.0 equals the average noise from negative controls), whereas the titers of InsR-aAb in patients with TBIR are elevated vs controls in all disease states. C, Within-patient comparison of InsR-aAb at different visits indicates declining titers with amelioration of symptoms. D, Concentration of InsR-aAb correlates positively with fasting insulin (Spearman correlation coefficient r = 0.825 and P < .001; antibody titers during visits in the hypoglycemic state were not included in this analysis). For Figs. B and C, antibody titer at only the first visit in any disease state is used for each individual.
Clinical data in patients with Type B insulin resistance (TBIR) and controls with other forms of insulin resistance (IR).
| Controls | TBIR | |||||
|---|---|---|---|---|---|---|
| IR controls (N = 8) | Remission (N = 11) | Hypoglycemia (N = 4) | Active mild (N = 6) | Active severe (N = 7) | P for TBIR | |
| Fasting insulina, mcU/mL | 54.5 (11.4-120.1) | 13.6 (6.0-34.9) | 6.4 (3.1-103.4) | 71.1 (31.7-230.4) | 1000 (273.0-1000) | .0014b,c,d |
| Fasting plasma glucose, mg/dL | 122 ± 40 | 74 ± 9 | 65 ± 10 | 98 ± 68 | 136 ± 39 | .070 |
| Fasting C-peptide, ng/mL | 3.2 ± 2.7 | 1.6 ± 0.7 | 1.8 ± 1.9 | 1.6 ± 0.9 | 3.1 ± 1.9 | .24 |
| HbA1ce, % | 9.1 ± 3.8 | 5.8 ± 1.2 | 6.0 ± 0.7 | 7.0 ± 0.2 | 10.9 ± 1.8 | .021c |
| Patients using insulin, % | 38 | 0 | 0 | 17 | 86 | .0003 |
| Insulin dose, units/d | 0 (0288) | 0 (0-0) | 0 (0-0) | 0 (0-0) | 750 (100-3050) | .042 |
P values for continuous outcomes are for mixed models comparing each group of TBIR (remission, hypoglycemia, active-mild, active-severe) with individual as repeated measure, including all data. Post hoc comparison of each disease group to each other disease group was made with Bonferroni correction for multiplicity. Categorical outcomes were analyzed by chi-square test.
Abbreviations: HbA1c, glycated hemoglobin A1c; IR, insulin-resistant; TBIR, type B insulin resistance.
Log-transformed before analyses.
Bonferroni-adjusted P less than .05 for remission vs active mild.
Bonferroni-adjusted P less than .05 for remission vs active severe.
Bonferroni-adjusted P less than .05 for hypoglycemia vs active severe.
Excludes one individual with hemolytic anemia.
Biological Activity of Autoantibodies to the Insulin Receptor in Cell Culture
In the absence of insulin, there was no difference in InsR phosphorylation in response to Ig from patients with TBIR vs controls (Fig. 3A). In the presence of insulin, strong InsR phosphorylation was observed in cells incubated with Ig from control serum samples, but not those incubated with Ig from TBIR patient serum samples (Fig. 3B). The result suggests that the InsR-aAb directly impair insulin-induced InsR phosphorylation and signaling, and thus qualify as antagonists to insulin for InsR activation by Y1361 phosphorylation.
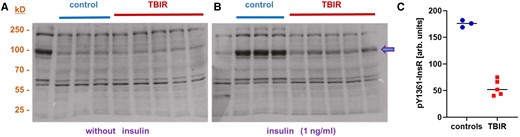
Biological activity of insulin receptor autoantibodies on insulin signaling in vitro. Human hepatic HepG2 cells were incubated with immunoglobulins (Igs) isolated from individual serum samples from InsR-aAb–negative individuals (control) or patients with type B insulin resistance (TBIR). Phosphorylation of the insulin receptor at Tyr1361 (P-Y1361-InsR) was determined by Western blot as a biomarker of insulin signaling. A, The degree of insulin receptor phosphorylation at Y1361 was not different in cells incubated with Ig from control or TBIR serum samples. B) In the presence of insulin (1 ng/mL), insulin receptor phosphorylation at Y1361 was stronger in cells incubated with Ig from control serum in comparison to cells incubated with Ig from InsR-aAb–positive serum samples from patients with TBIR. C, Quantification of the band intensities of P-Y1361-InsR (arrow) by ImageJ analysis supports this notion and highlights the extent of inhibition. The results indicate an antagonistic activity of InsR-aAb in TBIR on insulin-mediated receptor activation.
Discussion
In this manuscript, we describe an in vitro test for the detection and quantification of InsR-aAb in human samples with high accuracy over a broad concentration range. Importantly, the assay correctly identified all clinical samples from patients with TBIR vs controls with nonautoimmune forms of severe IR, and thus is an easy-to-interpret clinical tool to assist with this challenging diagnosis. InsR-aAb titers from patients with TBIR correlated with disease state, suggesting utility of this test for monitoring treatment response and disease relapse. Furthermore, InsR-aAb titers correlated with fasting insulin, supporting the direct relevance of InsR-aAb as causal for disease severity and as therapeutic targets for antibody depletion.
There are several advantages of an in vitro system for InsR-aAb detection. TBIR is difficult to diagnose as it presents with variable and dynamic phenotypes ranging from extreme IR with hyperglycemia to intractable hypoglycemia (13, 14). Observational cross-sectional studies have not yet been conducted, mainly because of a lack of reliable, scalable, and convenient test methods. The first demonstration of InsR-aAb involved quantification of 125I-insulin binding to receptors, demonstrating strongly reduced binding in the presence of TBIR patient serum (15). Alternative methods for detecting InsR-aAb included inhibition of 3H-labeled glucose transport into adipocytes (16), and immunoprecipitation of InsR by patient serum followed by semiquantitative Western blot analysis using InsR-specific antibodies (17). While the methods used before have been valuable for understanding the pathophysiology of TBIR and for patient diagnoses, their disadvantages include costly isotopes, the need for specialized equipment and trained staff for Western blots, and difficulty in standardization for widespread application.
Reliable detection of pathologic aAb in autoimmune diseases is challenging, and low signal-to-noise ratio often precludes unambiguous results. Therefore, novel aAb assays require particular care in development and need suitable controls to ensure reproducibility and transferability (18). Ideally, certified reference material or commercial sources of Abs, preferably mAbs, should be used as standards or calibrators, and patient samples with known presence or absence of the aAbs are needed for aligning assay results with the clinical phenotype (19). Both prerequisites were met in the present study, and the results appear in line with prior knowledge on TBIR. Moreover, this study used recombinant human receptor expressed in a human cell line, increasing the chance that all potential antigenic domains are present and correctly processed for recognition by the aAbs. However, the epitopes recognized by the commercial anti-INSR monoclonal antibodies and the patient serum samples, respectively, have not yet been characterized, which constitutes a limitation of our analysis.
Analysis of Ig preparations from patients vs controls in our study indicated no stimulating activity of the InsR-aAb on the unliganded receptor, but efficient inhibition of insulin-dependent receptor activation, supporting classification of InsR-aAb in TBIR as antagonists to insulin in this model. It is notable, however, that InsR-aAb have also been described to have agonist effects on insulin receptors, particularly when present at low titer and short term, thus accounting for the hypoglycemic phase of illness in TBIR (20). In preclinical experimental models, InsR-aAb elicit a biphasic response, with a rapid (2-4 hours) agonistic insulin mimetic effect causing hypoglycemia, followed by IR and hyperglycemia (21–23). This phenomenon of a rapid insulin mimetic effect followed by IR has also been demonstrated in samples from humans with TBIR ex vivo, but without clear correlation with hypoglycemic vs hyperglycemic phases of the disease (24, 25). A recent case report (26) demonstrated by a combination of different detection techniques that InsRec-aAb may also be stimulating in nature, causing episodes of severe hypoglycemia and confusion. In addition, in rodents, InsR-aAb appear to exert a partial agonist effect, with low titers eliciting agonistic effects leading to hypoglycemia, and high titers eliciting antagonist effects and hyperglycemia (21). While the present work supports a difference in antibody titer in hypoglycemic vs hyperglycemic phases of TBIR, further work is needed to clarify the molecular mechanisms by which different Ab titers lead to these opposing effects on insulin signal transduction.
In TBIR, very high insulin doses are often required to control blood glucose concentrations (8). The clinical experience is compatible with our findings on an antagonistic nature of InsR-aAb, and supports aAb-depletion strategies in TBIR. Several successful immunosuppressive approaches have been reported, including combinations of rituximab, glucocorticoids, and cyclophosphamide (6–8, 17, 27), which have greatly reduced the previously high mortality of TBIR. Collectively, these reports indicate that, once it is diagnosed, the high mortality risk of TBIR can be reduced. By easing the diagnosis and monitoring of TBIR, the newly developed analytical in vitro assay for InsR-aAb quantification presented here should enhance access to timely and effective treatment for this condition.
The major limitation of our study is the small sample size. We were able to accurately distinguish the presence of InsR-aAb in all individuals with TBIR vs absence of InsR-aAb in a small number of patients with a range of IR conditions in which InsR-aAb might be part of the differential diagnosis (28). However, larger analyses including more samples from patients with TBIR as well as other, more common forms of IR and/or diabetes are required to better understand the potential value of the novel test system. Moreover, classification of patients with TBIR as active-severe, active-mild, and remission was based on clinical judgment, rather than validated biomarkers. Despite this, InsR-aAb titer corresponded reasonably well to disease stage classification. Future work with larger sample sizes may permit better classification of the phases of TBIR and correlation with InsR-aAb titer, as well as relationships between the functional activity of InsR-aAb and the clinical manifestations of TBIR. Of note, the comparable C-peptide across all phases of TBIR despite higher insulin in the IR phases likely relates both to the use of exogenous insulin in some patients, as well as impaired receptor-mediated degradation of insulin in the presence of high-titer InsR-aAb with normal renal clearance of C-peptide, resulting in a high insulin–to–C-peptide ratio. In addition, we were not able to directly compare the performance of the present assay to previously used assays. However, all patients included in our study who had at least one IR phase of TBIR had detectable InsR-aAb using a previously published assay (immunoprecipitation with Western blot (29)) while in the IR state (6, 8). One patient who had only the hypoglycemic phase of TBIR had an unequivocally positive InsR-aAb with the present assay, whereas InsR-aAb was equivocal (within the baseline assay noise) using the immunoprecipitation assay (unpublished data). The control patients with type 1 or type 2 diabetes, lipodystrophy, and type A insulin resistance were not tested for TBIR using the previously published assay. However, all tested negative for TBIR using the present assay, lacked the typical history for TBIR (abrupt worsening of glycemia control with weight loss and severe acanthosis nigricans), and had negative antinuclear Abs and extractable nuclear antigen screening antibodies.
In conclusion, our data indicate direct and concentration-dependent relevance of InsR-aAb for disease symptoms in TBIR and support the antagonistic nature of InsR-aAb on insulin-dependent receptor activation. The diagnostic assay facilitates TBIR diagnosis and will allow systematic observational cross-sectional analyses to determine the prevalence of InsR-aAb in the general population, identify undiagnosed cases, and elucidate potential InsR-aAb relevance for less severe forms of IR.
Acknowledgments
The authors would like to thank all the patients, clinicians, and hospital staff participating in the study; the staff at the National Institute of Diabetes and Digestive and Kidney Diseases for clinical care and support; and Vartitér Seher, Gabriele Boehm, and Anja Fischbach for technical support in the laboratory analyses.
Funding
This work was supported by the German Federal Ministry of Economic Affairs and Climate Action (BMWi), project KF2257304AJ0 within the ZIM program, and by the intramural research program of the National Institute of Diabetes and Digestive and Kidney Diseases.
Disclosures
W.B.M. and L.S. are listed as inventors on a related patent application. C.S. and T.W. are employees of Bruker cooperation, Berlin, Germany. L.S. and P.S. hold shares in selenOmed GmbH, and P.S. is the chief executive officer of selenOmed GmbH, Berlin, Germany.
Data Availability
Some or all data sets generated during and/or analyzed during the present study are not publicly available but are available from the corresponding author on reasonable request.
Clinical Trial Information
Clinicaltrials.gov registration number NCT00001987 (registered January 31, 2000).
References
Abbreviations
- aAb
autoantibody
- HbA1c
glycated hemoglobin A1c
- Ig
immunoglobulin
- InsR-aAb
insulin receptor autoantibodies
- IR
insulin resistance
- mAb
monoclonal antibody
- NIH
National Institutes of Health
- TBIR
type B insulin resistance
Author notes
Rebecca J Brown and Lutz Schomburg contributed equally to this work.
