


Abstract
There are no data on mortality of acromegaly diagnosed in older individuals.
This work aimed to compare clinical characteristics, growth hormone–related comorbidities, therapeutic approaches, and mortality rate of patients diagnosed before or after 2010 and to assess overall mortality rate compared with the general Spanish population.
A retrospective evaluation was conducted among Spanish tertiary care centers of 118 patients diagnosed with acromegaly at age 65 or older. Kaplan-Meier curves were constructed to trace survival, and Cox proportional hazard models were used to assess the risk factors associated with mortality. We also compared mortality with that of the Spanish population by using age- and sex-adjusted standardized mortality ratios (SMRs).
No differences were found in first-line treatment or biochemical control, between both periods except for faster biochemical control after 2010. Twenty-nine (24.6%) patients died, without differences between groups, and had a median of follow-up 8.6 years (103, [72.3] months). Overall SMR was 1.02 (95% CI, 0.57-1.54), (0.60; 95% CI, 0.35-1.06) for men and (1.80; 95% CI, 1.07-2.94) for women. The most common cause of death was cardiovascular disease (CVD).
The mortality in patients with acromegaly diagnosed in older individuals was no different between both periods, and there was no overall SMR difference compared with the general Spanish population. However, the SMR was higher in women. As CVD is the leading cause of mortality, it seems advisable to initiate an intense CVD protective treatment as soon as acromegaly is diagnosed, particularly in women, in addition to tight acromegaly control to prevent excess mortality.
In Spain as in Europe, life expectancy is increasing and therefore the population of older people is growing (1, 2). Thus, the newly diagnosed acromegaly cases in older individuals are also increasing (3-7), representing up to 11.8% in Spain (8), and probably will continue growing in the next decade.
Uncontrolled growth hormone (GH) and insulin-like growth factor-1 (IGF-1) hypersecretion in acromegaly is associated with an increased risk of cardiovascular, respiratory, metabolic, and neoplastic complications, and higher mortality rates than in the general population (9-14). Cardiovascular disease (CVD) has been the most frequent cause of mortality (15), while cancer seems to be escalating in the latter years (16-19). Likewise, some nationwide studies have shown a significant progressive reduction in acromegaly-related mortality (15, 19, 20) attributed to more effective disease control, in part thanks to the existence of new medical options that allow less time of GH/IGF-1 overexposure (21).
Older patients diagnosed with acromegaly are a special population; some individuals may be penalized by a delayed diagnosis, while on the other hand others may have an incidental diagnosis with a potentially shorter disease evolution, and with a proportion between these 2 groups that could have changed over the last years. Diagnostic delay in acromegaly seems to range from 5 to more than 10 years (20), and the time elapsed since initiation of the disease has been directly associated with more comorbidities and increased mortality (22). In older patients, the diagnosis could be even more delayed by insidious and frequently misleading physical changes and some comorbidities such as hypertension, diabetes, and joint pain that could be wrongly but understandingly attributed to aging. In addition, easier access to the central nervous system's imaging techniques in the latter years may have contributed to an increasing percentage of incidental diagnoses in this group of patients. Furthermore, the treatment of choice in older patients could have also changed in the latest years.
Thus, the aims of this study were first to compare clinical characteristics, GH-related comorbidities, therapeutic approaches and, in particular, to assess the mortality rates of patients with a new diagnosis of acromegaly in the later years during the time period before and after 2010, when all the long-acting formulations of somatostatin receptor ligands (SRLs) were fully available in Spain, facilitating treatment compliance in the latest period; and second, to evaluate the overall standardized mortality ratios (SMRs) relative to the general Spanish population.
Materials and Methods
This was an observational retrospective, multicentric, nationwide study from 1995 to 2020 that included 118 patients newly diagnosed with acromegaly at age 65 years or older. Fifteen centers from all over Spain participated in the registry.
The inclusion and exclusion criteria and variables of clinical and biological nature describing the cohort have been previously reported in detail (8) and are summarized in Table 1. A final version of the protocol was approved as a multicenter observational study with drugs by the ethics committee of the Vall d’Hebron University Hospital (No. PR(AG)318/2021). The study was conducted according to the mandates of the Declaration of Helsinki and good clinical practices. The patients' confidential information was protected according to the Spanish national data protection law.
Study protocol and variables
| Inclusion/exclusion criteria | Inclusion criteria were all patients with pituitary acromegaly diagnosed at age ≥ 65 years attending different participating hospitals with at least 1 year of follow-up at the same hospital Patients with incomplete data were excluded from the study |
| Clinical data | Date of birth and date of diagnosis, sex, body mass index, specific clinical manifestations related to acromegaly, estimated duration of symptoms before diagnosis of acromegaly, comorbidities, last follow-up |
| GH and IGF-1 | Growth hormone and insulin-like growth factor type 1 levels Baseline and after any treatment |
| Tests | Hormonal workup, imaging procedures |
| Tumor characteristics | Tumor size, sinus invasion evaluated by Knosp classification, sellar involvement, and chiasm compression |
| Treatment | Therapeutic modalities, first- and second- line therapies, side effects, outcomes |
| Mortality | Date of death, cause |
Definition of Variables
The diagnosis of acromegaly was made according to the clinical practice guidelines criteria at the time of diagnosis. Incidental diagnosis was established when the diagnosis of acromegaly was made as the result of a brain magnetic resonance imaging (MRI) performed for any reason that detected a pituitary adenoma, leading to the final diagnosis of acromegaly. Time with symptoms before diagnosis was the time registered in medical records, when the patient estimated the symptoms had started. The comorbidities at diagnosis and date and cause of death were obtained from the medical records. The presence of baseline CVD was defined as the existence of clinical cardiovascular morbidities at acromegaly diagnosis: ischemic heart disease, myocardial infarction, stroke, or peripheral vascular disease.
Active disease was defined as specific age- and sex-adjusted reference range of IGF-1 level above 1.2 upper limit of normal (ULN), and controlled disease was defined as IGF-1 levels within or less than 1.2 ULN for more than 6 months.
Statistical Analysis
Numerical data are expressed as medians (p50) and interquartile ranges (IQRs). Categorical data are described using numbers and percentages. Comparison between 2 groups (before and after 2010) was performed using t test/ Mann-Whitney U test for numerical data and chi-square test/Fisher exact test for categorical variables as appropriate.
The death and survival of the patients were considered as the desired events and censored respectively. The time to event was defined as the interval between diagnosis and death or the last follow-up in the censoring (in months). Kaplan-Meier curves were constructed to trace survival, and Cox proportional hazard models were used to assess those factors associated with mortality. First, we compared the raw survival curves using log rank, Tarone-Ware, and Wilcoxon tests. The following binary variables were tested: 1) patient characteristics: year of diagnosis before or after 2010, incidental diagnosis, and sex; 2) comorbidities: hypertension, dyslipidemia, diabetes, arthropathy, obstructive sleep apnea syndrome (OSAS), previous CVD, or cancer; 3) acromegaly control; 4) tumor characteristics: macroadenoma, sinus invasion. These analyses were performed unadjusted and then carried out with serial adjustments by age, baseline GH, and IGF-1 levels as confounders. A stepwise Cox regression analysis was then executed, and the final selected model was evaluated by the predictive power using Harrell's C concordance statistic. Results are reported as hazard ratios (HRs) and 95% CI. Age- and sex-specific mortality rates among the general Spanish population extracted from https://www.ine.es/index.htm were used to calculate SMRs. All statistical tests were performed using the STATA 16 package.
Results
Baseline Characteristics
A total of 126 patients were registered, of whom 2 had an ectopic acromegaly and 6 were not included in the analyses because of incomplete data. Therefore, a total of 118 patients were finally analyzed.
Of the 118 patients, 42 (35.6%) were diagnosed before 2010 and 76 (64.4%) after. Table 2 shows the baseline characteristics of both groups. The median and IQR age in years at diagnosis was 71.7 (5.4); 34 individuals (28.8%) were older than 75 years, with fewer men 34 (28.8%) than women, all without statistical differences between periods.
Baseline characteristics of acromegaly according to year of diagnosis
| All | Up to 2010 | After 2010 | P | |
|---|---|---|---|---|
| No. (%) | 118 (100) | 42 (35.6) | 76 (64.4) | |
| Age at diagnosis, y; median (IQR) | 71.7 (5.4) | 68.2 (8.6) | 71.2 (7.7) | .25 |
| > 75, n (%) | 34 (28.8) | 11 (26.2) | 23 (30.3) | .41 |
| > 80, n (%) | 9 (7.6%) | 2 (4.8) | 7 (9.2) | .32 |
| Male sex, n (%) | 34 (28.8) | 12 (28.6) | 22 (29.0) | .57 |
| SBD, mo; median (IQR) | 48.0 (100) | 66 (90.5) | 24 (90.0) | .03 |
| Incidental, n (%)a | 20 (17.4) | 3 (7.3) | 17 (23.3) | .03 |
| GH, ng/mL; median (IQR)b | 7.23 (11.6) | 12.1 (13.6) | 5.7 (6.8) | .01 |
| IGF-1, ng/mL; median (IQR) | 573.0 (321.8) | 583.0 (303.0) | 551.5 (327.5) | .10 |
| IGF-1 (×ULN) | 2.6 (1.8) | 2.7 (1.6) | 2.6 (1.8) | .96 |
| Max diameter, mm; median (IQR)b | 12.0 (6.0) | 11.5 (2.0) | 12.0 (8.7) | .71 |
| Macroadenoma, n (%) | 81 (68.6) | 31 (73.8) | 50 (65.8) | .41 |
| Extrasellar, n (%)c | 50 (48.1) | 17 (48.6) | 33 (47.1) | .53 |
| Chiasm compression, n (%)c | 15 (14.3) | 5 (14.3) | 10 (14.0) | .60 |
| Cavernous sinus invasion, n (%)b | 49 (46.7) | 9 (25.7) | 40 (55.6) | .03 |
Abbreviations: GH, growth hormone; IGF-1, insulin-like growth factor 1; IQR, interquartile range; max, maximum; SBD, symptoms before diagnosis; ULN, upper limit of normal.
Reported in 114 patients.
Reported in 110 patients.
Reported in 105 patients.
The median time with acromegaly-related symptoms before diagnosis (SBD) was 48.0 months (100 months) and was longer in patients diagnosed before 2010 (66.0 [90.5] vs 24.0 [90] months; P < .01) (Fig. 1). Moreover, 20 (17.4%) patients had an incidental diagnosis, which was more frequent after 2010 (3 [7.3%] vs 17 [23.3%]) (see Table 2).

Time with symptoms before diagnosis, according to the time periods. Box plots represent time in months with symptoms in each period.
GH at diagnosis was lower in patients diagnosed after 2010 (12.1 [13.6] vs 5.7 [6.8] ng/mL; P < .01), but IGF-1 ULN was similar in both groups (2.7 [1.6] vs 2.6 [1.8] ULN; P = .10). We did not find any difference regarding tumor features between the 2 study periods in maximum tumor diameter (11.5 [2.0] vs 12.0 [8.7] mm; P = .71), percentage of macroadenomas (73.8% vs 65.8%; P = .41), or extrasellar extension, except for sinus invasion, which was more frequently reported in patients diagnosed after 2010 (9 [25.7%] vs 40 [55.6%]; P < .03) (see Table 2).
Baseline Comorbidities
Body mass index (BMI) at diagnosis was 29.2 (4.9). Ninety-nine (77.1%) patients had hypertension, which was the most prevalent comorbidity (Table 3). Type 2 diabetes mellitus (T2DM) was less frequent (n = 40, 33.9%), without differences between both study periods. Following hypertension, arthropathy was the second most frequently detected comorbidity (n = 54, 45.7%). We did not find differences between both periods in the frequency of comorbidities, except for dyslipidemia (n = 8 [19.1%] vs 36 [47.4%]; P < .01) and OSAS (n = 5 [12.8%] vs 25 [32.9%]; P < .03), both of which were more frequently reported after 2010. At diagnosis of acromegaly there were 17 (14.4%) patients with CVD and 11 (9.3%) with cancer.
Baseline comorbidities according to year of diagnosis
| All | Up to 2010 | After 2010 | P | |
|---|---|---|---|---|
| No. (%) | 118 (100) | 42 (35.6) | 76 (64.4) | |
| BMI median (IQR) | 29.2 (4.9) | 28.6 (4.4) | 29.5 (5.1) | .54 |
| Diabetes, n (%) | 40 (33.9) | 13 (31.0) | 27 (35.3) | .38 |
| Hypertension, n (%) | 91 (77.1) | 29 (69.1) | 62 (81.6) | .09 |
| Dyslipidemia, n (%) | 44 (37.9) | 8 (19.1) | 36 (47.4) | .01 |
| Arthropathy, n (%) | 54 (45.7) | 23 (56.1) | 31 (40.8) | .08 |
| Polyposis, n (%)a | 22 (19.5) | 5 (12.8) | 17 (23.0) | .15 |
| OSAS, n (%)b | 30 (25.8) | 5 (12.8) | 25 (32.9) | .03 |
| Goiter, n (%) | 38 (32.2) | 12 (28.6) | 26 (34.2) | .34 |
| Hypopituitarism, n (%) | 4 (3.4) | 0 | 4 (5.3) | — |
| CVD, n (%) | 17 (14.4) | 3 (7.1) | 14 (18.4) | .08 |
| Cancer, n (%) | 11 (9.3) | 5 (11.9) | 6 (7.9) | .34 |
| Follow-up, mo, median (IQR) | 103.5 (72.7) | 169.4 (100.3) | 59.6 (58.1) | .01 |
Abbreviations: BMI, body mass index; CVD, cardiovascular disease; IQR, interquartile range; OSAS, obstructive sleep apnea syndrome.
Reported in 113 patients.
Reported in 116 patients.
Treatment Strategy and Control According to Year of Diagnosis
As first-line treatment, 72 out of 118 patients (61.0%) underwent surgery, 34 patients (28.9%) were treated with first-generation SRLs (50% octreotide and 50% lanreotide), 9 (7.6%) with cabergoline, and 3 patients refused any kind of treatment.
No differences were found in first-line treatment modalities between both periods (Fig. 2A). Surgery was the preferred treatment followed by SRL in both decades. On the other hand, the percentage of patients that reached disease control after first-line treatment did not change between both periods of time, although it tended to increase from 2010 onward both for surgery (59.0% vs 66.0%) and SRL (33.3% vs 57.9%), but without reaching statistical significance (Fig. 2B).
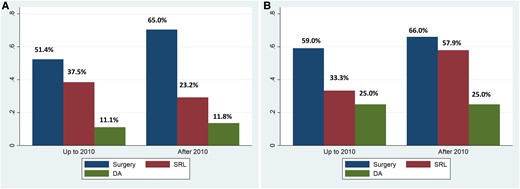
First-line treatment strategy and biochemical control according to year of diagnosis. Data are the percentages of patients. A, First-line treatment approaches and B, percentage of patients under biochemical control in both periods. There are no statistical differences between groups in first-line treatment or biochemical control; however, biochemical control tended to increase from 2010 onward, both for surgery and SRL. DA, cabergoline; SRL, somatostatin receptor ligand.
The median follow-up was 8.6 years (median [IQR] 103, [72.3] months) and, as expected, it was longer in patients diagnosed before 2010 (169.4 [100.3] vs 59.6 [58.1]; P < .01). The percentage of patients under biochemical control at last visit was also similar in both study periods (n = 36 [85.7%] vs 66 [86.8%]; P = .86), before and after 2010, respectively. Despite a similar proportion of patients with controlled disease, the time in months to reach biochemical control was shorter in the last decade (23.0 [64.4] vs 16.1 [28.6]; P < .01) (Fig. 3).
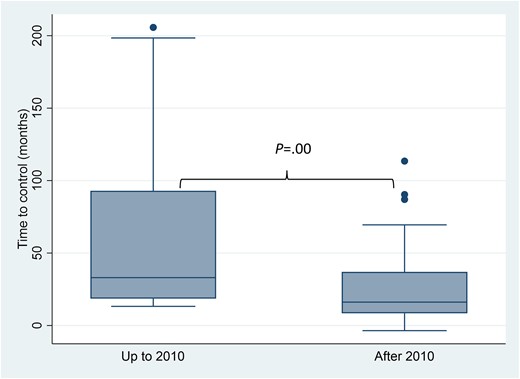
Time to control in months, according to time periods. Box plots represent time in months up to the biochemical control of acromegaly in each period.
Incidental Diagnosis
We studied incidental diagnosis separately to address the hypothesis of whether this particular subgroup could be a different subset of patients. Incidental diagnosis was present in 20 out of the 114 patients (17.5%). There were no statistical differences in baseline variables (Table 4), except for a tendency for these patients to be older and, as expected, they reported experiencing symptoms for less time before being diagnosed. Although sinus invasion was more frequently found in this subgroup, GH and IGF-1 levels, and the tumor features, were not different. Likewise, nonstatistical differences were found in baseline comorbidities or treatment outcomes between both groups of incidental and nonincidental cases.
Baseline differences between patients with non-incidental and incidental diagnosis
| All | Nonincidental | Incidental | P | |
|---|---|---|---|---|
| No. (%)a | 114 (100) | 94 (82.5) | 20 (17.5) | |
| Age at diagnosis, y; median (IQR) | 71.7 (5.4) | 69.9 (8.0) | 72.8 (8.8) | .05 |
| > 75, n (%) | 34 (28.8) | 24 (55.5) | 10 (50.0) | .10 |
| > 80, n (%) | 9 (7.6%) | 6 (6.4) | 3 (15.0) | .19 |
| Male sex, n (%) | 34 (28.8) | 25 (26.6) | 9 (45.0) | .17 |
| SBD, mo; median (IQR) | 48 (100) | 48 (100) | 0 (85) | .03 |
| GH, ng/mL; median (IQR)b | 7.23 (11.6) | 7 (11.1) | 9.7 (17.7) | .13 |
| IGF-1, ng/mL; median (IQR) | 573.0 (321.8) | 556.0 (312.0) | 591.9 (386.0) | .72 |
| IGF-1 (×ULN) | 2.6 (1.8) | 2.6 (1.5) | 2.9 (2.3) | .18 |
| Max diameter, mm; median (IQR)b | 12.0 (6.0) | 11 (6.0) | 14 (6.8) | .22 |
| Macroadenoma, n (%) | 81 (68.6) | 31 (73.8) | 50 (65.8) | .37 |
| Extrasellar, n (%)c | 50 (48.1) | 39 (47.0) | 11 (55.0) | 1.00 |
| Chiasm compression, n (%)c | 15 (14.3) | 12 (14.3) | 3 (15.0) | .45 |
| Cavernous sinus invasion, n (%)b | 49 (46.7) | 32 (37.7) | 17 (85.0) | .01 |
Abbreviations: GH, growth hormone; IGF-1, insulin-like growth factor 1; IQR, interquartile range; max, maximum; SBD, symptoms before diagnosis; ULN, upper limit of normal.
Reported in 114 patients.
Reported in 110 patients.
Reported in 105 patients.
Sex Differences
There were no statistical differences at baseline regarding clinical, biochemical, or tumor characteristics between the sexes (8), However, the number of individuals older than 75 years were more frequent in the women group (29 [34.5%] vs 5 [14.7%]; P = .02). Comorbidities at diagnosis were not different with the exception of arthropathy and goiter, which were more frequently diagnosed in women (Table 5).
Baseline characteristics and comorbidities according to se
| All n = 118 | Women n = 84 | Men n = 34 | P | |
|---|---|---|---|---|
| Age at diagnosis median, y (IQR) | 71.7 (5.4) | 72.2 (5.4) | 70.4 (5.2) | .09 |
| > 75, n (%) | 34 (28.8) | 29 (34.5) | 5 (14.7) | .02 |
| BMI median (IQR) | 29.2 (4.9) | 29.0 (5.0) | 29.8 (4.7) | .40 |
| Diabetes, n (%) | 40 (33.9) | 28 (33.3) | 12 (35.3) | .84 |
| Hypertension, n (%) | 91 (77.1) | 67 (79.8) | 24 (70.6) | .28 |
| Dyslipidemia, n (%) | 44 (37.9) | 31 (36.9) | 13 (38.2) | .89 |
| Carpal tunnel syndrome, n (%) | 27 (22.8) | 20 (24.1) | 7 (20.6) | .68 |
| Arthropathy, n (%) | 54 (45.7) | 45 (54.2) | 9 (26.5) | .01 |
| Polyposis, n (%)a | 22 (19.5) | 16 (20.3) | 6 (17.7) | .75 |
| OSAS, n (%)b | 30 (25.8) | 18 (22.0) | 30 (25.9) | .14 |
| Goiter, n (%) | 38 (32.2) | 32 (38.1) | 6 (17.7) | .03 |
| Hypopituitarism, n (%) | 4 (3.4) | 2 (2.4) | 2 (5.9) | .34 |
| CVD, n (%) | 17 (14.4) | 9 (10.7) | 8 (23.5) | .07 |
| Cancer, n (%) | 11 (9.3) | 5 (6.0) | 11 (17.7) | .06 |
Abbreviations: BMI, body mass index; CVD, cardiovascular disease; IQR, interquartile range; OSAS, obstructive sleep apnea syndrome.
Reported in 113 patients.
Reported in 116 patients.
Survival
Twenty-nine patients died (24.6%): 7 men (20.6%) and 22 women (26.2%) (P = .35). This means a raw mortality rate (death per 1000 individuals per year) of 9.8 (8.2 for men and 10.5 for women). The median and IQR of age of death was 85.9 (7.5) years without differences between periods (85.9 [5.2], before vs 85.1 [9.4] after 2010) or sex (85.3 [8.3] men vs 87.9 [7.1] women), respectively.
The mortality rate in Spain in people aged 65 years or older is 9.55 (13.61 for men and 5.81 for women) (23), thus the SMR in our study was 1.02 (95% CI, 0.57-1.54): 0.60 (95% CI, 0.35-1.06) for men and 1.80 (95% CI, 1.07-2.94) for women, thus, higher in women.
The majority of deaths were in patients diagnosed before 2010 (20/42 [47.6%] vs 9/76 [11.8%]; P < .01). The Kaplan-Meier survival curves are shown in Fig. 4; the median of survival was 195.7 months (95% CI, 170.8-299.7), and there were no statistical differences between both periods or sexes.
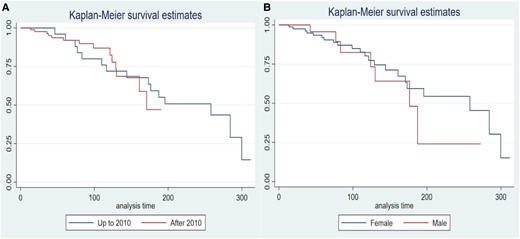
Kaplan-Meier survival curves comparing A, both time periods and B, by sex. There are no statistical differences between periods or sex.
The causes of death are presented in Fig. 5, being in 8 patients (29.6%) cardiovascular, 5 (18.5%) oncological, and the rest were in 5 lung related, 4 age related, 2 Parkinson disease, while in 3 cases the cause of death was not accessible by the clinical records.
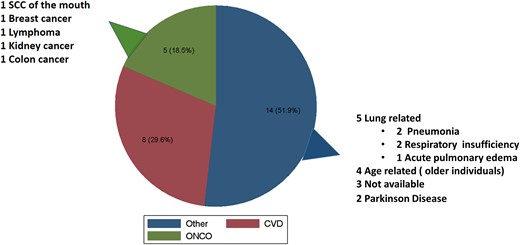
Causes of death. Pie chart of causes of death expressed in absolute number and percentage. SCC, squamous cell carcinoma.
The parsimonious and best predictive model of survival (see “Materials and Methods”) for predicting death kept 3 variables: presence of CVD at diagnosis, age at diagnosis, and acromegaly control, the latter as an adjustment factor (Table 6).
Risk factors of mortality by Cox regression analyses
| HR | 95% CI | P | |
|---|---|---|---|
| CVD | 3.86 | 1.44-10.34 | .007 |
| Age at diagnosis | 1.14 | 1.01-1.22 | .001 |
| Controlled disease | 0.49 | 0.16-1.48 | .207 |
| HR | 95% CI | P | |
|---|---|---|---|
| CVD | 3.86 | 1.44-10.34 | .007 |
| Age at diagnosis | 1.14 | 1.01-1.22 | .001 |
| Controlled disease | 0.49 | 0.16-1.48 | .207 |
Harrell C = P = .77.
Abbreviations: CVD, cardiovascular disease; HR: hazard ratio.
Fig. 6 shows the Cox survival curve, taking into account the presence of CVD and acromegaly control. Patients with CVD (CVD = 1) and uncontrolled acromegaly (control = 0) had a lower survival probability than patients without CVD (CVD = 0) and controlled acromegaly (control = 1).
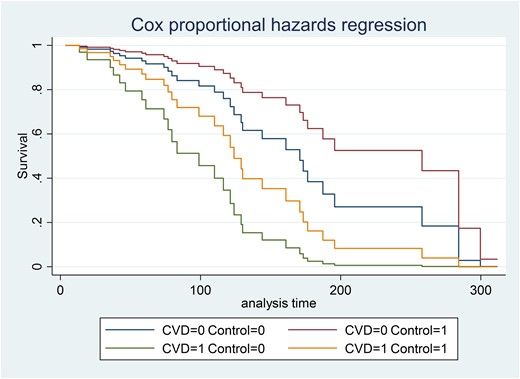
Cox proportional hazards regressions according cardiovascular disease and acromegaly control. CVD, cardiovascular disease; CVD = 0, means without CVD; CVD = 1, means with CVD; Control = 0, means not controlled; Control = 1, means controlled patients.
Discussion
In our study, patients diagnosed with acromegaly at an older age had similar baseline characteristics, comorbidities, treatment outcomes, and survival, irrespective of the period of time considered—diagnosis before or after 2010. The incidental diagnosis of acromegaly has been more frequent in recent years. As a whole, SMR did not exceed that of the Spanish population aged 65 years or older. However, it was higher in women.
Taking into account the year of diagnosis, we did not find statistical differences regarding (I) baseline biochemical characteristics since the IGF-1 ULN was similar in both groups; (II) tumor features, like maximum tumor diameter, percentage of macroadenoma, extrasellar invasion, or chiasm compression were also similar; sinus invasion, however, was more frequently reported in patients diagnosed after 2010. Sinus invasion data have to be taken with caution, and in this regard we speculate that such a difference could eventually be explained by the improvement of technology and the increasing warning of the relevance of reporting cavernous sinuses involvement to aid the surgical strategy in the last period. (III) Regarding comorbidities, hypertension was the most frequently reported in both study periods; other comorbidities were similarly distributed in both periods, except for dyslipidemia and OSAS, which were more frequently detected in the last years. These last results have to be taken with caution because of the importance of comorbidity screening, which has been emphasized in recent years, thus, the increase in comorbidities could reflect more active detection of them. The reported prevalence of comorbidities in this series are relatively similar to that reported in the Spanish registry with younger patients (11) except for hypertension (77.1% vs 39.1%; P < .01), arthropathy (45.7% vs 19.6%; P < .01), and sleep apnea 13.2% vs 25.8%; P < .02, where the older age is probably the explanatory cause of such differences and more active comorbidities screening in recent year cannot be ruled out.
There is considerable evidence that new acromegaly diagnosis is increasing among older people (3, 24-26). This is a relevant fact from a health perspective. On the one hand, the population is aging in industrial countries, thus, the increase of new diagnoses of acromegaly, as in other diseases, is mirroring a higher percentage of this age group in the population due to the enhanced longevity. On the other hand, an increased prevalence of incidental acromegaly diagnosis has also been reported (27), mostly related to the routine use of MRI for brain imaging. Our study found an increase in incidental diagnoses in the last decade. This subset of patients could potentially correspond to true cases of early acromegaly diagnosis, which have been unmasked much earlier in the natural history of the disease, thus implying that these patients could have potentially better outcomes due to a lower length of disease activity. Nevertheless, in our series, the incidentally diagnosed group was not different in GH, IGF-1, tumor features, or comorbidities with respect to those patients diagnosed with full symptomatic presentations, except for a tendency of being older and with less duration of acromegaly-related symptoms. The lack of differences in comorbidities could be related to the fact that some or most of these patients with apparently “incidentally diagnosed” disease may not be in an early stage of the disease, thus suffering from a more insidious paucisymptomatic and, in fact, longer biochemical disease. Along the same line, the more frequently reported sinus invasion of patients with incidental diagnosis could be related to the fact that this group has been more frequently diagnosed in the last decade when, as we stated earlier, the MRI technology has improved and radiology reports are also more focused on the evaluation of sinus invasion, although these facts should be interpreted with caution.
Although we did not observe a change in the first-line treatment approach between study periods, or the percentage of patients controlled after each treatment modality used, the time to reach disease control has fallen in the last decade. This is a very important difference because faster disease control and less time of GH/IGF-1 overexposure reduce mortality (15, 19-21). Although those patients diagnosed after 2010 had faster control compared to those diagnosed before 2010, there were no statistical differences in the Cox survival curves between periods. Moreover, as a whole, the SMR was 1.02 (95% CI, 0.57-1.54). Thus, in our study, acromegaly diagnosis in patients older than 65 years, treated following the current clinical guidelines, was not associated with a reduced life-expectancy for the whole group. However, we found statistically significant sex-related differences, SMR being higher in women. The SMR was 0.60 (95% CI, 0.35-1.06) for men, not different from the general age-and sex-adjusted Spanish population. By contrast, SMR was 1.80 (95% CI, 1.07-2.94) for women, significantly higher than the general age- and sex-adjusted Spanish population.
Sex disparities have been reported previously; Dal et al (28) performed a meta-analysis and found that female patients with acromegaly were older and exhibited lower IGF-1 concentrations and a longer diagnostic delay than men. A much longer GH exposure in women has been supported by a higher mean number of comorbidities in women than in men at diagnosis (22). Moreover, women have higher GH relative to IGF-1 levels than men and quality of life is more adversely affected in women both before and after treatment (29, 30). Likewise, a worse metabolic profile as higher visceral adiposity dysfunction and insulin resistance induced by GH excess is also more prevalent in women at the time of diagnosis (31, 32) and in some series women have an increased risk of T2DM and hypertension (30) compared to men. Mortality sex-related differences have also been observed in some published nationwide acromegaly registries. The study by Mercado et al (16) found a surprisingly reduced SMR of 0.41 (95% CI, 0.20-0.69) for men and 1.04 (95% CI, 0.53-1.57) for women. The study by Ritvonen and colleagues (17), in concordance with our results, found that the SMR in women was elevated at 2.5 (95% CI, 1.85-3.40); conversely in men, the SMR was 1.4 (95% CI, 1.05-1.91). Although being globally slightly higher than in the general population, when the SMR was analyzed by age groups in men, there were no differences, except for men aged 55 to 59 (SMR 4.8; 95% CI, 2.44-8.56). Recently, the Korean registry study by Park et al (33) found that the risk of mortality was also significantly higher in women (HR 1.75; 95% CI, 1.07-2.84; P = .025) but not in men (HR 1.51; 95% CI, 0.83-2.78; P = .18) compared with age- and sex-matched controls. In our study, the higher SMR in women could be explained by many reasons: (I) As explained earlier, women could suffer from a less symptomatic acromegaly due to an estrogen-suppressive effect on the hepatic IGF-1 production being unmasked after menopause. (II) A worse metabolic profile due to a longer GH exposure and or reduced estrogen in postmenopausal women could be present, facilitating vulnerability to CVD similar to that seen in women with T2DM (34), and (III) in our series, despite no statistical differences being found at the median of age between sex, more women were diagnosed at ages older than 75 years (see Table 5).
In contrast with some registries that found that cancer is the main cause of death in the last years (16-19), in the present study the presence of CVD and age at diagnosis (but not the study period) were the most important variables associated with mortality after adjusting for acromegaly disease control.
The frequency of the 3 major causes of death in people older than 65 years in Europe are the following: 39.7% diseases of the circulatory system (mainly ischemic heart disease), cancer (22.7%), followed by respiratory diseases 8.6% (35), which is similar to what has been reported in Spain (36). Therefore, in our series the causes of death were not different from those observed in the Spanish general population older than 65 years.
In conclusion, the presence of CVD, age at diagnosis of acromegaly, and biochemical control of the disease were the determinants of survival in the present study. Mortality in the whole cohort did not differ from the Spanish SMR. However, we found significant sex-related differences, with SMR being higher in women. As CVD is the leading cause of mortality, it may be advisable to implement an intense CVD protective treatment, particularly in women as soon as acromegaly is diagnosed, in addition to tight hormonal disease control to prevent GH-related comorbidity development or exacerbation and excess mortality.
Funding
This work was partly supported by a grant from Instituto de Salud Carlos III, Madrid, Spain, on personalized treatment of acromegaly (PMP:22/00021).
Author Contributions
Conceptualization, B.B., M.P.D.; methodology, B.B.; writing—original draft preparation, B.B.; writing—review and supervision, M.P.D. All the authors participated in the data collection and approved the submitted version.
Disclosures
B.B., M.P., A.V., C.A.E., A.V., R.C., I.B., S.G., F.C., S.M.W., and M.P.D. have received consulting fees, research support, or participated in clinical trials supported by Pfizer, Ipsen, Quiasma, and/or Recordati. P.I., R.V., M.D.M., M.A.C., J.A., E.A., I.N.T., B.L., C.G.G., L.M., E.M.T., J.D., and R.S. have nothing to disclose.
Data Availability
The authors agree to make data and materials supporting the results or analyses presented in their paper available on reasonable request.
References
Abbreviations
- BMI
body mass index
- CVD
cardiovascular disease
- GH
growth hormone
- HR
hazard ratio
- IGF-1
insulin-like growth factor-1
- IQR
interquartile range
- MRI
magnetic resonance imaging
- OSAS
obstructive sleep apnea syndrome
- SBD
symptoms before diagnosis
- SMR
standardized mortality ratio
- SRLs
somatostatin receptor ligands
- T2DM
type 2 diabetes mellitus
- ULN
upper limit of normal
