


Abstract
Observational studies indicated obesity and glutamatergic dysfunction as potential risk factors of depression, and reported disturbance of glutamine metabolism in obese state. However, it remains unclear whether the interrelationships between obesity, glutamine, and depression are causal.
We conducted 2-sample bidirectional mendelian randomization (MR) analyses to explore the causalities between circulating glutamine levels, specific depressive symptoms, major depressive disorder (MDD), and body mass index (BMI).
Univariable MR, multivariable MR (MVMR), and linkage disequilibrium score regression (LDSR) analyses were performed.
Genetic downregulation of glutamine was causally associated with MDD, anhedonia, tiredness, and depressed mood at the false discovery rate (FDR)-controlled significance level (estimate, −0.036 ∼ −0.013; P = .005 to P = .050). Elevated BMI was causally linked to lower glutamine level (estimate, –0.103; P = .037), as well as more severe depressed mood, tiredness, and anhedonia (estimate, 0.017 ∼ 0.050; P < .001 to P = .040). In MVMR analysis, BMI was causally related to depressed mood dependently of glutamine levels. Conversely, it showed limited evidence supporting causal effects of depression on glutamine levels or BMI, except a causal association of tiredness with elevated BMI (estimate, 0.309; P = .003). LDSR estimates were directionally consistent with MR results.
The present study reported that higher BMI was causally associated with lower glutamine levels. Both obesity and downregulation of glutamine were causally linked to depression.
Depression affects more than 300 million people and is one of the main causes of disability worldwide (1). Depression is associated with many neurochemical changes, and potential blood-based biomarkers of depression have been identified by recent studies (2). Among various metabolites involved in the biological mechanisms underlying depression, glutamine, the main glutamatergic metabolite in the periphery, has triggered heated discussion (3).
Glutamine is a precursor of neurotransmitter glutamate and gamma-aminobutyric acid, and is the most abundant and versatile amino acid in the body (4). Accumulating evidence implicates the alterations in the glutamatergic system in playing a key role in the pathophysiology of depressive disorders. For instance, ketamine, an antagonist of glutamate receptors, was shown to increase glutamate and glutamine in rodents (5) and decrease depressive symptoms in depressed patients (6). Several studies revealed that glutamatergic metabolites (glutamine + glutamate) levels decreased in the medial frontal cortex (7) and prefrontal cortex (8) of patients with depression. A recent meta-analysis also suggested that major depressive disorder (MDD) patients were characterized by decreased levels of glutamine in peripheral blood (2). Nevertheless, there are still questions regarding the potential causality of the association between circulating glutamine levels and depression.
Obesity is a major public health issue that often co-occurs with depression within individuals (9). Epidemiological evidence implicates bidirectional relationships between obesity and depression: Obesity longitudinally increases the risk of developing depression, and vice versa, depression increases the risk of subsequent obesity (10, 11). The link between obesity and depression could be interpreted by disturbed metabolism in obese status, such as altered glucocorticoid, adipokine, insulin, leptin, and inflammatory signaling (12). In addition, human and murine combined analyses also have demonstrated that glutamine metabolism is altered in patients with obesity (13). Previous studies suggested that circulating glutamine is decreased in obese children without weight interventions (14), and obese children displayed increased plasma glutamine after weight-loss intervention (15). It was also documented that glutamine levels were downregulated in white adipose tissue of obese individuals (13).
Despite previous studies that respectively examined the associations between obesity and depression, glutamine and depression, as well as obesity and depression, no study has been performed to analyze the interrelationships between glutamine, obesity, and depression comprehensively. Moreover, it remains unclear whether these epidemiological associations are causal, considering biases due to reverse causality or residual confounding. The causal effect of exposures of interest on outcomes can be assessed by mendelian randomization (MR), a technique that uses genetic variants as instrumental variables and is able to diminish residual confounding due to random assortation of genetic variants at conception (16). In addition to MR, genome-wide association study (GWAS) data also enable linkage disequilibrium (LD) score regression (LDSR) analysis, which assesses single-nucleotide variation (SNVs; formerly single-nucleotide polymorphism [SNP])-based phenotype heritability and coheritability between 2 traits (17, 18). Previous MR studies indicated that obesity is related to depression (19-21), but few have investigated the causal effects of glutamine levels on depression, nor the causal associations between obesity and circulating glutamine levels.
Thus, in the present study, we first carried out MR analyses to explore the causal effects of body mass index (BMI) on glutamine levels, as well as the causal effects of BMI and circulating glutamine levels on depression using powerful genetic instruments from GWAS mainly from European populations. Then, LDSR analyses were conducted to complement the results of MR.
Materials and Methods
Genome-wide Association Study Data Sources
Circulating glutamine levels
The GWAS summary data sets of circulating glutamine level (22) were derived from 14 European cohorts comprising 24 462 individuals from Finland (53.1%), the Netherlands (22.1%), Estonia 3884 (15.5%), Germany (7.0%), and Poland (2.3%) (Supplementary Table S1) (23). This study quantified more than 100 circulating metabolites using nuclear magnetic resonance metabolomics, including amino acids, pyruvate, and fatty acids. We selected 6 independent SNVs associated with circulating glutamine levels at the genome-wide significant level (P < 5 × 10⁻⁸) as genetic instruments in our MR analyses (Supplementary Table S2) (23).
Body mass index
We extracted summary-level data for BMI from the Genetic Investigation of Anthropometric Traits (GIANT) consortium (24) comprising 339 224 individuals (Supplementary Table S1) (23). Association analyses were carried out with genotypes or imputed genotype dosages after regression on age and sex and inverse normal transformation of the residuals. We identified 90 independent, genome-wide significant SNVs as genetic instruments for BMI (Supplementary Table S3) (23).
Depression
For the MDD outcome, we used summary-level data from the Psychiatric Genomics Consortium (PGC) and the UK Biobank (UKB) (25). The PGC data set included data from 8 cohorts. Cases were ascertained by clinician-administered checklists, trained interviewers, and medical record reviews. The UKB data sets added up scores on 2 continuous items (“How often have you felt down, depressed or hopeless over the past two weeks?” and “How often have you had little interest or pleasure in doing things over the past two weeks?”; the 2 items were evaluated on a 4-point Likert scale: “Not at all,” “Several days,” “more than half the days,” “Nearly every day”), resulting in a continuous depression score to define broader MDD (25). Of note, although the GWAS meta-analysis by Nagel et al (25) obtained a larger sample size by including different definitions of MDD, this would lead to phenotype misclassification. Nonetheless, previous literature has indicated that these phenotypic definitions of MDD were relevant (25) and findings between depression phenotypes were similar (20). The original study by Nagel et al (25) reports data from 688 809 individuals, which included individuals from 23andMe, PGC, and UKB. Due to the 23andMe data-sharing policy, we used GWAS summary data from 381 455 individuals, which excludes 23andMe participants, as provided by Nagel et al (25) at https://ctg.cncr.nl/software/summary_statistics (Supplementary Table S1) (23). A total of 69 genome-wide significant SNVs were taken as the genetic instruments for MDD from the meta-analysis of PGC studies and UKB without 23andMe samples (Supplementary Table S4) (23).
GWAS on depressive symptoms (anhedonia, depressed mood, tiredness, and restlessness) in the UKB were assessed using an online questionnaire (26), which asks about the presence of depressive symptoms, as defined by the Diagnostic and Statistical Manual for Mental Disorders (Fourth Edition) (27), over the past 2 weeks. Each symptom was evaluated on a Likert scale from 1 (not at all) to 4 (nearly every day), as illustrated in Supplementary Table S1 (23). It is worth mentioning that the main mode of presenting depression nowadays is still by reporting somatic symptoms (28), such as tiredness, but the effect of somatic diseases cannot be completely ruled out. This may lead to potential phenotype misclassification and represents a future endeavor for the diagnosis of depression. The sample size for GWAS of individual depressive symptoms ranged between 442 840 and 449 019. Detailed methods are presented on the website of Neale Lab (https://www.nealelab.is/uk-biobank/) (Supplementary Table S1) (23). Finally, 13 SNVs for anhedonia, 40 SNVs for tiredness, 14 SNVs for depressed mood, and 19 SNVs for restlessness were obtained as instrumental variables (Supplementary Table S5) (23).
Statistical Analysis
Bidirectional mendelian randomization
Fig. 1 shows the study design. We performed 2-sample bidirectional MR analyses to estimate the causal associations between BMI, circulating glutamine levels, and depression. Specifically, forward MR analyses were performed with BMI and circulating glutamine as exposures and depression as outcomes. Conversely, reverse MR analyses were performed with depression as exposures, and BMI and glutamine as outcomes. The included instruments were pruned at r2 less than 0.01 based on the European 1000-Genomes reference panel (29) at genome-wide significance (P < 5 × 10⁻⁸).
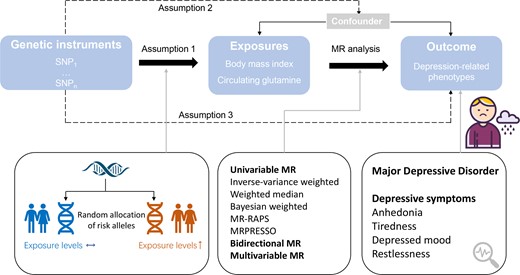
Study design for MR analysis. MR, mendelian randomization; MRPRESSO, Mendelian Randomization Pleiotropy RESidual Sum and Outlier; MR-RAPS, MR using robust adjusted profile score; SNP, single-nucleotide polymorphisms.
Complementary MR approaches were applied in the present study. First, we used the inverse variance–weighted (IVW) method with the random-effects method as the primary univariable analysis (30), which provides a precise estimation while considering possible heterogeneity of the Wald ratio estimates from individual SNVs (31). In addition, we used a set of model-based analyses, including weighted median (32), Bayesian-weighted MR (33), and MR using robust adjusted profile score (MR-RAPS) (34). Each method relaxes distinct assumptions regarding pleiotropy to access sensitivity results to horizontal pleiotropy. The intercept from the MR-Egger model (35) was used for a statistical test for pleiotropy in the analysis. We also conducted analyses investigating the influence of pleiotropic outlier variants using the Mendelian Randomization Pleiotropy RESidual Sum and Outlier (MR-PRESSO) methods (36). Moreover, we applied multivariable MR (MVMR) (37) to examine the independent causal effects of BMI and circulating glutamine levels, adjusting for pleiotropic influence of each other, on depressive symptoms. Heterogeneity across estimates was assessed using Cochran Q (P < .05 was considered statistically significant) (38). To examine sensitivity to single outlying and potential pleiotropic variants, we performed leave-one-out analysis, systematically removing a single variant in the genetic instruments and reestimating IVW effects. We also performed single SNV MR analysis, which generated forest plots to show the causal effect as estimated using each of the SNVs on its own, and compared against the causal effect as estimated using all the SNVs. Finally, we created scatter plots to visually inspect the data for strong influence by a single variant or for systemic bias across multiple variants (39).
MR analyses were performed using R version 4.0.3 and the TwoSampleMR package version 0.5.6 (39). All the genetic instrumental variables used in the present study were extracted using the “extract_instruments” function of the R package TwoSampleMR version 0.5.6 on the MR-Base platform (39) with the following parameters: P < 5 × 10⁻⁸; LD clumping r2 threshold, 0.01; clumping kb window, 10 000 kb. When any of the genetic instruments was missing in the summary statistics of the outcome, we used the SNV in high LD (r2 > 0.8) with the missing SNV as a proxy, which replaced the missing SNV in the following analysis. If no proxies of the missing SNV could be identified, this SNV was excluded from the MR analysis. The TwoSampleMR package aligns summary statistics to the forward strand and excludes SNVs with a forward strand that could not be inferred. We applied the Benjamini-Hochberg procedure for controlling the false discovery rate (FDR) in multiple comparisons (40). The Benjamini-Hochberg–corrected P values (FDR P values) were used as the threshold of significance. Associations that passed the FDR controlled significance levels (FDR P values < .05) were considered to be strong evidence of associations, whereas results with P less than .05 but that failed to pass FDR correction were regarded as suggestive associations. MR-PRESSO analysis was performed using the MRPRESSO package in R. We conducted MR-RAPS analysis using mr.raps R package version 0.4 and Bayesian-weighted MR using BWMR R package version 0.1.1.
Linkage disequilibrium score regression analysis
We also performed LDSR to compute the SNV-based heritability (h2) of each phenotype and genetic correlations between BMI, circulating glutamine levels, and depression using LDSC version 1.0.1 (https://github.com/bulik/ldsc) in Python version 3.1. LDSR method regresses GWAS χ2 statistics on LD scores, and ascertains genetic correlations between 2 phenotypes using the regression slope (17, 18). We first harmonized the GWAS summary statistics with the “munge_sumstats.py script” function of the LDSC package. Then cross-trait LD score regression was performed with the “ldsc.py” function and by using the precomputed LD score files from 1000 Genomes European data as the reference panel (29). The detailed analytical procedure can be found at https://github.com/bulik/ldsc/wiki/Heritability-and-Genetic-Correlation.
Results
After palindromic SNV exclusion and proxy replacement, numbers of instrumental variables in MR analysis ranged from 88 to 90 for BMI and 5 for circulating glutamine levels. F statistics ranged from 63 to 91. (Supplementary Table S6) (23).
Forward Mendelian Randomization of Body Mass Index on Circulating Glutamine Levels
As shown in Fig. 2, random-effects IVW analysis revealed that genetically determined higher BMI was associated with decreased circulating glutamine levels (estimate, −0.103; P = .037). Results were directionally consistent in the weighted median, Bayesian-weighted MR, and MR-RAPS. The association appeared to be affected by heterogeneity between SNVs as defined by Cochran Q (P of Cochran Q = 0.014), but there was no observed pleiotropy (MR-Egger intercept = −0.006; P = .071) and no outliers (Supplementary Table S6) (23). Moreover, in the leave-one-out analysis, the MR results were not statistically significant when excluding these SNVs one by one, rs13021737, rs7551507, rs6567160, rs1167827, rs2820292, rs3817334, rs1167827, rs12885454, or rs12885454. However, the direction of the effect was not changed, the 95% CIs overlapped substantially with the 95% CI as estimated using all the SNVs, and the effect size was varied in a small range between −0.12 and −0.09, indicating that the results were stable in general. (Supplementary Fig. S1) (23).
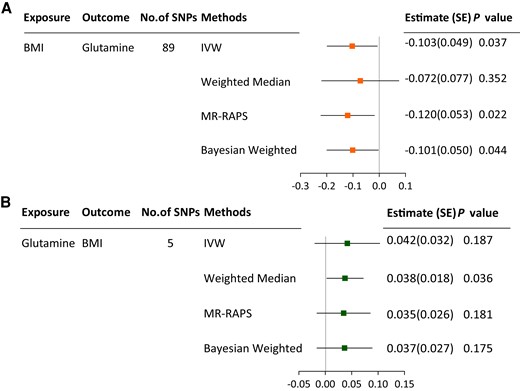
MR associations between BMI and circulating glutamine levels. A, MR associations of BMI with circulating glutamine levels; B, MR associations of circulating glutamine levels with BMI. BMI, body mass index; IVW, inverse-variance weighted; MDD, major depressive disorder; MR-RAPS, mendelian randomization using robust adjusted profile score.
Forward Mendelian Randomization of Body Mass Index on Depression
In random-effects IVW analysis, genetically predicted increased BMI was causally associated with depressive symptoms, including tiredness and anhedonia (tiredness: estimate, 0.050; P < .001; anhedonia: estimate, 0.024; P = .002). BMI was suggestively associated with depressed mood (estimate, 0.017; P = .040) (Fig. 3A). These associations were robust in weighted median analysis, MR-RAPS, and Bayesian-weighted MR. Correction of outlier variants using MRPRESSO resulted in a significant causal effect of BMI on anhedonia and tiredness, but not depressed mood (Supplementary Table S6) (23). The Cochran Q value implied a substantial heterogeneity among estimates obtained from individual SNVs, but the MR-Egger regression analysis resulted in no indication of nonbalanced pleiotropy (Supplementary Table S6) (23). Diagnostic plots suggested a small possibility that results were influenced by outliers or systematic bias (Supplementary Figs. S2-S4) (23). In MVMR analysis, the strength of the associations of BMI with MDD, anhedonia, and tiredness was attenuated compared with those estimated in univariable MR, but remained statistically significant, whereas the causal effect between BMI and depressed mood turned out to be nonsignificant, albeit directionally consistent after adjusting for glutamine levels (see Fig. 3A), suggesting that BMI was causally related to depressed mood dependently of circulating glutamine levels.

IVW and MVMR associations of BMI and circulating glutamine levels with depression. BMI, body mass index; FDR P value, P values after Benjamini-Hochberg correction; IVW, random-effects inverse-variance weighted method; MDD, major depressive disorder; MVMR, multivariable mendelian randomization. Error bars indicate 95% CIs. P values that passed Benjamini-Hochberg correction are marked in bold.
Forward Mendelian Randomization of Circulating Glutamine Levels on Depression
As shown in Fig. 3B, genetically predicted decreased circulating glutamine levels were associated with MDD, anhedonia, tiredness, and depressed mood after FDR correction (MDD: estimate, −0.036; P = .005; anhedonia: estimate, −0.015; P = .014; tiredness: estimate, −0.019; P = .024; depressed mood: estimate, −0.023; P = .013). All results were robust in the analysis using alternative estimation methods, including MR-RAPS and Bayesian-weighted MR analysis (Supplementary Table S6) (23). There was a suggestive association between glutamine level and restlessness (estimate, −0.013; P = .050). Heterogeneity and pleiotropy were not observed (P of Cochran Q > .05; P for MR-Egger intercept > .05). MR-PRESSO did not identify any outlier and further supported a lack of bias related to pleiotropy (Supplementary Table S6) (23). Leave-one-out analysis and forest plots indicated that an SNV did not drive the effect size estimates (Supplementary Figs. S5-S9) (23). When applying MVMR analysis, we found that causal effects of circulating glutamine levels on depressed mood were slightly attenuated compared with those in univariable MR; however, glutamine levels have greater causal associations with MDD and tiredness, when accounting for BMI, compared with univariable MR estimates (see Fig. 3B). Moreover, since glutamine has been causally implicated in neurodegenerative disorders, we then checked all the instrumental variables of glutamine using PhenoScanner (41), but we did not find any of the SNVs to be significantly associated with other neurological diseases. In addition, we performed MVMR adjusting for pleiotropic effect of major neuropsychiatric diseases: Alzheimer disease, schizophrenia, and Parkinson disease, respectively. The associations of glutamine with depression remained stable after adjustment, suggesting that the pleiotropic effect did not bias our results (Supplementary Table S7) (23).
Reverse Mendelian Randomization
In reverse MR evaluating causal effects of depression on BMI and circulating glutamine levels, as well as causal effects of glutamine levels on BMI, the number of genetic instruments used in the final analyses was between 11 and 67, and F statistics was between 37 and 39.
There was limited evidence in the MR analysis for associations of depression and BMI with circulating glutamine levels, whereas there was evidence in IVW analysis for associations of tiredness, rather than the other depression-related traits, with BMI (estimate, 0.309; P = .003) (Fig. 2 and Fig. 4). The tiredness-BMI association was replicated across MR-RAPS, Bayesian-weighted analyses, and after outlier-correction in MRPRESSO (Supplementary Table S6) (23). Heterogeneity across estimates was detected by Cochran Q (P of Cochran Q < .001), but there was no observed pleiotropy defined by MR-Egger (MR-Egger intercept = 0.008; P = .302) (Supplementary Table S6) (23).
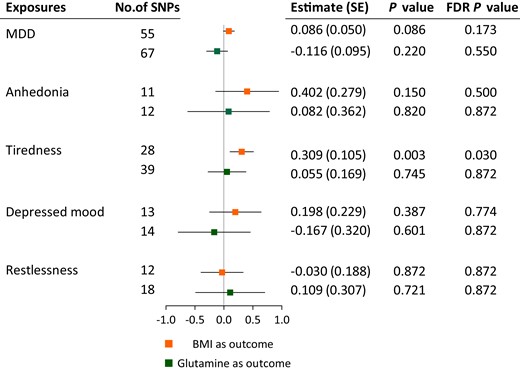
MR associations of depression with BMI and glutamine levels. BMI, body mass index; FDR P value, P values after Benjamini-Hochberg correction; MDD, major depressive disorder. Error bars indicate 95% CIs. P values that passed Benjamini-Hochberg correction are marked in bold.
Linkage Disequilibrium Score Regression Analysis
Levels of circulating glutamine were reversely related with BMI as defined by LDSR analysis (genetic correlations = −0.304; FDR P < .001). There was an indication for genetic correlations of circulating glutamine levels with MDD and depressive symptoms after FDR correction, with the lowest correlation seen for MDD and the highest for depressed mood (MDD: genetic correlations = −0.135; FDR P = .044; depressed mood: genetic correlations = −0.282; FDR P = .004; anhedonia: genetic correlations = −0.207; FDR P = .027; tiredness: genetic correlations = −0.167; FDR P = .044; restlessness: correlations = −0.216; FDR P = .027). Of note, although the causal effect of BMI on MDD and restlessness was insignificant in MR analysis, BMI showed significant genetic correlations with MDD and all depressive symptoms in LDSR (MDD: genetic correlations = 0.147; FDR P < .001; anhedonia: genetic correlations = 0.208; FDR P < .001; depressed mood: genetic correlations = 0.133; FDR P < .001; tiredness: genetic correlations = 0.238; FDR P < .001; restlessness: genetic correlations = 0.061; FDR P = .031). There were strong genetic correlations between each depression-related trait (Fig. 5B).
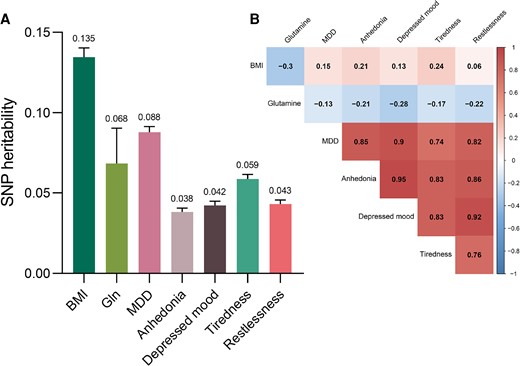
Single-nucleotide variations (formerly single-nucleotide polymorphisms) (SNP)-based A, heritability, and B, genetic correlation estimates between BMI, circulating glutamine levels, and depression. Abbreviations: BMI, body mass index; MDD, major depressive disorder. P values were FDR controlled using the Benjamini-Hochberg method. All genetic correlations were significant and passed Benjamini-Hochberg correction.
The SNV-based heritability was relatively low for circulating glutamine levels (h2 = 0.068) and depression-related traits (h2 range = 0.038 ∼ 0.088), whereas BMI displayed higher levels of heritability (h2 = 0.135) (Fig. 5A).
Discussion
In the present study, we evaluated the causal associations and SNV-based genetic correlations between BMI, circulating glutamine levels, and depression. First, using 2-sample MR, we observed a causal relationship of BMI with glutamine levels in peripheral blood. Both elevated BMI and lower circulating glutamine levels could be a risk factor of depression (Fig. 6). MVMR suggested that BMI was causally related to depressed mood dependently of circulating glutamine levels. Our study provides evidence supporting the association between metabolic dysregulation and depression.
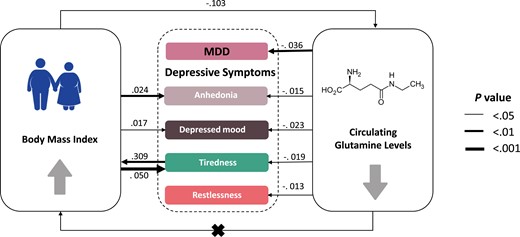
Causal graph between circulating glutamine levels, body mass index, and depression. Significant causal effects are presented as arrows with the estimated effect sizes alongside. All traits have been standardized so effect sizes are comparable in unit (SD/SD). MDD, major depressive disorder.
An increasing body of animal research, observational studies, clinical trials, and neuroimaging research provides accumulating evidence of glutamatergic dysfunction in depression (3). Reduction of glutamine and glutamate levels across brain regions in patients with MDD was consistently reported in magnetic resonance spectroscopy studies (7, 8). Animal models demonstrated hypoactive glutamine synthetase in depressed mice, while a glutamine-supplemented diet showed antidepressant activity by ameliorating glutamatergic dysfunction (42). Associations of glutaminergic metabolism with depression may be clinically relevant. Research has suggested that therapeutic interventions increasing glutamine synthetase activity, such as lithium, were effective treatment for mood disorders (43). However, we were not aware of any MR study investigating causal relationships between glutamine levels and depression. Herein, we provide evidence for a causal link between lower glutamine levels and depression using MR approaches. LDSR analysis showed consistent evidence for associations between glutamine and depression. Together with these studies, our findings underline the requirement for considering glutaminergic dysfunction in psychiatric research and the clinical potential of glutamine targeting drugs for the treatment of depression.
Our study also provides further evidence of the causal associations between elevated BMI and atypical depressive symptoms, including anhedonia, tiredness, and depressive mood. The underlying biological mechanisms linking obesity and depression may include alterations in systems involved in homeostatic adjustments (hypothalamic-pituitary-adrenal axis, microbiome, immunoinflammatory activation, and neuroendocrine regulation), brain circuitries involved in homeostatic adjustments, and mood regulatory responses (9). Our findings were in accordance with previous 2-sample MR studies focusing on the relationship between BMI and depression (20, 44). These studies used summary statistics of depressive symptoms from nurse-led interviews in the UKB with a sample size less than 117 907 individuals, whereas we obtained depression-related information from touchscreen questionnaires of up to 449 019 participants, which exceeds the sample size of these studies. Moreover, these studies failed to detect a causal effect of depression on BMI. However, epidemiological and MR studies have suggested that atypical-like depressive syndromes predisposed individuals to elevated BMI (45-47). In line with these results, there were some indications that genetically instrumented tiredness could be associated with higher BMI in bidirectional MR. This might be partially explained by the fact that depressed individuals may be less active physically and have worse dietary habits, leading to elevated BMI (48, 49). Intriguingly, in MVMR analysis, BMI showed an attenuated or insignificantly causal effect on depressive symptoms after accounting for circulating glutamine levels, suggesting glutamine may have pleiotropic effects on depression.
We also found that genetically predicted BMI was inversely associated with glutamine levels in periphery blood. These findings are consistent with previous studies that demonstrated that glutamine was decreased, but glutamate was increased, in serum of the obese patients (50-52), and weight-loss interventions were able to reverse the trend (15). The pathway from obesity to decreased glutamine and elevated glutamate may be driven by several potential factors. First, obese individuals displayed lower levels of glutamate-ammonia ligase in adipose tissues. Glutamate-ammonia ligase uses glutamate as a substrate to encode glutamine synthetase, and is the only known glutamine-synthesizing enzyme (13). Moreover, a recent study showed that the gut microbiome may lead to serum metabolome alterations and affect depression (53). Obesity-enriched microbiome tend to produce glutamate from glutamine, hence were associated with higher circulating glutamate levels, but lower glutamine levels (54). Of note, although previous literature showed that oral supplementation with glutamine favors weight loss and improves insulin sensitivity in an obese mouse model (52, 55), our findings did not support a causal effect of higher circulating glutamine on lower BMI. Thus, whether glutamine levels were causally related to obesity needs further investigation.
For the MR analysis with BMI as exposures, we found significant heterogeneity based on the Cochran Q test (Supplementary Table S6) (23). The major cause of heterogeneity is the presence of pleiotropy, which could be detected using the MR-Egger intercept test. We found no significant MR Egger intercepts, indicating that the average pleiotropic effect across all variants is zero and the pleiotropy is balanced (56). In addition to pleiotropy, other factors that could lead to the detection of heterogeneity include each SNV acting on the exposure to produce a different true causal effect, or combining data of 2 cohorts that are not homogeneous (57).
To the best of our knowledge, this study is the first to dissect the associations between glutaminergic metabolism, obesity, and depression. The key strengths of the study include the use of powerful genetic instruments derived from large GWAS data sources while avoiding sample overlap. Also, to improve the reliability of the results, we performed complementary MR sensitivity analyses, as well as LDSR analysis. Compared with MR, LDSR does not provide the directionality of the associations, but evaluates genetic overlap between 2 traits. The LDSR approach has several advantages over MR: LDSR is not biased by sample overlap. It does not require genome-wide significant SNVs or LD pruning, thereby preventing loss of information when causal SNVs are in LD (18). LDSR can provide useful etiological insights and help prioritize likely causal relationships (58). Therefore, we combined LDSR and MR in the present study. These 2 methods complement each other to identify direct causal relations and shared genetic risks for different exposure-outcome pairs.
However, there are some limitations to the present study. First, since all samples in the study were mainly from individuals of European ancestry, the findings, although robust in a European population, should be inferred to other ethnicities with caution. Second, although our analyses of BMI and depression were based on large GWAS data sources, the sample size of summary statistics of glutamine levels was relatively small, limiting the statistical power. Nevertheless, the F statistic for genetic instruments of circulating glutamine levels is 91, much higher than 10, indicating a good strength of used genetic instruments. Furthermore, MR analyses rely on 3 key assumptions: The selected instrumental variables should be strongly associated with the exposure of interest (assumption 1), should not be associated with other confounders (assumption 2), and should influence the outcome only via the exposure (assumption 3) (see Fig. 1) (16). These assumptions are not always met or completely testable. However, we applied complementary sensitivity analysis; MR-Egger and MR-PRESSO detected limited evidence in support of strong pleiotropic effects. In addition, further investigations based on individual data, such as the assessment of gene-environmental interaction and stratification analysis by age and sex, are important but could not be performed in the present MR study. Likewise, the causal mediation analysis using individual data may also provide more evidence for the hypothesis. Larger sample size with longitudinal follow-up cohort study and clinical trials are warranted to complement the results of the MR study.
Conclusion
In summary, by using MR and LDSR approaches, our findings suggest that obesity is causally associated with downregulated glutamine in periphery blood. Moreover, higher BMI and lower glutamine levels could be risk factors for depression. In MVMR analysis, we found that BMI was causally related to depressed mood dependently of glutamine levels. Our findings are clinically relevant because they provide insight into how obesity may affect psychiatry and suggest that weight control and therapy targeting glutamatergic dysfunction may be potential treatments for depression, which provides a novel perspective for the design of clinical trials.
Acknowledgments
We would like to thank all the participants and investigators in the studies.
Financial Support
This work was supported by the National Natural Science Foundation of China (82088102, 81930021, 81970728, 81941017, 82270859, 81970706, 81870560, 91857205, and 82022011), Shanghai Hospital Development Center (SHDC2020CR1001A and SHDC2020CR3064B), and the Shanghai Municipal Education Commission–Gaofeng Clinical Medicine Grant Support (20152508 Round 2). G.N., Y.B., M.X., W.W., T.W., and Y.X. are members of an innovative research team of high-level local universities in Shanghai. The funding sources had no role in the extraction and analysis of the data, design of the study, or any aspect in relation to the study.
Author Contributions
G.N, Y.B, W.W., and M.X. conceived the hypothesis and study design; R.H. and R.Z. analyzed the data and drafted the manuscript; R.H. and R.Z. accessed and verified the data; J.Z. and M.L. participated in data extraction; T.W. and Z.Z interpreted analysis results; R.H, S.W., and H.L. were responsible for data management; J.L., Y.C., and Y.X. reviewed and revised the manuscript. All authors approved the final version of the manuscript. G.N, Y.B., and M.X. were responsible for the decision to submit the manuscript.
Disclosures
The authors have nothing to disclose.
Data Availability
Data can be found in Supplementary Table S1 (23).
References
Abbreviations
- BMI
body mass index
- FDR
false discovery rate
- GWAS
genome-wide association study
- IVW
inverse variance–weighted
- LDSR
linkage disequilibrium score regression
- MDD
major depressive disorder
- MR
mendelian randomization
- MR-PRESSO
MR Pleiotropy RESidual Sum and Outlier
- MR-RAPS
MR using robust adjusted profile score
- MVMR
multivariable mendelian randomization
- PGC
Psychiatric Genomics Consortium
- SNV
single-nucleotide variation
- UKB
UK Biobank
Author notes
Ruixin He and Ruizhi Zheng contributed equally to this work and share first authorship.
