


Abstract
Impairment of immune and inflammatory homeostasis is reported to be one of the causal factors of diabetes. However, the association of complement C3 levels with incident diabetes in humans remains unclear.
This study aimed to examine the association between C3 levels and incident type 2 diabetes mellitus (T2DM), and further explore the potential mediating role of body mass index (BMI) in C3-T2DM associations.
We determined serum C3 levels of 2662 nondiabetic middle-aged and elderly (64.62 ± 7.25 years) individuals from the Dongfeng–Tongji cohort at baseline. Cox regression was employed to examine the incidence of T2DM in relationship to C3 levels during 10 years of follow-up. Mediation analysis was further applied to assess potential effect of BMI on the C3-T2DM associations.
Overall, 711 (26.7%) participants developed T2DM during 23 067 person-years of follow-up. Higher serum C3 was significantly associated with higher risk of incident T2DM after full adjustment (HR [95% CI] = 1.16 [1.05, 1.27]; per SD higher). Compared with the first quartile of C3 levels, the HR in the fourth quartile was 1.52 (95% CI = [1.14, 2.02]; Ptrend = 0.029). Robust significant linear dose-response relationship was observed between C3 levels and BMI (Poverall < 0.001, Pnonlinear = 0.96). Mediation analyses indicated that BMI might mediate 41.0% of the associations between C3 and T2DM.
The present prospective study revealed that C3 could be an early biomarker for incident T2DM, and that BMI might play a potential mediating role in the C3-T2DM associations, which provided clues for the pathogenesis of diabetes.
Diabetes is a leading cause of disability and mortality worldwide (1). Emerging evidence has reported impairment of immune and inflammatory homeostasis as part of the causation of diabetes (2). The complement system, an integral regulator of both the innate and the adaptive immune system, represents a versatile portion of the inflammatory response (3). Besides, strong evidence has indicated the contribution of complement system in the pathogenesis of diabetes (4, 5). Complement C3 is the most abundant complement protein in human serum and plays a vital role in the complement system (3). However, whether C3 is longitudinally related to the risk of diabetes remains to be controversial.
The associations of C3 levels with diabetes (4, 6–13) and prediabetes (14, 15) have been widely reported. Nevertheless, most of the existing prospective studies regarding C3 and incident diabetes were confined to the Swedish Malmö Diet and Cancer Study (MDCS) cohort (8–10) or the Turkish Adult Risk Factor (TARF) cohort (11, 12), and the results were quite unclear. Some studies found C3 to be significantly associated with incident diabetes among total participants (10, 13), among women (12), or at least in the individuals with top quartile of C3 levels (8, 9). Conversely, one of the other studies using the TARF cohort reported no significant relation between C3 and incident diabetes, either among men or women (11). The previous studies were limited by the use of cross-sectional study design (4, 6, 7, 15–17) and relatively limited sample size (16, 17) or older age (17), which might be prone to reverse causation or potential bias. Thus, prospective research with a larger sample size in China is needed.
A large number of population studies reported substantial correlations of C3 levels with body mass index (BMI) (18–21). Rodent studies observed that C3- and C3aR-deficient mice were less likely to gain weight, even on a high-fat diet (22, 23), which might indicate a role for C3 in weight or BMI levels of mammals. According to the Global Report on Diabetes, overweight and obesity are the strongest risk factors for diabetes (1). Therefore, we hypothesized that BMI might link the association between C3 and type 2 diabetes mellitus (T2DM). In the present study, we included 2662 middle-aged and elderly Chinese with 9.82 ± 1.50 years of follow-up to explore the associations between baseline C3 levels and incident T2DM. We further evaluated the potential mediating role of BMI on the C3-T2DM associations.
Materials and Methods
Study Populations
The design, methods, and other details of the Dongfeng–Tongji (DFTJ) cohort have been described elsewhere (24). Briefly, a total of 27 009 subjects were enrolled at baseline in 2008 (a response rate of 87%), with questionnaires completed, physical examinations undergone, and blood specimens provided. The participants were invited to follow-up examinations in 2013 and 2018. In our prior study, we conducted a 1:1 age- and sex-matched nested case-control study of coronary heart disease (CHD) (n = 3242) to explore the prospective associations between plasma metal concentrations and the risk of incident CHD. Cases were those who were free of CHD, stroke, and cancer at baseline but developed CHD during the first follow-up interval (until December 31, 2013). Controls were those who were free of CHD, stroke, and cancer both at baseline and the first follow-up within the DFTJ cohort (25).
Of the 3242 individuals in the nested case-control study, 1605 pairs of participants provided sufficient serum samples for complement component measurement. After excluding 548 individuals who had prevalent T2DM at baseline, the remaining 2662 participants were included in the present analysis (Supplementary Fig. S1 (26)). The study has been approved by the Ethics and Human Subject Committee of the School of Public Health, Tongji Medical College, Huazhong University of Science and Technology, and the Sinopharm Dongfeng General Hospital, the Dongfeng Motor Corporation (DMC). All subjects provided written informed consents.
Laboratory Assays
All subjects were examined in the morning after overnight fasting and 15 mL of fasting blood was drawn from the antecubital vein of seated participants, with 3 vacuum (ethylenediaminetetraacetic acid, EDTA) anticoagulation tubes for plasma; coagulation tubes for serum. Blood samples were centrifuged at 1000 rpm for 10 minutes and aliquots were stored at −80°C. Serum C3 and C4 levels were measured in the same order by ABBOTT ARCHITECT C16000 Fully Automatic Biochemical Analyzer using Complement C3 or C4 Kit (Immunoturbidimetric Assay) (Zhongya, Beijing, China), respectively. The intra- and inter-assay coefficients of variation were, respectively, 9.31% and 2.72% for C3, and 9.28% and 5.29% for C4. The limit of detections (LODs) of C3 and C4 were 0.3 g/L and 0.03 g/L, respectively. Measurements below the LOD were imputed with a value equal to half of the LOD.
Outcomes
The incident T2DM cases were those that occurred after the baseline survey but before December 31, 2018. The diagnosis of T2DM was based on American Diabetes Association (ADA) criteria (27) as meeting any of the following criteria in follow-up interviews or laboratory examinations: (i) self-report of a physician's diagnosis of T2DM; (ii) fasting blood glucose level of ≥ 7.0 mmol/L; (iii) HbA1c level ≥ 6.5%; and (iv) usage of insulin, oral hypoglycemic agent or other diabetes medication. As HbA1c levels were not assayed at baseline, baseline T2DM cases were thereby ascertained according to self-report of a physician's diagnosis of T2DM, fasting blood glucose levels, and usage of diabetic medication. T2DM definitions in the follow-up were based on self-report of a physician's diagnosis of T2DM, fasting blood glucose levels, HbA1c levels, and usage of diabetic medication. A total of 711 (26.7%) incident T2DM cases were diagnosed during the follow-up period to 2018 in the present study.
Covariates
Baseline data were collected by trained interviewers with epidemiological questionnaires during face-to-face interviews, along with medical records, including socio-demographic data (age, sex, education), lifestyles (smoking and drinking status, consumption habits), and past medical histories (hypertension, hyperlipidemia, diabetes). BMI was calculated as weight in kg divided by the square of height in meters. Hypertension was defined as systolic blood pressure (SBP) ≥ 140 mmHg, diastolic blood pressure (DBP) ≥ 90 mmHg, use of antihypertensive medications, or self-reported physician diagnosis. Hyperlipidemia was defined as total cholesterol ≥ 5.72 mmol/L, triglycerides ≥ 1.70 mmol/L, use of lipid-lowering medications, or with self-reported physician diagnosis. Education levels were classified into 3 groups: primary school or below, middle school, and high school or beyond. Blood glucose level was determined using the Glucose Oxidase method by Abbott Aeroset analyzer. Serum C-reactive protein (CRP) was measured by Latex turbidimetric Immunoassay on ABBOTT ARCHITECT C16000 Fully Automatic Biochemical Analyzer using CRP Assay Kit (Abbott, Shanghai, China). The estimated glomerular filtration rate (eGFR) was calculated using the Modification of Diet in Renal Disease (MDRD) Study equation based on Chinese patients with chronic kidney disease (28).
Statistical Analysis
Baseline demographic data and inflammatory markers are summarized by incident T2DM status as means ± SD or median (interquartile range, IQR) for continuous variables unless otherwise stated, and compared by Student t test or Mann–Whitney U tests. Categorical variables were presented in percentages and compared by Chi-square analysis. Person-years were calculated from the recruitment date at baseline to the date of incident T2DM diagnosis, censoring, or December 31, 2018, which came first. Cox proportional hazards regression models were used to calculate hazard ratios (HRs) and 95% CIs for incident T2DM in relation to serum C3 levels. All Cox regression models were stratified by age at risk (in 5-year intervals) (29) and adjusted for potential covariates. We used the macro derived by Desquilbet and Mariotti (30) to fit the restricted cubic spline. Potential confounders were adjusted including age, sex, BMI, serum C4 levels, eGFR, smoking status, drinking status, family history of diabetes, hypertension, hyperlipidemia, education level, physical activity, consumption habits of meat, fish or seafood, milk or dairy products, beans or soy foods, fruits and vegetables, and serum CRP levels. To investigate whether the variate including serum C3 levels can predict the risk of incident T2DM, we performed area under the receiver operating characteristic curve (AUC) and Youden index analysis, and calculated the positive predictive value, negative predictive value, sensitivity, and specificity. The obtained AUC of 2 receiver operating characteristic (ROC) curves was further compared. In addition, prediction model performance was assessed using measures of the net reclassification index (NRI) and the integrated discrimination index (IDI).We also investigated whether the associations differed between younger and elder groups (age at baseline < 65 years, age at baseline ≥ 65 years), male and female, overweight or not (BMI < 24 kg/m2, BMI ≥ 24 kg/m2), ever or never smokers, ever or never drinkers, hypertension or not, hyperlipidemia or not, with or without family history of diabetes, and future disease status of CHD by adding interaction terms between C3 and corresponding stratified variables to the adjusted models. The associations between serum C3 levels and fasting blood glucose levels were evaluated by linear regression. To evaluate the potential mediation effects of BMI on the associations of C3 with incident T2DM, causal mediation analyses among the total population, individuals with C3 < 1.36 g/L (median), and individuals with C3 ≥ 1.36 g/L (median) were conducted to assess the effects with or without adjustments of BMI, and the mediation proportion by using the SAS macro “mediate”. A two-sided P value of <0.05 was considered to be statistically significant. Statistical analysis was performed using the Statistical Analysis System version 9.3 for Windows (SAS Institute Inc., Cary, NC, USA), and R, version 4.0.0 (R core Team, 2020).
Results
Characteristics of the Study Participants
For 2662 participants in this study, the mean ± SD baseline age was 64.62 ± 7.25 years and 48.38% were men (Supplementary Table S1 (26)). During 23 067 person-years of follow-up, we defined 711 incident T2DM cases. Unadjusted baseline characteristics of the T2DM and non-T2DM groups for the total population are summarized in Table 1. Compared with individuals free of T2DM during the follow-up visit, individuals with incident T2DM were more likely to be younger, with higher BMI and C3 levels. Additionally, the prevalence of hypertension and hyperlipidemia were significantly higher for the T2DM participants at baseline. The Spearman correlation coefficient of CRP and C3 in the present study was 0.44 (P < 0.01).
Baseline characteristics of initially nondiabetic individuals with and without diabetes at follow-up (n = 2662)
| Nondiabetes (n = 1951) | Diabetes (n = 711) | P | |
|---|---|---|---|
| Age at baseline | 64.94 ± 7.45 | 63.73 ± 6.58 | 0.0001 |
| Male sex, n (%) | 949 (48.64) | 339 (47.68) | 0.66 |
| BMI (kg/m2) | 23.98 ± 3.26 | 25.65 ± 3.26 | <0.0001 |
| Hypertension, n (%) | 941 (48.23) | 425 (59.77) | <0.0001 |
| Hyperlipidemia, n (%) | 835 (42.80) | 388 (54.57) | <0.0001 |
| Smoking status, n (%) | 0.72 | ||
| ȃCurrent smoker | 401 (20.55) | 136 (19.13) | |
| ȃFormer smoker | 233 (11.94) | 87 (12.24) | |
| ȃNever smoker | 1317 (67.50) | 488 (68.64) | |
| Drinking status, n (%) | 0.12 | ||
| ȃCurrent drinker | 462 (23.68) | 159 (22.36) | |
| ȃFormer drinker | 73 (3.74) | 39 (5.49) | |
| ȃNever drinker | 1416 (72.58) | 513 (72.15) | |
| Education level, n (%) | 0.11 | ||
| ȃPrimary school or below | 630 (32.29) | 224 (31.5) | |
| ȃMiddle school | 679 (34.8) | 277 (38.96) | |
| ȃHigh school or higher | 642 (32.91) | 210 (29.54) | |
| Family history of diabetes, n (%) | 48 (2.46) | 24 (3.38) | 0.24 |
| Future disease status of CHD, n (%) | 940 (48.18) | 286 (40.23) | 0.0003 |
| Physical activity, n (%) | 1753 (89.85) | 629 (88.47) | 0.49 |
| Ethnic Han, n (%) | 1918 (98.31) | 699 (98.31) | 0.26 |
| Fasting blood glucose (mmol/L) | 5.50 ± 0.54 | 5.92 ± 0.63 | <0.0001 |
| eGFR (mL/min/1.73 m2) | 84.56 (73.98, 97.51) | 84.62 (74.29, 97.84) | 0.29 |
| C3 (g/L) | 1.36 ± 0.23 | 1.43 ± 0.23 | <0.0001 |
| C4 (g/L) | 0.31 ± 0.09 | 0.31 ± 0.09 | 0.86 |
| CRP (mg/L) | 1.11 (0.53, 2.34) | 1.38 (0.71, 2.85) | <0.0001 |
| Diet categories (≥ 4 times/week), n (%) | |||
| ȃMeat | 1920 (98.41) | 694 (97.61) | 0.28 |
| ȃFish or seafood | 710 (36.39) | 296 (41.63) | 0.06 |
| ȃMilk or dairy products | 1021 (52.33) | 360 (50.63) | 0.81 |
| ȃBeans or soy foods | 450 (23.07) | 169 (23.77) | 0.32 |
| ȃFruits | 1875 (96.10) | 685 (96.34) | 0.93 |
| ȃVegetables | 1425 (73.04) | 525 (73.84) | 0.79 |
Note: Normally distributed variables were presented as mean ± SD. Non-normally distributed variables were presented as median (IQR). Categorical variables were presented as numbers (percentage).
Abbreviations: BMI, body mass index; eGFR, estimated glomerular filtration rate; C3, the third component of complement; C4, the fourth component of complement. Fasting blood glucose were available for 1850 and 676 individuals in the nondiabetes and diabetes groups, respectively.
Association of Serum C3 Levels With Incident T2DM
After stratification for age band and multivariable adjustment, C3 showed significant associations with higher risk of T2DM (Table 2). Compared with the first quartile of C3 levels, the HR in the fourth quartile was 1.52 (95% CI 1.14, 2.02; Ptrend = 0.029). When C3 was used as a continuous variable, the adjusted HR was 1.22 (95% CI 1.11, 1.34) for incident T2DM after being stratified by age at risk and adjusting for sex, BMI, and C4 levels in model 1. Further adjustment for eGFR, smoking status, drinking status, family history of diabetes, hypertension, hyperlipidemia, education level, and physical activity (model 2) resulted in attenuation, but the associations remained statistically significant. Moreover, these associations slightly weakened after adjusting for consumption habits (model 3), and CRP levels (model 4) with HR converging to 1.16 (95% CI 1.05, 1.27) in the full adjustments. The restricted cubic splines demonstrated significant linear relations of serum C3 levels with incident T2DM (Poverall = 0.003, Pnonlinear = 0.27) (Fig. 1). Further subgroup analyses showed that there were no obvious differences in associations between C3 levels and incident T2DM according to strata of age, sex, BMI, smoking status, drinking status, hypertension, hyperlipidemia, family history of diabetes, and future disease status of CHD (Fig. 2). The AUCs were 0.628 (0.604, 0.651) and 0.609 (0.585, 0.632) for models with and without C3 levels respectively (Supplementary Fig. S2A (26)). There was significant difference between AUCs for ROCs with and without C3 (P = 0.01). The integrated discrimination index and net reclassification index were 1.36% (P < 0.001) and 20.98% (P < 0.001). Youden index analysis showed that the optimal cutoff value for serum C3 level was 1.37 g/L, with the sensitivity and specificity equal to 59.6% and 59.5%, respectively (Supplementary Fig. S2B (26)). The positive predictive value was 30.66% and the negative predictive value was 77.56% (Supplementary Fig. S2C (26)). No significant interaction was observed between C3 and the stratified variables in relation to T2DM risk. Furthermore, serum C3 levels were positively and significantly associated with fasting blood glucose at baseline, also after adjustment for possible confounding factors (Supplementary Table S2 (26)). Moreover, the association of serum C3 and fasting blood glucose was stronger among individuals who were at the risk of T2DM than the association among individuals who were free of T2DM in the following 10 years (Supplementary Table S2 (26)).
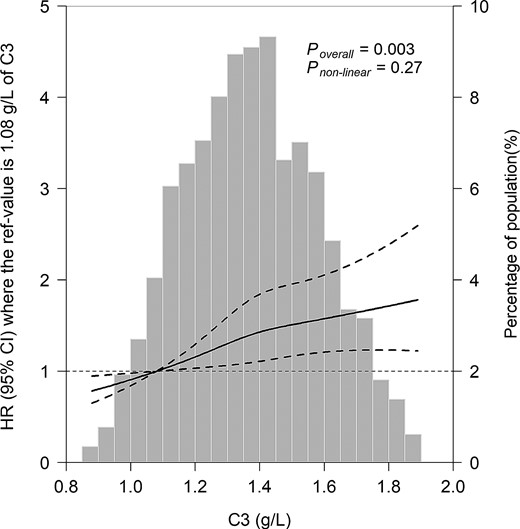
The associations of serum C3 levels with the risk of diabetes. Data were fitted using Cox regression models of the restricted cubic spline with 3 knots at 25th, 50th, and 75th percentiles of serum C3. The reference point was the 10th of the C3 (1.08 g/L). The values outside the 1st and 99th percentiles were excluded in the plots. The solid line represents point estimation on the association of C3 with the risk of diabetes, and the dashed line represents 95% CI estimation. Covariates in the models were collected at baseline, included age, sex, BMI, serum C4 level, eGFR, smoking status, drinking status, family history of diabetes, hypertension, hyperlipidemia, education level, and physical activity.
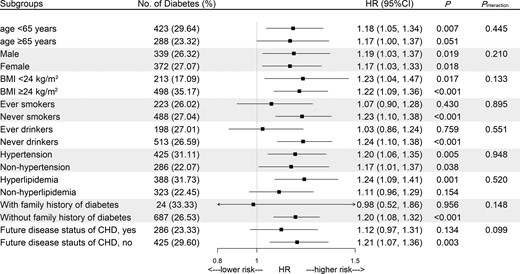
Stratified analysis for the associations between serum C3 levels and incident diabetes. Squares represent HRs (per SD) for diabetes risk, horizontal lines represent 95% CIs. Models were stratified by age at risk (5-year bands), and adjusted for sex, BMI, serum C4 level, eGFR, smoking status, drinking status, family history of diabetes, hypertension, hyperlipidemia, education level, and physical activity, except for the stratified variables.
Incidence and HRs of T2DM at follow-up in quartiles of C3 at baseline
| C3 (g/L) | Ptrend | HR (95% CI) per SD | Pinteraction | ||||
|---|---|---|---|---|---|---|---|
| Q1 < 1.20 | Q2 1.20∼1.36 | Q3 1.36∼1.52 | Q4 ≥ 1.52 | ||||
| No. observations | 576 | 655 | 687 | 744 | |||
| Case/person-years | 99/5145 | 177/5697 | 192/5894 | 243/6332 | |||
| ȃModel 1 | 1.00 (ref) | 1.52 (1.18, 1.96) | 1.57 (1.21, 2.03) | 1.74 (1.32, 2.28) | <0.001 | 1.22 (1.11, 1.34) | 0.119 |
| ȃModel 2 | 1.00 (ref) | 1.50 (1.16, 1.93) | 1.48 (1.14, 1.92) | 1.58 (1.19, 2.10) | 0.011 | 1.18 (1.07, 1.30) | 0.133 |
| ȃModel 3 | 1.00 (ref) | 1.52 (1.18, 1.96) | 1.50 (1.15, 1.96) | 1.57 (1.18, 2.09) | 0.014 | 1.17 (1.07, 1.29) | 0.128 |
| ȃModel 4 | 1.00 (ref) | 1.51 (1.17, 1.95) | 1.49 (1.14, 1.94) | 1.52 (1.14, 2.02) | 0.029 | 1.16 (1.05, 1.27) | 0.109 |
Model 1: stratified by age at risk (5-year bands), and adjusted for sex, BMI, C4.
Model 2: adjusted as in model 1 plus eGFR, smoking status, drinking status, family history of diabetes, hypertension, hyperlipidemia, education level, and physical activity.
Model 3: adjusted as in model 2 plus consumption habits of meat, fish or seafood, milk or dairy products, beans or soy foods, fruits, and vegetables (<1 time/week, 1-4 times/week, and ≥4 times/week).
Model 4: adjusted as in model 3 plus CRP.
Ptrend across quartiles of C3 were obtained by including the median of each quartile as continuous variables in cox regression models.
Pinteraction were calculated by including the product term of the C3 levels with BMI in the multivariable-adjusted model.
Association of Serum C3 Levels With BMI
In Fig. 3, restricted cubic spline analyses were performed to visualize the dose-response relation between serum C3 levels and BMI. We observed robust linear associations between C3 and BMI (all Poverall < 0.001; Pnonlinear = 0.96, Pnonlinear = 0.46, Pnonlinear = 0.72 for total population, participants with T2DM and without T2DM in the follow-up, respectively).
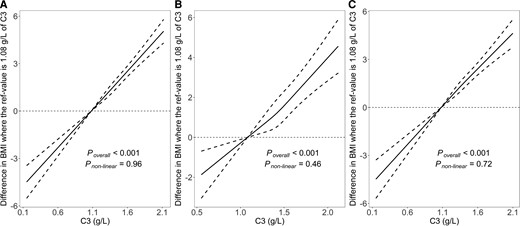
The associations of serum C3 levels with BMI. A, for total population; B, for participants with diabetes in the follow-up; C, for participants without diabetes in the follow-up. Data were fitted using linear regression models of the restricted cubic spline with 3 knots at 25th, 50th, and 75th percentiles of serum C3. The reference point was 10th of the C3 (1.08 g/L). The solid line represents point estimation on the association of C3 levels with BMI, and the dashed line represents 95% CI estimation. Covariates in the models were collected at baseline, included age, sex, serum C4 level, eGFR, smoking status, drinking status, family history of diabetes, hypertension, hyperlipidemia, education level, and physical activity.
Association of BMI With Incident T2DM
BMI was significantly associated with the risk of T2DM (Poverall < 0.001; Pnonlinear = 0.01) (Supplementary Fig. S3 (26)). The HRs of BMI and incident T2DM were relatively larger for participants with C3 < 1.36 g/L than participants with C3 ≥ 1.36 g/L. The spline regression analysis demonstrated linear relations for BMI and incident T2DM (all Poverall < 0.001; Pnonlinear = 0.11, Pnonlinear = 0.10 for participants with C3 < 1.36 g/L and with C3 ≥ 1.36 g/L, respectively).
The Mediating Role of BMI in the Associations Between C3 and Incident T2DM
As shown in Fig. 4, after controlling for various confounders, significant mediation was observed for the association between C3 and incident T2DM (the proportion mediated was 41.0%). Interestingly, when participants were stratified by median of C3 (1.36 g/L), the proportion mediated by BMI was 29.1% among individuals with C3 < 1.36 g/L and 39.2% among participants with C3 ≥ 1.36 g/L.
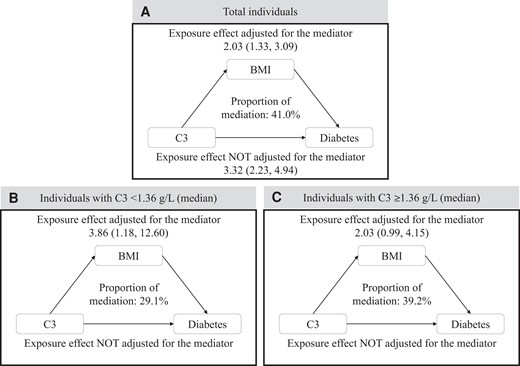
Mediation effects of BMI on the associations of C3 with diabetes. Adjusted for age, sex, serum C4 level, eGFR, smoking status, drinking status, family history of diabetes, hypertension, hyperlipidemia, education level, and physical activity. Note: The mediation analyses were carried out by the SAS macro “mediate”.
Discussion
To our best knowledge, this is the first longitudinal study to evaluate the associations of serum C3 levels with incident T2DM in Chinese population. In the present study, we observed robust associations between C3 levels and T2DM and revealed that BMI may partially mediate the association between higher C3 levels and T2DM risk increment. The findings provided support for the role of complement in diabetic risks and offered clues for the underlying mechanisms involving BMI.
Existing prospective epidemiologic studies investigating the association between C3 levels and the risk of diabetes were relatively few (8–13), and the results were relatively inconclusive. Most of the previous studies were mainly confined to Swedish (8–10) or Turks (11, 12). Both studies within the Malmö Diet and Cancer Study cohort and the CODAM cohort demonstrated that elevated C3 levels were associated with increased risks of diabetes (10, 13). C3 level was shown to be a stronger marker of diabetes than multiple other acute-phase proteins (8, 9, 31) or at least slightly improved the integrated discrimination index (32). However, significant associations between C3 and incident diabetes were found in participants with top quartile of C3 levels only (8, 9). Moreover, 2 prospective studies from the TARF cohort revealed different results (11, 12). One study with 3.3 years of follow-up reported no significant associations of C3 levels with incident diabetes (11). The other one with 7.3 years of follow-up observed significant relations, but only among women (12). The discrepancy of the above prospective studies could be explained by the various study populations with different ages, sex (8), different adjustment of confounding factors (10), follow-up time (8, 11–13), and sample size (11–13). The findings from prior cross-sectional studies regarding the relations of C3 with diabetes were also quite different (4, 6, 7, 16, 17).
In the present prospective study, we revealed that serum C3 levels were associated with incident T2DM among 2662 middle-aged and elderly Chinese during 10 years of follow-up. Similar relations remained in the stratified analysis, indicating the robustness of our findings. The observed high AUCs of ROC with serum C3 levels implied C3 as the potential predictor of the risk of T2DM. Serum C3 level at 1.37 g/L had a sensitivity of 59.6% and a specificity of 59.5%; we considered these levels as a reasonable cutoff for further analyses. Several potential mechanisms could be involved in the findings. System low-grade inflammation with the upregulation and activation of cytokines might explain some of the connections (33, 34). Another putative link could be due to C3a desArg or acylation stimulating factor (ASP), the proteolytic fragment of C3, which is a paracrine metabolic factor with the function of stimulating glucose uptake and lipid storage in adipose tissue, and thus facilitate diabetes development (2, 35). The C3-dependent immune response may also involve in the hepatic dysfunction (36), which is related to hyperglycemia (2, 37). The prominent relationship between C3 and incident diabetes demonstrated that the C3-dependent immune response might play vital roles in the progression of diabetes. Serum C3 levels could be considered as a surrogate biomarker taken into account in the diabetic risk and may represent a new field for intervention in the prevention of diabetes.
The substantial association between C3 and BMI was in accordance with previous research (8, 19–21, 38), and has been widely described. A prospective cohort study observed that higher baseline level of C3 was associated with more adiposity (20), and that greater changes in C3 were positively associated with greater changes in BMI and waist circumference (20). Moreover, rodent studies also revealed that C3- and C3aR-deficient mice were less likely to gain weight, even on a high-fat diet (22, 23), indicating a potential effect of C3 on weight or BMI levels of mammals. The positive relations of C3 and BMI implied a reasonably large correlation coefficient ranging from 0.23 to 0.32 (8, 38), which exists both in the obese group and nonobese group (19). While the correlation was relatively less clear in the nonobese group (19). Of note, comparable indexes, including obesity (17, 19, 39), body fat (21, 38, 40), and waist circumference (21, 38, 40), were reported to be associated with C3 levels in epidemiological studies. Previous studies have shown strong associations between C3 and obesity in the school children (41), young (38), middle-aged (39), elderly (19) populations, and even centenarians with a median age of 102 (100, 115) years (17), respectively, suggesting the relations were independent to age. Restrict cubic spline of C3 and BMI with full adjustments in our study were in line with the aforesaid results, indicating a linear relationship, which maintained significant both in the later T2DM group and non-T2DM group respectively. A possible pathophysiological link might be the C3-C3a-C3adesArg/ASP axis, the pathway would contribute to lipid accumulation and adipocyte differentiation (20). Activation of the C3-C3a-C3adesArg/ASP axis starts by cleavage of C3, and C3a-C3adesArg/ASP may contribute to body fat storage via promotion of the uptake adipocyte fatty acid by adipocytes and stimulation of triglyceride synthesis (42). In addition, chylomicrons, produced upon food ingestion, could activate C3-C3a-C3adesArg/ASP axis, and as such promote the development of high-fat–diet-induced obesity (43).
Consistent with our findings, prior studies have long acknowledged and firmly established BMI as an indispensable causal risk factor of diabetes (44–46). It is interesting that the impact of BMI on incident diabetes was relatively more emphatic among individuals with C3 levels < 1.36 g/L (median) than those with C3 levels ≥ 1.36 g/L. The probable reason might be the overlap of C3-related and BMI-related insulin resistance, and therefore it partially conceals the effects of BMI.
In the present study, we further evaluated the potential role of BMI in the positive association between C3 levels and incident diabetes. The results indicated that BMI may mediate approximately 41.0% of the C3-T2DM pathogenesis. As mentioned above, it is reasonable to assume that a higher C3 level might make for higher BMI, thus further contributing to an increased risk of diabetes. Several possible mechanisms could be involved in the mediating role of BMI. It is plausible that complement activation is involved in adipose tissue function and homeostasis, which has been denoted by a growing body of evidence (20). Another speculation was involved in insulin resistance. It is well known that diabetes could be caused by a relative lack of insulin (33, 47), and that central adiposity is strongly associated with insulin resistance (19). Components of the complement system, especially C3, play crucial roles in causing insulin resistance (13, 33, 39, 40). Altogether, these known mechanisms make for the hypothesis that elevated C3 and higher BMI may jointly induce the progression of insulin resistance and eventually lead to diabetes. Intriguingly, when participants were divided by C3 < 1.36 g/L (median) and C3 ≥ 1.36 g/L (median), the proportion of mediation became 29.1% and 39.2%, respectively. Aforesaid results indicated a pronounced BMI-diabetes association among individuals with C3 < 1.36 g/L, and the prior evidence has well established a sharply increased prevalence of diabetes with BMI (47). Hence, it is reasonable to observe a lower proportion of BMI mediation among participants with C3 < 1.36 g/L. More than 20 therapeutic agents targeting distinct components and effector pathways of the complement cascade have been in clinical development for various indications (48). The study implies the possibility to be treated through complement-targeted intervention. These results provided epidemiological evidence that the complement may play a role in the progression of diabetes, implied the potential role of BMI in complement-targeted intervention, and offered clues for further research on the pathological pathways.
Our study was the first prospective study to examine the associations of serum C3 levels with incident T2DM in a Chinese middle-aged and elderly population. We further evaluated the mediating role of BMI in the associations. Other strengths of the current study include a general population of both sexes; fairly complete information with the availability of adjustments for relevant confounders. However, some limitations should also be noted. Firstly, we only measured total C3 levels at baseline and did not measure its activated compound C3a, which precluded us to investigate the longitudinal complement levels and complement activation. Nevertheless, desarginated C3a has paracrine rather than endocrine functions, and circulating C3 levels could also represent the potential for complement activation (49). Secondly, the use of BMI is approximately equal to, but still less authentic than body fat to represent adiposity. Thirdly, since 2-hour glucose concentrations during an oral glucose tolerance test were not used for the diagnosis of T2DM, this study may not have captured the entirety of individuals with T2DM. Furthermore, the population in the present study was derived from a CHD nested case-control study, which might potentially limit generalizability. However, the consistent results of the stratified analyses indicate the robustness of our findings.
In conclusion, we observed robust associations between C3 levels and incident T2DM. Our study also revealed a potential mediating role of BMI in the association between C3 levels and incident T2DM. The observations could be interpreted as evidence of complement in diabetes development, and they may prompt further studies to address the precise pathogenesis of complement as well as the potential therapeutic targets. The findings suggest that BMI may play an important role in the C3-diabetes associations, which warrants extensive replication in other studies with large populations and demonstration in biological experiments.
Acknowledgments
We are thankful to all the study participants, researchers, and students for the substantial time and effort they spent in contributing to our study.
Funding
Funding to support this analysis was provided by grants from the National Natural Science Foundation of China (82021005), the Foundation of the National Key Research and Development Program of China (2016YFC0900800).
Author Contributions
J.J. performed the analysis, interpreted the data, and drafted the manuscript. J.J., S.Q.H., Z.Y.L., and J.W. contributed to the data collection. H.W., K.L., Y.Y., K.Y., P.P.L., T.Y.D., X.M.Z., M.A.H., and H.G. revised the article critically for important intellectual content. All authors approved the final version of the manuscript to be published. T.C.W. is responsible for the integrity of the work as a whole.
Disclosure
The authors have nothing to disclose.
Data Availability
The datasets generated during and/or analyzed during the current study are available from the corresponding author on reasonable request.
Authors' Relationships and Activities
The authors declare that there are no relationships or activities that might bias, or be perceived to bias, their work.
References
Abbreviations
- ASP
acylation stimulating factor
- AUC
area under the ROC curve
- BMI
body mass index
- CHD
coronary heart disease
- CRP
C-reactive protein
- eGFR
estimated glomerular filtration rate
- HR
hazard ratio
- LOD
limit of detection
- ROC
receiver operating characteristic
- T2DM
type 2 diabetes
- TARF
Turkish Adult Risk Factor cohort
