


Abstract
Laparoscopic sleeve gastrectomy (LSG), now the most commonly performed bariatric operation, is a highly effective treatment for obesity. While Roux-en-Y gastric bypass is known to impair intestinal fractional calcium absorption (FCA) and negatively affect bone metabolism, LSG's effects on calcium homeostasis and bone health have not been well characterized.
We determined the effect of LSG on FCA, while maintaining robust 25-hydroxyvitamin D (25OHD) levels and recommended calcium intake.
Prospective pre-post observational cohort study of 35 women and men with severe obesity undergoing LSG.
FCA was measured preoperatively and 6 months postoperatively with a gold-standard dual stable isotope method. Other measures included calciotropic hormones, bone turnover markers, and bone mineral density (BMD) by dual-energy X-ray absorptiometry and quantitative computed tomography.
Mean ± SD FCA decreased from 31.4 ± 15.4% preoperatively to 16.1 ± 12.3% postoperatively (P < 0.01), while median (interquartile range) 25OHD levels were 39 (32-46) ng/mL and 36 (30-46) ng/mL, respectively. Concurrently, median 1,25-dihydroxyvitamin D level increased from 60 (50-82) pg/mL to 86 (72-107) pg/mL (P < 0.01), without significant changes in parathyroid hormone or 24-hour urinary calcium levels. Bone turnover marker levels increased substantially, and areal BMD decreased at the proximal femur. Those with lower postoperative FCA had greater areal BMD loss at the total hip (ρ = 0.45, P < 0.01).
FCA decreases after LSG, with a concurrent rise in bone turnover marker levels and decline in BMD, despite robust 25OHD levels and with recommended calcium intake. Decline in FCA could contribute to negative skeletal effects following LSG.
Obesity is a complex chronic condition that impacts 42% of US adults, with 9% of US adults classified as having severe or Class 3 obesity [body mass index (BMI) ≥ 40 kg/m2] (1). Obesity is associated with increased mortality due to its link to chronic diseases including diabetes, hypertension, dyslipidemia, coronary heart disease, osteoarthritis, and sleep apnea (2). Because nonsurgical approaches often fail to produce weight loss of the magnitude required in severe obesity, bariatric surgery has become an established weight management strategy. Bariatric surgery results in marked and durable weight loss, improves obesity-associated comorbidities, and decreases mortality (3, 4).
Roux-en-Y gastric bypass (RYGB) has been considered the gold-standard bariatric procedure due to its robust weight loss outcomes and metabolic benefits. However, RYGB has been shown clearly to have detrimental effects on calcium homeostasis and skeletal health, with increases in bone turnover, decreases in bone mineral density (BMD), weakened bone microarchitecture, and increased fracture incidence (5–14). These effects appear to be mediated in part by a striking decline in intestinal calcium absorption capacity (15–17), reflecting impedance of active transcellular absorption when the proximal intestine no longer receives nutrient flow, and a failure of the distal intestine to compensate.
Laparoscopic sleeve gastrectomy (LSG) is a newer and technically less complex bariatric surgical procedure that has been performed more often than RYGB for weight loss in the United States and worldwide since approximately 2013 to 2014 (18, 19). LSG involves removing 60% to 80% of the greater curvature of the stomach using minimally invasive surgical techniques (laparoscopy) to staple from approximately 6 cm proximal to the pylorus to about 1 cm below the gastroesophageal junction. This procedure does not involve intestinal bypass or rearrangement, as RYGB does. Its rise in surgeon and patient preference is largely due to lower peri- and postoperative mortality and complication rates (4, 20). However, LSG's effects on calcium homeostasis and skeletal health remain poorly understood. On the one hand, the intact uninterrupted intestine would suggest unimpeded calcium and vitamin D absorption and thus a smaller impact on nutritional deficiencies and calcium homeostasis. Indeed, the available literature suggests that loss of bone mass may be less than that observed following RYGB (21–24). On the other hand, factors known to influence calcium absorption, such as BMI and macronutrient intake, do change markedly after LSG with similar magnitudes to RYGB (25–27).
The aim of this study was to determine the effects of LSG on intestinal fractional calcium absorption (FCA) in a cohort of pre- and postmenopausal women and men with severe obesity, in the setting of optimized 25-hydroxyvitamin D (25OHD) status and recommended calcium intake. We hypothesized that FCA does decline postoperatively—but modestly—after LSG.
Materials and Methods
Study Design and Population
The study was a pre-post prospective observational cohort study of 35 women and men ages 24 to 70 years with severe obesity undergoing LSG. Participants were recruited from an academic bariatric surgery center (University of California, San Francisco). Eligibility for LSG at our institution was in accordance with the 1991 National Institutes of Health consensus conference (BMI ≥ 40 kg/m2 or ≥ 35 kg/m2 with obesity-related comorbid conditions) (28), with the additional requirement of failure to lose weight with medical management. Perimenopausal women, defined as last menses > 3 months but < 4 years ago, were excluded due to dynamic estradiol levels and accelerated bone loss. Other exclusion criteria included history of intestinal malabsorption or prior bariatric surgery, use of medications known to impact bone and mineral metabolism (eg, osteoporosis pharmacotherapy, glucocorticoids, thiazolidinediones, aromatase inhibitors, androgen deprivation therapy), diseases known to affect bone (eg, primary hyperparathyroidism, Paget's disease, hyperthyroidism defined by thyroid stimulating hormone < 0.1 mIU/L, clinically significant liver disease), illicit drug use or alcohol use > 3 drinks/day, hypercalcemia (serum calcium > 10.2 mg/dL), chronic kidney disease stage 4 or lower [estimated glomerular filtration rate (eGFR) < 30 mL/min/1.73 m2], and weight > 200 kg [weight limit of the dual-energy X-ray absorptiometry (DXA) scanner]. Premenopausal women on stable hormonal contraception, postmenopausal women on stable menopausal hormone therapy, and men on stable testosterone therapy were eligible. Participants underwent study measurements preoperatively (no more than 3 months before the LSG) and 6 months postoperatively.
Protocol approval was obtained from the Institutional Review Board at the University of California, San Francisco. Written informed consent was obtained from all participants. The study was registered at the US National Institutes of Health (ClinicalTrials.gov, NCT02778490).
Calcium and Vitamin D Supplementation
Calcium and vitamin D supplements were provided upon enrollment and throughout the study period. Participants took an individualized dose of chewable calcium citrate supplement, designed to achieve a total calcium intake of approximately 1200 mg/day based on results from a validated dietary calcium intake screener (29). Vitamin D supplements were dosed individually to achieve and maintain a target level of 25OHD levels ≥ 30 ng/mL. Participants were started on these supplements at least 2 weeks prior to the preoperative study measurements including FCA, so that the preoperative measurements would reflect the target intakes and vitamin D status. Dietary calcium intake and 25OHD levels were monitored throughout the study period, and supplements were adjusted.
Study Measures
Fractional calcium absorption
Dual calcium isotopic tracers were used to determine FCA preoperatively and at 6 months postoperatively. One stable calcium isotope was administered orally to label dietary calcium uptake and the other intravenously (IV) to measure calcium removal from the blood (30). After an overnight fast, each participant consumed a 10 mg dose of oral 44Ca as enriched calcium carbonate in a capsule halfway through a standardized test meal consisting of soy milk mixed with instant breakfast powder. Although the standardized test meal was designed to provide a total of 300 mg calcium, variations in consumer nutritional labeling prompted us to analyze the test meal at a commercial laboratory (Covance Food Solutions, Livermore, CA, USA). We found that the median [interquartile range (IQR)] calcium content was 470 (438-489) mg. Preparation of the meal was identical for the preoperative and postoperative tests, and all participants consumed all of each meal. A 3 mg dose of 43Ca as enriched calcium carbonate was infused IV 1 hour after the oral dose. A serum sample was collected 24 hours after dual-isotope administration when orally and IV-administered calcium isotopes track identically in the blood (31). A 24-hour urine was also collected starting at the time of isotope administration for confirmatory data. Serum and urine were frozen and sent to the University of Wisconsin-Madison State Laboratory of Hygiene for batched measurement of calcium isotope ratios (43Ca/42Ca and 44Ca/42Ca) using high-resolution, single-collector inductively coupled plasma mass spectrometry [magnetic sector inductively coupled plasma mass spectrometry (ICP-MS), Element 2 XR, Thermo Fischer Scientific Inc., Waltham, MA]. Selected serum samples were also analyzed using multicollector ICP-MS (Neptune Plus; Thermo Fisher Scientific) for enhanced precision. Each participant sample was analyzed on at least 2 separate runs, and the average of these values is used. Reference standards (High Purity Standards Calcium) were placed throughout the analytical sequence to normalize all ratio data. Typical external precision for both reference standards and participant samples was 0.2% to 0.4% with magnetic sector ICP-MS and 0.002% to 0.005% with multicollector ICP-MS for both 43Ca/42Ca and 44Ca/42Ca ratios. Total calcium concentrations in the serum and urine samples were determined by inductively coupled plasma optical emission spectroscopy (ICP-OES) using a Perkin Elmer Optima 5300 DV ICP-OES configured with an ESI SC2 DX FAST sample change. Uncertainty in the ICP-OES total calcium data averaged 1.4% relative SD. FCA was calculated using ratios of the calcium isotopes and the dose of each isotope (32).
Biochemical markers of bone turnover and calciotropic hormones
Serum collected after an overnight fast was analyzed immediately for calcium, albumin, phosphate, 25OHD, and parathyroid hormone (PTH), and 24-hour urine collections were sent for calcium and creatinine measurements at a commercial laboratory (Quest Diagnostics, Secaucus, NJ, USA). The remaining serum samples were frozen at −80 °C until batch analyzed in a central laboratory (Maine Medical Center Research Institute, Scarborough, ME, USA) for the following: serum C-terminal cross-linked telopeptide (CTx; a marker of bone resorption), procollagen type 1 N-terminal propeptide (P1NP; a marker of bone formation), 1,25-dihydroxyvitamin D (1,25[OH]2D), insulin-like growth factor-1 (IGF-1), total estradiol, adiponectin, and leptin. Serum CTx, P1NP, 1,25(OH)2D, and IGF-1 were measured by chemiluminescence on an auto-analyzer (iSYS, Immunodiagnostic Systems, Scottsdale, AZ, USA). The inter- and intra-assay coefficients of variation (CV) were 6.0% and 3.2% for CTx, 5.0% and 2.9% for P1NP, 11.1% and 6.4% for 1,25(OH)2D, and 5.0% and 2.16% for IGF-1. Total estradiol was measured by enzyme-linked immunosorbent assay (ELISA) (ALPCO Diagnostics, Salem, NH, USA), with inter- and intra-assay CV of 9.0% and 7.7%. The adipokine adiponectin was measured by ELISA (EMD Millipore, Burlington, MA, USA), and leptin was measured by ELISA (R&D Systems, Minneapolis, MN, USA). The inter- and intra-assay CV were 6.0% and 3.4% for adiponectin and 4.0% and 3.2% for leptin.
Dietary intakes, body composition, and bone mineral density
Habitual dietary intakes were assessed preoperatively and 6 months postoperatively using the comprehensive Block Food Frequency Questionnaire (33). Weight and height were measured, and BMI (kg/m2) was calculated at each timepoint. Waist circumference was measured at the level directly below the lowest rib, and hip circumference at the maximum extension of the buttocks, viewed from the side. Areal bone mineral density (BMD) at the lumbar spine, proximal femur, and radius were measured using DXA (Horizon A, Hologic). With whole-body DXA, we also estimated total and regional body composition (34). If the body dimensions exceeded the width of the scanning area, the DXA manufacturer's reflection technique was utilized. Spinal volumetric BMD (vBMD, g/cm3) was assessed by quantitative computed tomography at the L3 and L4 vertebrae at 120 kVp, 200 mAs (General Electric's VCT64 scanner; General Electric, Milwaukee, WI, USA) and was analyzed according to methods as previously described (Mindways Software, Austin, TX, USA) (35, 36). Abdominal visceral fat area was also measured by quantitative computed tomography imaging using a 10-mm cross-section through the L4/L5 intervertebral space at 120 kVp, 300 mAs. The visceral fat compartment was manually traced along the fascial plane defining the internal abdominal wall and was calculated using a specialized software (University of California, San Francisco, CA, USA) (37, 38).
Statistical Methods
Sample size calculations for this study were based on the mean changes, SDs, and covariance parameters identified in our previous pre-post gastric bypass cohort study (16), which had comparable study population, study protocol, and measurements. We calculated that a sample of 35 participants would provide 80% power in 2-sided tests with α = 0.05 to detect an absolute reduction in fractional calcium absorption after LSG as small as 8%. This is much smaller than the absolute decline in FCA of 26% observed in our gastric bypass cohort (16).
Baseline descriptive data were reported as means ± SD, median (IQR), or proportions [n (%)]. Spearman's rank correlation was used to characterize the relationships between baseline FCA and other study parameters. Paired t-test or Wilcoxon signed-rank tests were performed as appropriate to determine whether there was a change in FCA and other study parameters between preoperative and 6-month postoperative timepoints. Significance level was defined as 2-sided P-value < 0.05 and confidence intervals at 95%. Spearman's correlation test was employed to assess the relationships between the change in FCA and changes in other study measures to explore potential factors that might influence the degree of FCA changes after LSG. We also evaluated the relationships between the postoperative FCA and changes in other study measures. Spearman's partial correlation was performed, and linear models were built, to evaluate adjusted associations. Although multiple comparisons were examined, no formal adjustments were made. Instead, we interpreted the magnitude and direction of estimated effects in light of the relevant biology to avoid overinterpretation of isolated findings of normal statistical significance. All statistical analyses were done using SAS software (version 9.4; SAS Institute Inc., Cary, North Carolina, USA), and figures were generated using R (version 4.0.3).
Results
Baseline Participant Characteristics
Preoperatively, mean age was 45.6 ± 11.4 years, weight was 118.9 ± 17.4 kg, and BMI was 43.7 ± 6.2 kg/m2 (Table 1). Of the 35 participants, 30 (86%) were women with 11 (37%) of those postmenopausal and 19 (63%) premenopausal. Upon initial enrollment, mean 25OHD level was 26 ± 11 ng/mL. With vitamin D repletion, mean 25OHD rose to 39 ± 11 ng/mL at the time of preoperative study measurements. Mean serum calcium, PTH, 1,25(OH)2D, serum creatinine, and eGFR were within their reference ranges. Median 24-hour urinary calcium level was 187 (IQR 85-268) mg/24 hours. Two of the 11 postmenopausal women and 2 of the 3 men ≥ 50 years old had an areal BMD T-score between −1.0 to −2.4 at any site preoperatively. None had a T-score ≤ −2.5. None of the premenopausal women or men < 50 years old had an areal BMD Z-score ≤ −2.0. Of the premenopausal women, 2 (11%) were on stable and long-term combined oral contraceptives, and 1 (5%) was on medroxyprogesterone injection; of the postmenopausal women, 1 (9%) was on stable menopausal hormone therapy. Oral contraceptives and menopausal hormone therapy were subsequently stopped after LSG.
Baseline characteristics
| n = 35 | |
| Age, years | 45.6 ± 11.4 |
| Women, n (%) | 30 (86) |
| ȃPremenopausal | 19 (63) |
| ȃPostmenopausal | 11 (37) |
| Race, n (%) | |
| ȃWhite | 27 (77) |
| ȃBlack/African American | 7 (20) |
| ȃMore than one race | 1 (3) |
| Ethnicity, n (%) | |
| ȃHispanic/Latinx | 5 (14) |
| Weight, kg | 118.9 ± 17.4 |
| BMI, kg/m2 | 43.7 ± 6.2 |
| Percent body fat (%) | 43.7 ± 4.5 |
| Waist circumference (cm) | 116.7 ± 11.1 |
| Waist-hip ratio | 0.87 ± 0.10 |
| Diabetes, n (%) | 5 (14) |
| PPI use, n (%) | 8 (23) |
| FCA, % | 31.4 ± 15.4 |
| Serum calcium, mg/dL | 9.2 ± 0.3 |
| Albumin, g/dL | 4.0 ± 0.3 |
| 25OHD upon enrollment, ng/mL | 26 ± 11 |
| 25OHD at preop visit, ng/mL | 39 ± 11 |
| PTH, pg/mL | 39 ± 18 |
| 1,25(OH)2D, pg/mL | 68 ± 28 |
| CTx, ng/mL | 0.19 (0.11-0.28) |
| P1NP, ng/mL | 41.2 (34.9-62.6) |
| Creatinine, mg/dL | 0.77 ± 0.19 |
| eGFR, mL/min/1.73 m2 | 100 ± 19 |
| Phosphorus, mg/dL | 3.6 ± 0.5 |
| Urine calcium, mg/24 hours | 187 (85-268) |
| Areal BMD, g/cm2 | |
| ȃLumbar spine | 1.108 ± 0.130 |
| ȃTotal hip | 1.084 ± 0.121 |
| ȃFemoral neck | 0.907 ± 0.125 |
| Volumetric BMD, g/cm3 | |
| ȃLumbar spine | 0.164 ± 0.038 |
Values are means ± SDs, median (interquartile range), or count (percentage).
95% reference intervals provided by the test manufacturers: PTH, 11.5 to 78.4 pg/mL; CTx, 0.142 to 1.351 ng/mL (postmenopausal women); P1NP, 27.7 to 127.6 ng/mL; 1,25(OH)2D, 15.2 to 90.1 pg/mL.
Abbreviations: 1,25(OH)2D, 1,25-dihydroxyvitamin D; 25OHD, 25-hydroxyvitamin D; BMD, bone mineral density; BMD, bone mineral density; BMI, body mass index; CTx, collagen type 1 C-telopeptide; eGFR, estimated glomerular filtration rate; FCA, fractional calcium absorption; P1NP, procollagen 1 intact N-terminal propeptide; PPI, proton pump inhibitor; PTH, intact parathyroid hormone.
Mean baseline FCA was 31.4 ± 15.4%. Baseline FCA level was negatively correlated with bone turnover marker levels (CTx: ρ = −0.44, P < 0.01; P1NP: ρ = −0.45, P < 0.01); that is, those with lower FCA had higher CTx and P1NP levels. After adjustment for age, sex, and menopause status, the associations remained significant (CTx: ρpartial = −0.42, P = 0.02; P1NP: ρpartial = −0.39, P = 0.03). Preoperative FCA level was not correlated with age, weight/BMI, sex, menopausal status, dietary intakes of macronutrients (total calories, protein, fat, carbohydrate, fibers) or micronutrients (calcium, phosphorus, sodium, potassium), or calciotropic hormone levels including 25OHD and 1,25(OH)2D.
Changes in Body Composition, Metabolic, and Dietary Parameters After LSG
Six months postoperatively after LSG, all participants had achieved substantial weight loss, with a mean loss of 29.8 ± 9.0 kg, or a 25.1 ± 6.7% decline from baseline weight (P < 0.01, Table 2). Total body fat mass, lean mass, and visceral fat area decreased from preoperative values, with a mean 36.0 ± 11.0% loss of total body fat mass, 16.4 ± 5.3% loss of total body lean mass, and 50.4 ± 15.8% loss of visceral fat area (P < 0.01 for all). Glycated hemoglobin decreased, adiponectin levels increased, and leptin levels decreased postoperatively (P < 0.01 for all). No statistically significant change in estradiol or IGF-1 level was observed, with or without stratification by sex or menopause status. Total food energy intake, macronutrient intakes, and various micronutrient intakes, including calcium and phosphorus, all decreased significantly postoperatively (P < 0.01 for all).
Changes in body composition, metabolic parameters, and dietary intake 6 months after laparoscopic sleeve gastrectomy
| n = 35 | Baseline | 6-Month Postop | % Change | P |
|---|---|---|---|---|
| Body composition changes | ||||
| ȃWeight (kg) | 118.9 ± 17.4 | 89.1 ± 15.7 | −25.1 ± 6.7% | <0.01 |
| ȃBMI (kg/m2) | 43.7 ± 6.2 | 32.2 ± 5.2 | −25.9 ± 8.0 | <0.01 |
| ȃTotal body fat (kg) | 51.4 ± 10.2 | 32.9 ± 8.6 | −36.0 ± 11.0 | <0.01 |
| ȃTotal body lean (kg) | 63.6 ± 10.1 | 53.3 ± 9.7 | −16.4 ± 5.3 | <0.01 |
| ȃPercentage body fat (%) | 43.7 ± 4.5 | 37.0 ± 5.6 | −15.5 ± 9.0 | <0.01 |
| ȃVisceral fat area (cm2) | 179.2 ± 77.7 | 83.0 ± 43.0 | −50.4 ± 15.8 | <0.01 |
| ȃWaist circumference (cm) | 116.7 ± 11.1 | 96.3 ± 10.7 | −17.3 ± 6.2 | <0.01 |
| ȃHip circumference (cm) | 135.4 ± 13.1 | 113.3 ± 12.3 | −15.7 ± 6.0 | <0.01 |
| Laboratory changes | ||||
| ȃHbA1c (%) | 5.5 (5.1-5.9) | 5.1 (4.9-5.4) | −7.4 (−13.6 to −3.6) | <0.01 |
| ȃAdiponectin (μg/mL) | 7.6 (4.3-10.8) | 12.3 (7.5-16.3) | +54.9 (+36.7 to +90.9) | <0.01 |
| ȃLeptin (ng/mL) | 47.0 (34.7-67.7) | 14.7 (8.0-22.9) | −67.6 (−84.3 to −47.2) | <0.01 |
| ȃEstradiol (pg/mL) | 55.5 (30.5-75.5) | 41.2 (25.9-84.3) | −12.4 (−21.7 to +28.7) | 0.82 |
| ȃIGF-1 (ng/mL) | 128.7 (86.0-159.0) | 133.2 (94.2-172.6) | +4.9 (−7.5 to +26.1) | 0.12 |
| Dietary changes (n = 28) | ||||
| ȃTotal food energy (kcal/24 hours) | 1729 (1164-2384) | 901 (731-1192) | −52.8 (−65.2 to −22.6) | <0.01 |
| ȃProtein (g/24 hours) | 75 (47-98) | 52 (31-61) | −45.4 (−60.7 to −6.3) | <0.01 |
| ȃTotal fat (g/24 hours) | 77 (53-108) | 43 (35-55) | −46.6 (−60.1 to −23.0) | <0.01 |
| ȃCarbohydrate (g/24 hours) | 188 (126-254) | 84 (60-107) | −56.8 (−74.5 to −31.4) | <0.01 |
| ȃCalcium (mg/24 hours) | 703 (497-960) | 512 (360-666) | −35.9 (−48.8 to −5.9) | <0.01 |
| ȃPhosphorus (mg/24 hours) | 1193 (783-1369) | 789 (515-931) | −41.4 (−55.1 to −19.4) | <0.01 |
| ȃSodium (mg/24 hours) | 2911 (2001-3668) | 1506 (1098-2252) | −46.1 (−68.5 to −23.7) | <0.01 |
| ȃPotassium (mg/24 hours) | 2259 (2039-2907) | 1499 (1035-1979) | −42.3 (−56.8 to −14.3) | <0.01 |
| ȃFiber (g/24 hours) | 16.6 (11.3-21.4) | 7.6 (4.9-13.0) | −50.8 (−68.2 to −19.3) | <0.01 |
| ȃSoluble fiber (g/24 hours) | 5.1 (3.6-6.2) | 2.4 (1.9-3.7) | −51.8 (−65.8 to −22.5) | <0.01 |
Values are means ± SDs or median (interquartile range).
P-value calculated based on paired t-test or Wilcoxon signed-rank depending on normality of distribution.
Abbreviations: BMI, body mass index; HbA1c, hemoglobin A1c; IGF-1, insulin-like growth factor-1; postop, postoperative.
Changes in FCA, Bone Turnover Markers, Calciotropic Hormones, and BMD
After LSG, mean FCA declined from 31.4 ± 15.4% to 16.1 ± 12.3%, corresponding to a median absolute decrease of −16.7% (IQR −22.1 to −3.0) and a median percentage (relative) decrease of −48.8% (IQR −76.4-−26.3) (Fig. 1). The decline in FCA did not differ by menopausal status or by sex. Median postoperative 25OHD level was 36 (IQR 30-46) ng/mL (Table 3); all participants had a 25OHD level > 20 ng/mL. Of the 35 participants, 27 (77%) achieved the targeted 25OHD level ≥ 30 ng/mL while 8 (23%) participants had a level between 20 and 30 ng/mL. In a sensitivity analysis excluding these 8 participants, FCA still declined from 30.0 ± 16.2% to 15.3 ± 12.4% (P < 0.01). At the postoperative time point, 23 (66%) participants were taking a proton pump inhibitor (PPI), up from 8 (23%) at baseline. In a sensitivity analysis excluding PPI users, FCA still dropped from 36.2 ± 17.0% to 16.8 ± 12.3% (P < 0.01). The decline in FCA was also similar when excluding the 3 participants who were on oral contraceptives or menopausal hormone therapy prior to, but not at 6 months after, surgery (FCA decline from 31.9 ± 16.0% to 16.3 ± 12.3%, P < 0.01).
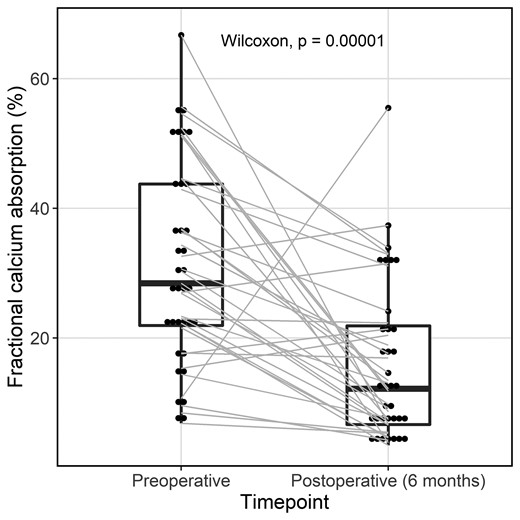
Fractional calcium absorption before and 6 months after laparoscopic sleeve gastrectomy (n = 35).
Changes in fractional calcium absorption, calciotropic hormones, biochemical markers of bone turnover, and BMD 6 months after laparoscopic sleeve gastrectomy
| n = 35 | Baseline | 6-month Postop | % Change | P |
|---|---|---|---|---|
| Calcium absorption | ||||
| ȃFCA (%) | 31.4 ± 15.4 | 16.1 ± 12.3 | −48.8 (−76.4, −26.3) | <0.01 |
| Calciotropic hormones | ||||
| ȃSerum calcium, mg/dL | 9.2 ± 0.3 | 9.3 ± 0.3 | +0.0 ± 0.4 | 0.71 |
| ȃAlbumin, g/dL | 4.0 ± 0.3 | 4.0 ± 0.3 | −0.1 ± 0.3 | 0.31 |
| ȃ25OHD, ng/mL | 39 (32-46) | 36 (30-46) | −2.2 (−23.4 to +21.7) | 0.93 |
| ȃPTH, pg/mL | 38 (27-51) | 37 (27-60) | +3.4 (−23.8 to +43.1) | 0.24 |
| ȃ1,25(OH)2D, pg/mL | 60 (50-82) | 86 (72-107) | +36.7 (+13.6 to +80.1) | <0.01 |
| ȃCreatinine, mg/dL | 0.74 (0.64-0.85) | 0.67 (0.60-0.80) | −7.5 (−17.3 to +3.1) | 0.03 |
| ȃeGFR, mL/min | 103 (89-116) | 108 (98-118) | +2.4 (−1.3 to +13.2) | 0.03 |
| ȃPhosphorus, mg/dL | 3.6 (3.3-3.9) | 3.9 (3.6-4.2) | +8.5 (0.0 to +16.7) | <0.01 |
| ȃUrine calcium, mg/24hr | 187 (85-268) | 167 (92-302) | −31.0 (−53.2 to +156.6) | 0.36 |
| Bone turnover markers | ||||
| ȃCTx, ng/mL | 0.19 (0.11-0.28) | 0.55 (0.36-0.81) | +192.6 (+97.7 to +320.5) | <0.01 |
| ȃP1NP, ng/mL | 41.2 (34.9-62.6) | 72.6 (56.2-92.4) | +58.5 (+34.6 to +101.6) | <0.01 |
| Bone mineral density | ||||
| ȃAreal BMD, g/cm2 | ||||
| ȃLumbar spine | 1.108 ± 0.130 | 1.109 ± 0.123 | +0.6 ± 4.1 | 0.49 |
| ȃTotal hip | 1.084 ± 0.121 | 1.030 ± 0.121 | −5.2 ± 3.3 | <0.01 |
| ȃFemoral neck | 0.907 ± 0.125 | 0.879 ± 0.122 | −3.3 ± 5.0 | <0.01 |
| Volumetric BMD, g/cm3 | ||||
| ȃLumbar spine | 0.164 ± 0.038 | 0.158 ± 0.033 | −2.1 ± 9.8 | 0.07 |
Values are means ± SDs or median (interquartile range).
P-value calculated based on paired t-test or Wilcoxon signed-rank depending on normality of distribution.
Abbreviations: 1,25(OH)2D, 1,25-dihydroxyvitamin D; 25OHD, 25-hydroxyvitamin D; BMD, bone mineral density; CTx, collagen type 1 C-telopeptide; eGFR, estimated glomerular filtration rate; FCA, fractional calcium absorption; P1NP, procollagen 1 intact N-terminal propeptide; PTH, intact parathyroid hormone.
One participant had a large postoperative increase in FCA. This participant was a 56-year-old man whose clinical characteristics, postoperative weight loss, and clinical course were typical for this cohort. He was taking a PPI preoperatively but not at 6 months postoperatively (a medication profile shared by 1 other participant, for whom FCA decreased).
There was no change in mean serum calcium or 24-hour urinary calcium level over the 6 months after LSG. There was a small improvement in serum creatinine level and eGFR (P = 0.03 for both). There was no statistically significant change in serum PTH levels. However, 1,25(OH)2D level increased from a median of 60 (IQR 50-82) pg/mL to 86 (IQR 72-107) pg/mL (P < 0.01). When we restrict our analysis to those 27 participants with a postoperative 25OHD level ≥ 30 ng/mL, the change in 1,25(OH)2D was still significant with an increase from a median 63 (IQR 50-82) pg/mL to 87 (IQR 74-111) (P < 0.01). Serum phosphorus levels also increased (P < 0.01).
Concurrently, bone turnover marker levels increased markedly, by a median of +192.6% (IQR +97.7 to +320.5) for CTx and +58.5% (IQR +34.6 to +101.6) for P1NP (P < 0.01 for both). Areal BMD declined significantly at the total hip (by −5.2 ± 3.3%, P < 0.01) and femoral neck (−3.3 ± 5.0%, P < 0.01). Lumbar spine areal BMD did not change over the 6-month period. Lumbar spine volumetric BMD change was not statistically significant (−2.1 ± 9.8%, P = 0.07).
Participants with greater postoperative increases in IGF-1 levels had higher postoperative FCA (ρ = + 0.35, P = 0.04; Fig. 2A). This relationship remained significant with adjustment for age, sex, and menopause status (ρpartial = + 0.40, P = 0.02). Changes in weight, dietary macronutrient or fiber intakes, calciotropic hormones, estradiol levels, or adipokines were not associated with postoperative FCA or FCA change.
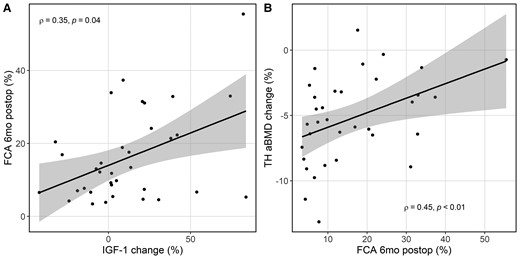
Scatter plot with best fit line and 95% CI (shaded) showing (A) the greater the increase in insulin-like growth factor 1 (% change), the higher the postoperative FCA, and (B) the greater the postoperative FCA, the less decrease in total hip areal bone mineral density (% change) 6 months after laparoscopic sleeve gastrectomy. Abbreviations: FCA, fractional calcium absorption.
Participants with lower postoperative FCA levels had greater decline in total hip areal BMD (ρ = + 0.45, P < 0.01; Fig. 2B). After adjustment for age, sex, and menopause status, the relationship remained significant (ρpartial = + 0.50, P < 0.01). In addition, participants with greater percentage weight loss had greater percentage declines in total hip areal BMD (ρ = + 0.36, P = 0.04), and those with greater increases in IGF-1 had less total hip areal BMD loss (ρ = + 0.47, P < 0.01). These relationships remained significant with adjustment for age, sex, and menopause status.
Discussion
We report the first study to evaluate FCA in patients undergoing LSG with ongoing optimization of vitamin D status. In this cohort of 35 adults with severe obesity, we found that even with maintenance of robust 25OHD levels and recommended calcium intake, FCA decreased substantially from a mean of 31.4% to a mean of 16.1% 6 months after LSG. Moreover, those with lower postoperative FCA had greater losses of hip areal BMD. Although it is not a bariatric procedure categorized as malabsorptive, LSG induces calcium malabsorption, and this could contribute to negative skeletal effects.
We previously conducted a RYGB cohort study with identical study design and protocol and found a larger decline in FCA over the first 6 postoperative months, from a mean of 32.7% to a mean of 6.9% (16). The percentage (relative) decline in FCA in that RYGB cohort was 73%, whereas the percentage decline in this LSG cohort was 49%. The results are consistent with our a priori hypothesis that malabsorptive procedures such as RYGB have a more pronounced effect on calcium homeostasis than LSG. Calcium is absorbed via 2 mechanisms: an active transcellular process regulated by vitamin D that occurs primarily in the duodenum and a paracellular diffusional process that occurs throughout the intestine (39–41). After RYGB, nutrients no longer flow through the duodenum and the proximal jejunum. Thus, calcium absorption is reliant on the latter passive mechanism and on the modest active transcellular transport that occurs in the distal small intestine and the colon, and those appear insufficient to overcome the absence of duodenal involvement. In contrast, after LSG, both active and passive processes would be expected to be present and unaltered in the setting of an intact intestinal tract. Therefore, it is striking that LSG still resulted in a substantial reduction in FCA. A wider variation in postoperative FCA was also observed after LSG vs RYGB, suggesting that LSG may have more variable impact on FCA.
Resection of a sizable portion of the stomach does lead to changes in the gastrointestinal system that can contribute to the decline in FCA. LSG induces acceleration in gastric emptying and intestinal motility (42, 43), which could impact nutrient handling and mineral absorption. Importantly, it has also been shown that LSG greatly diminishes gastric acid production due to the reduction of parietal cell mass (44). Gastric acid solubilizes calcium that is then complexed with other dietary constituents for absorption in the intestine, and prior studies have shown that a decrease in gastric acidity can impair calcium absorption capacity (45–47). In addition, patients undergoing LSG are commonly treated with PPI medications postoperatively to minimize the risk of gastroesophageal reflux and intestinal ulcer formation. However, we found that PPI non-users had a similar decline in FCA after LSG. Therefore, it may be that the operation itself had a more profound effect on absorption-related factors that overshadowed the differences in PPI use.
LSG results in marked changes in diet, body composition, hormonal expressions, and the gut microbiome, and these alterations have been implicated in the ability of the intestine to absorb calcium (48–50). We explored factors that may be determinants of FCA decline, including weight loss, dietary intakes (macronutrients, fiber), and hormonal regulators, and the results were largely unrevealing. Although prior studies have reported that nonsurgical weight loss results in a decrease in FCA compared to weight maintenance (51, 52), we did not see an association between weight loss and FCA decline in our study. In those prior studies, weight loss was modest (<5% of baseline weight). Data do not exist with larger magnitudes of nonsurgical weight loss, leaving us unable to discern how much of the drop in FCA can be attributed to weight loss alone. Interestingly, we found a positive correlation between increases in IGF-1 levels and postoperative FCA. It has been shown that systemic IGF-1 enhances calcium absorption via its action on 1,25(OH)2D (53–57), so variability in IGF-1 may explain some of the variability in change in FCA after LSG.
One other study has been published examining FCA after LSG to our knowledge, and our findings are comparable in magnitude. Carrasco and colleagues (15) studied 19 premenopausal women and found that FCA decreased from 36.5% preoperatively to 21.0% at 12 months and 18.8% at 24 months post-LSG. Carrasco and colleagues used a very small calcium load in the standardized meal (<20 mg) with a goal to assess primarily the active 1,25(OH)2D-mediated component of calcium absorption. In contrast, we used a test meal with higher calcium content to determine the full intestinal FCA capacity via both active and passive absorption, reflecting response to a typical meal. Our study participants had higher baseline BMI (43.7 kg/m2 vs 37.3 kg/m2), although the weight loss seen by both cohorts was dramatic. Carrasco and colleagues' participants had a lower average 25OHD level throughout the study, with vitamin D deficiency (25OHD level <20 ng/mL) present in 17% of participants at 1 year and 54% of participants at 2 years after LSG. We designed our study protocol to involve active attention to vitamin D supplementation and sufficiency, in order to examine the effects of LSG on FCA independent of vitamin D deficiency. Despite the differences in methodology, we can conclude that correction of vitamin D deficiency, with robust calcium intake, does not mitigate the substantial decline in FCA after LSG.
For the measurement of FCA, we found variable calcium contents of the standardized test meal with soymilk and instant breakfast powder, ranging from 358 mg to 596 mg (median 470 mg with IQR 438-489 mg). Although the size of a calcium load does affect FCA, the effect is small within the range of calcium content values we measured between the lots of soymilk and instant breakfast powder we used. The calculated difference in FCA between the lowest and highest measured values of the test meal calcium content is estimated to be only about 5% (58), which is exceeded by the pre-post difference detected, suggesting that the degree of variation in the test meal calcium content did not significantly alter our results.
The significant decline in FCA poses concerns that it may contribute to poor bone health after LSG. As a response to low intestinal calcium absorption, PTH secretion increases to enhance renal calcium reabsorption, stimulate conversion of 25OHD to 1,25(OH)2D, and increase bone resorption to maintain normocalcemia. This, though, can lead to accelerated bone loss and greater fracture risk. In our study, 1,25(OH)2D level rose 6 months postoperatively despite a stable PTH level. The reason PTH level did not increase on average is unclear but may be due to the effects of concurrent non-PTH-mediated increases in bone resorption due to factors such as mechanical unloading and changes in adipokine, sex steroid, and gut-secreted hormones (59–62). If bone resorption from those other causes increases extracellular calcium concentration, PTH secretion may be dampened. This increased bone resorption could also explain the lack of change in urinary calcium excretion despite the decrease in FCA. The mechanism behind the sizable rise in 1,25(OH)2D levels without a parallel increase in PTH levels is unclear. We speculate that it could be partly due to the documented decrease in dietary phosphorus, as dietary phosphorus restriction has been shown to increase renal synthesis of 1,25(OH)2D via renal mitochondrial 1α-hydroxylase activity that is independent of PTH (63–68). The small rise in postoperative serum phosphorus, however, is unexplained. It may be that the single morning fasting value of serum phosphorus does not represent the total body phosphorus state and instead reflects heightened bone resorption in the early morning.
Six months after LSG, the bone resorption marker serum CTx increased by a median of 192.6%, and P1NP bone formation marker increased by a median of 58.5%, while areal BMD assessed by DXA decreased 5.2% at the total hip and 3.3% at the femoral neck. These bone metabolism effects are likely multifactorial, with contributing factors including mechanical unloading (ie, degree of weight loss), hormonal changes like changes in IGF-1, and changes in nutritional factors. We found that those participants with the lowest postoperative FCA had the greatest BMD loss at the total hip. Therefore, we conclude that the low FCA could additionally contribute to LSG's skeletal effects.
Our findings have implications for the care of patients who have undergone LSG. For the general population (ie, not having undergone bariatric surgery), the daily recommended dietary allowance of calcium is 1000 mg for adults up to age 70 (men) and age 50 (women) and 1200 mg for those who are older (69). Given concerns about calcium and vitamin D malabsorption, professional organizations of surgeons and endocrinologists have recommended daily calcium intakes of 1200 to 1500 mg after bariatric surgery (total from dietary and calcium citrate supplementation) (70). Preoperatively, our participants were guided to consume a total daily calcium intake of 1200 mg, and they had a mean FCA of 31.4%, which is equivalent to a net 377 mg calcium absorbed per day. After LSG, the mean FCA declined to 16.1%, which meant a net 193 mg calcium absorbed daily. In order to maintain the same net calcium input they had experienced preoperatively, they would need to consume 2340 mg of calcium daily—a substantially higher intake than that recommended by the professional guidelines, although below the tolerable upper level for safety (69). Although further research is needed to determine the specific approach, the recommended calcium intake may need to be increased for patients after bariatric surgery to attenuate negative skeletal effects.
Major strengths of our study include its prospective, longitudinal design and the measurement of FCA using the rigorous standardized dual stable isotope technique. Assessment of calcium homeostasis, bone health, and dietary intakes was comprehensive. Our cohort was representative of the target patient population undergoing bariatric surgery. A limitation of our study is that its observational nature cannot determine causal relationships with respect to predictors of change in FCA or the role of changes in FCA in other bone outcomes. Full calcium balance studies would be required to confirm the negative calcium balance implied by our FCA results. The study sample is heterogenous in terms of sex, age, menopausal status, and race/ethnicity. The study is limited by its 6-month duration; the longer term effects on FCA remain unknown.
In conclusion, intestinal FCA decreased substantially 6 months after LSG, even with optimization of 25OHD level and with total daily calcium intake of approximately 1200 mg. Those with lower postoperative FCA had greater total hip areal BMD loss, suggesting that the decline in FCA may be one factor contributing to negative skeletal consequences of LSG. Our findings suggest that patients undergoing LSG may need higher calcium intakes than those currently recommended for this population. Better strategies to prevent perturbations in calcium homeostasis and subsequent long-term detrimental skeletal impacts of LSG need to be further investigated, such as nutrition strategies to improve calcium absorption capacity.
Acknowledgments
The authors thank Sarah Palilla, PA, and Elliazar Enriquez, LVN, for their facilitation of study recruitment; Aldric Chau for quantitative computed tomography bone density analysis; and Thomas Lang, PhD, and Dolores Shoback, MD, for their expert advice.
Funding
This study was funded by the National Institute of Diabetes and Digestive and Kidney Diseases (NIDDK, R01DK107629). Additional support came from NIDDK Grant P30DK098722, the National Institute of Arthritis and Musculoskeletal and Skin Diseases (P30AR075055), the National Center for Advancing Translational Sciences (UL1TR001872), and the Northern California Institute for Research and Education. K.C.W. has received support from the U.S. Department of Veterans Affairs and the NIDDK (T32DK00741837). T.Y.K. is supported by the U.S. Department of Veterans Affairs (VA Career Development Award, 1IK2CX001984). Calcium citrate supplements were donated by Bariatric Advantage. Manuscript content is solely the responsibility of the authors and does not necessarily represent the official views of the National Institutes of Health.
Disclosure Statement
A.L.S. has received investigator-initiated research funding from Amgen. The other authors have nothing to disclose.
Data Availability
Some or all data sets generated during and/or analyzed during the current study are not publicly available but are available from the corresponding author on reasonable request.
