


Abstract
Many observational studies have reported on the association between educational attainment (EA) and thyroid function, but the causal relationship remains unclear.
We aimed to obtain causal effects of EA on thyroid function and to quantify the mediating effects of modifiable risk factors.
Two-sample mendelian randomization (MR) was performed by using summary statistics from large genome-wide association studies (GWAS) to assess the effect of EA on thyroid function, including hypothyroidism, hyperthyroidism, thyrotropin (TSH), and free thyroxine (FT4). A multivariable analysis was conducted to assess the mediating role of smoking and help to explain the association between EA and thyroid function. Similar analysis was further performed using data from the National Health and Nutrition Examination Survey (NHANES) 1999 to 2002.
In MR analysis, EA was causally associated with TSH (β = .046; 95% CI, 0.015-0.077; P = 4.00 × 10⁻³), rather than hypothyroidism, hyperthyroidism, and FT4. Importantly, smoking could serve as a mediator in the association between EA and TSH, in which the mediating proportion was estimated to be 10.38%. After adjusting for smoking in the multivariable MR analysis, the β value of EA on TSH was attenuated to 0.030 (95% CI, 0.016-0.045; P = 9.32 × 10⁻³). Multivariable logistic regression model in NHANES suggested a dose-response relationship between TSH (quartile [Q]4 vs Q1: odds ratio = 1.33; 95% CI, 1.05-1.68; P for trend = .023) and EA. Smoking, systolic blood pressure, and body mass index partially mediated the association between EA and TSH, with the proportion of the mediation effects being 43.82%, 12.28%, and 6.81%, respectively.
There is a potentially causal association between EA and TSH, which could be mediated by several risk factors, such as smoking.
Thyroid dysfunction mainly includes hypothyroidism and hyperthyroidism, the prevalence of which has been increasing rapidly. Exploring thyroid function-related risk factors for the prevention and treatment of thyroid dysfunction is of great importance. Recent studies showed that socioeconomic inequality can be associated with thyroid dysfunction. A cross-sectional study illustrated that higher level of educational attainment (EA) was associated with lower hyperthyroidism risk (1). However, observational studies could be susceptible to reverse causation as well as unmeasured confounders, whereas mendelian randomization (MR) analysis provides an alternatively efficient way to assess the causal relationship of exposure-outcome pair via using instrumental variables (2). Indeed, several studies had found that education was causally associated with myopia, coronary heart disease, and stroke (3-5) using the MR approach. However, studies are still lacking regarding the relationship between EA and thyroid function.
On the other hand, many studies had shown Graves disease, Graves ophthalmopathy, thyroid dysfunction, and thyroid nodules all had a certain relationship with smoking (6-9), given that tobacco smoke contains more than 4800 compounds including at least 200 toxicant or endocrine disruptors, some of which may have prothyroid and antithyroid action such as nicotine, thiocyanate, and benzpyrene (10-14). The rate of smoking among individuals taking thyroid-altering medications was lower than that those without medications (15). In addition, a previous study (16), in terms of MR analysis, indicated a potentially causal association between low EA and increased risk of smoking, which suggested that smoking may help to explain the observational associations between EA and adverse health outcome, including thyroid dysfunction.
In this study, we hypothesize that EA could affect thyroid function, which could be mediated by smoking. We first adopted a 2-sample univariable MR approach to investigate the causal effect of EA on thyroid function. Multivariable MR was further performed to assess the mediating role of smoking (mediator) on the association between EA and thyroid function. In addition, we conducted a parallel association analysis using data from the 1999 to 2002 National Health and Nutrition Examination Survey (NHANES).
Materials and Methods
Study Design
The MR study design is shown in Fig. 1. We first examined whether EA was causally associated with thyroid function by univariable MR analysis. If so, a multivariable MR analysis was performed to assess the mediating effects of smoking (17, 18). In addition, we also conducted a parallel analysis using data from NHANES 1999 to 2002.
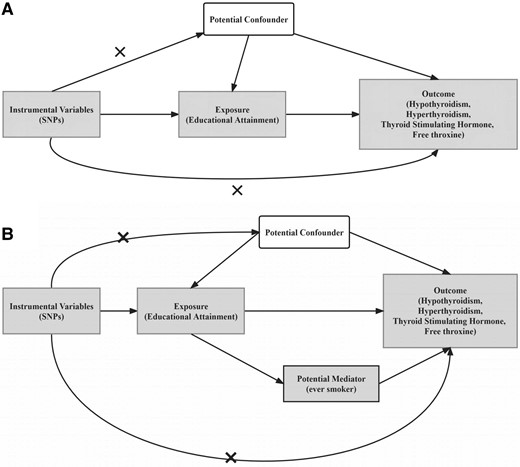
Flowchart of the study design. A, MR analysis framework; B, illustrative diagram for the mediation MR analysis framework. The figures show 3 assumptions for instrumental variable commonly required in MR analysis. Dotted lines represent possible ways that the assumptions could be violated. MR, mendelian randomization; SNP, single-nucleotide polymorphism (now known as single-nucleotide variation; SNV).
Genome-wide Association Study Data Sources
The GWAS of EA were selected from the latest data with the largest sample size, including 3 037 499 individuals and 10 946 469 single-nucleotide variations (SNVs, formerly single-nucleotide polymorphisms [SNPs]) (19). Data from EA were the combination of 3 data sets of summary statistics: published results from a previous meta-analysis of 69 cohorts (N = 324 162, excluding the UK Biobank [UKB] and 23andMe), from 23andMe (N = 2 272 216), and from GWAS performed in the UKB (N = 441 121); these were followed by previous large-scale GWASs of EA (20, 21). EA was measured by years of school completion (EduYears). The EduYears phenotype was coded by mapping the highest level of education that a respondent achieved to an International Standard Classification of Education 1997 (ISCED) category and then imputing a years-of-education equivalent for each ISCED category (Supplementary Table S1) (22). In addition, the previous GWAS excluded individuals younger than 30 years when EA was measured (21), but this GWAS included individuals aged 16 to 29 years.
GWAS data for hypothyroidism and hyperthyroidism were obtained from the UKBB and included 484 598 individuals and 9 886 868 SNVs (23). Data used self-reported disease and age at diagnosis, where hypothyroidism was defined as a self-reported history of hypothyroidism/myxedema and hyperthyroidism was defined as a self-reported history of hyperthyroidism/thyrotoxicosis. The age at diagnosis for self-reported disease ranged from 0 to 70 years. The thyrotropin (TSH) GWASs included 119 715 individuals and 22 397 080 SNVs (24), which were obtained from a GWAS meta-analysis for TSH levels on the population-based Nord-Trøndelag Health Study (HUNT) (N = 55 342), the Michigan Genomics Initiative (MGI, N = 10 085), and the ThyroidOmics consortium (up to N = 54 288 samples). The GWAS summary statistics for free thyroxine (FT4) were from the ThyroidOmics Consortium study, which is the largest GWAS data set for thyroid function to date. The FT4 GWAS included 72 167 individuals and 7 963 150 SNVs (25). TSH and FT4 levels of these individuals were within reference ranges, and individuals of non-European ancestry, those using thyroid medication, or those who had undergone previous thyroid surgery were excluded.
The GWAS of smoking included 518 633 individuals with 11 514 654 SNVs, all of whom were defined as an ever smoker (whether one has ever been a smoker) (26). Data sources for exposure, potential mediators, and outcomes are listed in Table 1. Population characteristics and specific trait definitions relating to all these summary genetic association estimates are available in their original publications. Taking ethnic differences into account, the GWAS data sets of the aforementioned traits are all of European ancestry.
Data sources used in mendelian randomization analyses
| Trait | Exposure/Outcome/potential mediator | Description of data source | Name of consortium/cohort | Ancestry | Sample size | No. SNVs | Explained variance by lead SNPs |
|---|---|---|---|---|---|---|---|
| EA | Exposure | Coding of EA variable in these data followed previous large-scale GWASs of EA. Previous GWAS excluded individuals aged <30 y when EA was measured, but this GWAS included individuals aged 16-29 y | 69 cohorts (excluding UKBB and 23andMe), 23andMe, and UKBB | European | 3 037 499 | 10 946 469 | 0.0102 |
| Hypothyroidism | Outcome | Hypothyroidism defined as self-reported history of hypothyroidism/myxedema | UKBB | European | 484 598 | 9 886 868 | 0.0327 |
| Hyperthyroidism | Outcome | Hyperthyroidism defined as self-reported history of hyperthyroidism/thyrotoxicosis | UKBB | European | 484 598 | 9 886 868 | 0.0089 |
| TSH | Outcome | HUNT study: patients with self-reported thyroid disease excluded MGI: individuals with any thyroid disorders excluded ThyroidOmics Consortium: individuals of non-European ancestry, use of thyroid medication, or previous thyroid surgery excluded | HUNT, MGI, and ThyroidOmics Consortium | European | 119 715 | 22 397 080 | 0.0900 |
| FT4 | Outcome | Individuals of non-European ancestry, use of thyroid medication, or previous thyroid surgery were excluded, and FT4 levels were within reference range | ThyroidOmics Consortium | European | 72 167 | 7 963 150 | 0.0264 |
| Smoking | Potential mediator | GWAS data for smoking defined as ever smoker (whether one has ever been a smoker) | – | European | 518 633 | 11 514 654 | 0.0138 |
Abbreviations: EA, educational attainment; FT4, free thyroxine; GWAS, genome-wide association study; HUNT, Nord-Trøndelag Health Study; MGI, Michigan Genomics Initiative; SNV, single-nucleotide variation; TSH, thyrotropin; UKBB, UK Biobank.
Mendelian Randomization Analysis
Often, MR analysis requires 3 key assumptions (Fig. 1A): (1) the genetic variants selected must be strongly associated with the exposure; (2) the genetic variant is independent of any potential confounders between exposure and outcome; and (3) the genetic variants affect the outcome only through the exposure of interest. To select the valid instrumental variables for MR analysis, we followed a rigorous selection procedure from previous MR studies (27). In particular, we (1) selected SNVs strongly associated with the exposure at genome-wide significance (P < 5 × 10⁻⁸); 2) screened out independent instrumental SNVs using PLINK (version 1.90) (28), based on r2 less than 0.01 or a physical distance of more than 10 000 kb; (3) removed the potentially pleiotropic SNVs that were associated with outcome at a P value less than .05 after Bonferroni correction; and 4) harmonized the alleles and effects between the exposure and outcome data sets. We calculated the proportion of variance explained by an individual SNV (29) and then calculated the F statistic (27) to assess the problem of weak instrumental variables (details in Supplementary Material) (22).
All detailed instrumental variable SNV information is listed in Supplementary Tables S2 to S7 (22). We first performed a 2-sample MR analysis to explore the causal effect of EA on thyroid function. A random-effects inverse variance-weighted (IVW) method was used as the primary MR analysis to estimate the effects of EA and thyroid function (30). Several alternative MR methods including the weighted median method (31, 32), IVW method using robust regression (MR-Robust) (33), MR-Lasso (33), MR Robust-Adjusted Profile Score (MR-RAPS), (33) and MR-Egger (34), were used for sensitivity analysis. In addition, we displayed the results using scatter plots, funnel plots, and forest plots.
Given that causal estimates derived from univariable MR analyses represent the overall effect of exposure on outcomes, multivariable MR analyses can be used to estimate the direct causal effect of exposure on outcomes by taking the mediator into account. The difference between causal estimates from univariable (total effects) and multivariable MR analyses (direct causal effects) implies that causal effects operate at least in part through potential mediators (indirect effects) (18, 35, 36). In other words, multivariable MR mediation analysis was used to estimate the proportion of mediating effects of smoking on EA and TSH (17, 37).
Observational Study Population in the National Health and Nutrition Examination Survey
We used publicly available data from NHANES 1999 to 2002, which adopted a complex, multistage, probability-based sampling design to select participants who represented the civilian, noninstitutionalized US population. The study included 2698 adult participants, with complete data on age, sex, race, educational level, TSH, body mass index (BMI), smoking, and systolic (SBP) and diastolic blood pressure (DBP). Educational level was categorized according to ISCED and then assigned a value of years of schooling. Years of schooling was then rescaled so that a one-unit increase represented 4.2 years of schooling. Serum TSH was used to assess thyroid function. To ensure the continuity of thyroid function in the study population, we conducted the analysis using the whole range of TSH, rather than using only the normal range of TSH. Participants who received chemotherapy within the last 4 weeks were excluded. BMI was calculated by dividing weight (in kilograms) by height in meters squared. For practical and computational reasons, smoking was considered a categorical variable, recoded into ever vs never smoking. SBP and DBP were averaged from multiple repeat BP measurements according to recommendations. Continuous variables are presented as mean ± SD, and categorical variables are reported as numbers and percentages. The TSH levels were stratified into quartiles (Q1-Q4). Subsequently, multivariable logistic regression was implemented to assess the independent association between EA and TSH levels. In the logistic model, covariates were set as follows: model 1 was a univariable regression model; model 2 was adjusted for age, sex, and race; and model 3 was additionally adjusted for BMI, SBP, DBP, and smoking. Differences with P less than .05 were considered statistically significant. Considering that BMI, SBP, DBP, and smoking may be mediators between EA and TSH, we also performed a mediation analysis. In addition, we further evaluated the effect of the poverty income ratio on thyroid functions.
Software
We used the R packages MendelianRandomization (version 0.6.0) and MR.raps (version 0.2) for MR analysis. All analyses accounted for the complex survey design using appropriate survey weights in NHANES, with the weighted analysis being conducted using the R packages Survey (version 4.1-1). All statistical analyzes were performed in the R (version 4.2.2) environment. P values less than .05 were considered statistically significant.
Results
Two-Sample Mendelian Randomization of Educational Attainment on Thyroid Function
In total, the number of instrumental variables for EA on hypothyroidism, hyperthyroidism, TSH, and FT4 were 653, 661, 663, and 657, respectively, which together explained about 1.02% of the phenotypic variation of EA. The overall F statistics were 47.53, 47.51,47.50 and 47.57 (Supplementary Table S2-S5) (22), respectively, indicating the MR results were less likely to be influenced by weak instrument bias.
Two-sample univariable MR analysis showed that EA had a potentially causal effect on TSH (IVW: β = .046; 95% CI, 0.015-0.077; P = 4.00 × 10⁻³), indicating that for each level increase in EA, TSH could significantly increase by 0.046 SDs. However, EA had no causal association with hypothyroidism (IVW: odds ratio [OR] = 0.998; 95% CI, 0.994-1.001; P = .221), hyperthyroidism (IVW:OR = 0.999; 95% CI, 0.998-1.001; P = .403), and FT4 (IVW: β = –.033; 95% CI, −0.083 to 0.016; P = .189). Similar results were obtained from the weighted median method, MR-Robust, MR-Lasso, MR-RAPS, and MR-Egger methods (Fig. 2). The P values of the intercept of MR-Egger regarding the association between EA on hypothyroidism, hyperthyroidism, TSH, and FT4 were .715, .192, .502, and .165, respectively, indicating the results are less likely to be influenced by horizontal pleiotropy. Scatter plots, funnel plots, and forest plots are listed in Supplementary Figs. S1 to S4 (22). The funnel plots indicate there were no obvious outliers, strengthening the robustness of our results. The forest plots also suggest that no single instrument acted as a potential outlier.

The causal effect estimates of EA on thyroid function from multiple MR methods with different model assumptions. EA, educational attainment; FT4, free thyroxine; IVW, inverse variance weighted method; MR, mendelian randomization; MR-RAPS, MR Robust-Adjusted Profile Score; TSH, thyrotropin.
Two-Sample Mendelian Randomization Analysis of Educational Attainment on Smoking and Smoking on Thyrotropin
In total, the number of instrumental variables for EA on smoking was 608. The overall F statistic was 46.55 (Supplementary Table S6) (22), indicating the MR results were less likely to be influenced by weak instrument bias. The number of instrumental variables for smoking on TSH was 173, which together explained about 1.38% of the phenotypic variation of smoking. The overall F statistic was 41.79 (Supplementary Table S7) (22), indicating the MR results were less likely to be influenced by weak instrument bias.
EA had a potentially causal effect on smoking (IVW: OR = 0.924; 95% CI, 0.876-0.973; P = 3.00 × 10⁻³), indicating that EA was negatively associated with smoking and low EA could increase risk of smoking. More important, the results from the main IVW analysis were consistent with that from other MR methods. Specifically, it was estimated to be 0.906 (95% CI, 0.839-0.978; P = .012) in the weighted median method, 0.921(95% CI, 0.872-0.973; P = 4.00 × 10⁻³) in MR-Robust, 0.933 (95% CI, 0.886–0.984; P = .011) in MR-Lasso, 0.918 (95% CI, 0.861–0.975; P = 3.26 × 10⁻³) in MR-RAPS, and 0.821 (95% CI, 0.639-1.055; P = 0.124) in MR-Egger with the intercept indicating no directional pleiotropy (P = .346). In addition, smoking had potentially causal effect on TSH (IVW: β = .157; 95% CI, −0.179 to −0.136; P < .001), indicating that smoking was negatively associated with TSH, and genetically predicted smoking could lower TSH levels. More important, the results from the main IVW analysis were consistent with that from other MR methods. Specifically, β was estimated to be −0.163 (95% CI, −0.188 to −0.138; P < .001) in the weighted median method, −0.164 (95% CI, −0.189 to −0.140; P < .001) in MR-Robust, −0.184 (95% CI, −0.201 to −0.168; P < .001) in MR-Lasso, −0.086 (95% CI, −0.150 to −0.025; P < .001) in MR-RAPS, and −0.053 (95% CI, −0.145–0.039; P = .021) in MR-Egger with its intercept indicating no directional pleiotropy (P = .258), Scatter plots, funnel plots, and forest plots are provided in Supplementary Figs. S5 and S6 (22), suggesting the nonexistence of outlier instrumental SNVs.
Mendelian Randomization Mediation Analysis
We further performed MR mediation analysis to investigate the mechanism of the association between EA and TSH, with smoking as the mediator. The β value of EA on TSH was attenuated from .046 in the univariate MR analysis to .030 (95% CI, 0.016-0.045; P = 9.32 × 10⁻³) in the mediation analysis, with the proportion mediated by smoking estimated to be 10.38%.
Sensitivity Analyses
We performed sensitivity analyses using GWAS data from EA that had not previously included individuals younger than 30 years. The results were largely consistent with that using the aforementioned EA GWAS data. The OR of EA on smoking was 0.840 (95% CI, 0.820-0.960; P = 4.55 × 10−47), and the β value of EA to TSH was 0.039 (95% CI, 0.005-0.073; P = .026), which was attenuated to be 0.010 (95% CI, 0.006-0.012; P = 1.06 × 10⁻⁹) in the mediation analysis, with the proportion mediated by smoking 7.72%.
We also checked the sample overlap between EA and hypothyroidism and hyperthyroidism by the LDSC (linkage disequilibrium score regression) method. The intercept of genetic covariance was estimated to be −0.0097 (SE = 0.0043; P = .0241), indicating that there was sample overlap. Then, we used the MR-APSS method to reanalyze the relationship between EA and hypothyroidism as well as between EA and hyperthyroidism again. The results from MR-APSS showed that the OR of EA on hypothyroidism was 1.013 (95% CI, 0.924-1.111; P = .7825), and the OR of EA on hyperthyroidism was 0.959 (95% CI, 0.899-1.023; P = .2054), which still suggests that there was no relationship between EA and hypothyroidism, or between EA and hyperthyroidism.
Analysis based on National Health and Nutrition Examination Survey Data
The baseline characteristics of the study population are presented in Table 2. Statistically significant associations between EA and TSH can be found both in univariable (quartile [Q]4 vs Q1: OR = 1.31; 95% CI, 1.13-1.52) and multivariable (Q4 vs Q1: OR = 1.33; 95% CI, 1.05–1.68) regression models. Furthermore, the TSH levels had a statistically significant dose-response association with EA (P for trend <.05) (Table 3). Further mediation analysis showed that the proportion of the mediation effects of smoking, SBP, and BMI were 43.82%, 12.28%, and 6.81%, respectively (Supplementary Table S8) (22). In addition, we also conducted the analysis by additionally including the interaction term between EA and smoking in the regression model, and no significant interaction effect was found (β = −.02; 95% CI,−0.18 to 0.14; P = .78). We further conducted the analysis to explore the association between poverty income ratio and TSH, and no positive association was found (Q4 vs Q1: OR = 0.88; 95% CI, 0.74-1.06; P for trend = .86) (Supplementary Table S9) (22).
Characteristics of 2698 participants from the NHANES 1999 to 2002 survey
| Characteristic | |
|---|---|
| Age (mean ± SD), y | 45.75 ± 0.49 |
| Sex (N, %) | |
| Female | 1432 (53%) |
| Male | 1266 (47%) |
| Race (N, %) | |
| Non-Hispanic White | 1361 (50%) |
| Non-Hispanic Black | 467 (17%) |
| Mexican American | 636 (24%) |
| Other Hispanic | 136 (5%) |
| Other race—including multiracial | 98 (4%) |
| Highest completed educational level (N, %) | |
| <9th grade | 403 (15%) |
| 9-11th grade (includes 12th grade with no diploma) | 473 (18%) |
| High school graduate/GED or equivalent | 606 (22%) |
| Some college or AA degree | 704 (26%) |
| ≥College graduate | 512 (19%) |
| TSH (mean ± SD), mU/L | 1.93 ± 0.07 |
| BMI (mean ± SD) | 27.74 ± 0.18 |
| Smoking (N, %) | |
| Never smoker | 1370 (51%) |
| Former smoker | 764 (28%) |
| Current smoker | 564 (21%) |
| SBP (mean ± SD), mm Hg | 122.82 ± 0.55 |
| DBP (mean ± SD), mm Hg | 72.74 ± 0.40 |
Abbreviations: AA, associate of arts; BMI, body mass index; DBP, diastolic blood pressure; NHANES, the National Health and Nutrition Examination Survey; SBP, systolic blood pressure; TSH, thyrotropin.
Multivariable logistic regression model for analyzing the EA associated with thyrotropin levels
| TSH | Q1 | Q2 | Q3 | Q4 | P for trend | ||||
|---|---|---|---|---|---|---|---|---|---|
| EA | OR (95% CI) | P | OR (95% CI) | P | OR (95% CI) | P | OR (95% CI) | P | |
| Multivariable model 1 | Ref. | Ref. | 1.30 (1.12-1.52) | .001 | 1.27 (1.11-1.45) | <.001 | 1.31 (1.13-1.52) | <.001 | <.001 |
| Multivariable model 2 | Ref. | Ref. | 1.45 (1.18-1.79) | .001 | 1.33 (1.12-1.57) | .002 | 1.37 (1.12-1.67) | .004 | .001 |
| Multivariable model 3 | Ref. | Ref. | 1.39 (1.12-1.72) | .004 | 1.29 (1.06-1.56) | .01 | 1.33 (1.05-1.68) | .02 | .023 |
Model 1 was a univariate regression model. Model 2 was adjusted for age, sex, and race. Model 3 was adjusted for age, sex, race, BMI, SBP, DBP, and smoking.
Abbreviations: BMI, body mass index; DBP, diastolic blood pressure; EA, educational attainment; OR, odds ratio; Q, quartile; Ref., reference; SBP, systolic blood pressure; TSH, thyrotropin.
Discussion
In the present study, we investigated the causal effect of EA on TSH within the normal range under the 2-sample MR framework, with smoking as the potential mediator. We also used the MR-APSS method (38) to alleviate the issue of sample overlap between the GWAS data either between EA and hypothyroidism, or between EA and hyperthyroidism; the results remained consistent. Furthermore, we conducted the observational association analyses in the NHANES data.
As a sensitive marker for thyroid function, TSH could reflect both hypothyroidism and subclinical hyperthyroidism (39). The protective effect of EA on low levels of TSH can be attributed to the broad benefits of education, which also dovetails with the concept of a “health gradient” in health psychology (40, 41). For example, higher EA was associated with a healthier lifestyle, an occupation with safer working conditions, and better access to health care (5, 42, 43). A recent natural experiment exploiting the raising of school-leaving age in the United Kingdom changes found evidence of causal associations of increased schooling on a variety of health and socioeconomic factors (44). College graduates lived much healthier lives than those with less education, which was consistent with our results (45).
Meanwhile, several previous studies indicated smoking can inhibit immunity (46, 47). A study of 35 individuals showed serum immunoglobulin G and immunoglobulin M levels rose significantly in those who ceased smoking cigarettes (46). Studies have confirmed that the frequency of positive thyroperoxidase antibody in never smokers was significantly higher than in smokers (14). In addition to its effects on autoimmunity, tobacco smoke appears to have additional, mild effects on hormonogenesis. The lower prevalence of elevated TSH concentrations may be due to both the effects of smoke on hormonogenesis and the decreased autoimmune hypothyroidism in smokers (15). In addition, it may also be due to the mild thyroid autonomy and growth seen in smokers or to an altered pituitary set point (15). Increased sympathetic activity in smokers can also contributed to lower TSH levels (48). Thyroid dysfunction is preventable; those with modifiable risk factors can be targeted for primary prevention. In the future, society should promote the improvement of EA, and government should take more measures to let more people receive higher EA. At the same level of education, more information about the harmful effects of tobacco and smoking cessation should be disseminated in schools and educational institutions to encourage healthier lifestyles. EA and smoking are modifiable lifestyles. Improving EA and eliminating smoke exposure may help prevent low-normal TSH measurements (15), which could risk the further development of thyroid diseases, such as hyperthyroidism. Our study was not without limitations. First, our MR study was unable to incorporate further possible mediating factors. The analysis with NHANES data showed that smoking, BMI, and SBP are all possible mediators on the association between EA and TSH. However, MR analysis showed that BMI and SBP were not associated with TSH, and only smoking was included in the MR mediation analysis. Second, given that the participants were of non-Hispanic White ancestry in the NHANES study and European descent in the MR analysis, the results may be difficult to extend to other ethnic groups and caution should made in the interpretation. Finally, few methods are available to assess instrument strength in the 2-sample multivariable MR analysis, leading to difficulty in evaluating the potential vulnerability to weak instrument bias (35).
In conclusion, this study showed that EA has an effect on TSH that is partly mediated by smoking. This finding provides strategies for better prevention of and intervention in thyroid dysfunction.
Acknowledgments
We sincerely thank the compilers of the GWAS summary data sets and the researchers and participants of NHANES for data collection and management of data resources.
Funding
This work was supported by the National Natural Science Foundation of China (grant Nos. 82173624, 81872712, and 81670721), the Natural Science Foundation of Shandong Province (grant No. ZR2019ZD02), and the Taishan Scholar Project of Shandong Province (grant No. tsqn202211025).
Author Contributions
Z.S.Y. and H.Q.Z. conceived the presented idea. J.Y. and X.L. performed the computations and manuscript writing. X.H.W., H.Z.Z., X.Y.L., Y.Y.W., and G.Y.T. were involved in the acquisition of the data. M.L.T., X.M., C.J.K., Q.Q.Y., J.Y.L., and L.Z. were involved in the interpretation of the data. All authors contributed to the article and approved the submitted version.
Disclosures
The authors declare that the research was conducted in the absence of any commercial or financial relationships that could be construed as a potential conflict of interest.
Data Availability
The original contributions presented in this study are included in the article/Supplementary material; further inquiries can be directed to the corresponding authors.
References
Abbreviations
- AA
associate of arts
- BMI
body mass index
- DBP
diastolic blood pressure
- EA
educational attainment
- FT4
free thyroxine
- GWAS
genome-wide association studies
- ISCED
International Standard Classification of Education 1997
- IVW
inverse variance-weighted
- MR
mendelian randomization
- MR-RAPS
MR Robust-Adjusted Profile Score
- NHANES
National Health and Nutrition Examination Survey
- OR
odds ratio
- Q
quartile
- SBP
systolic blood pressure
- SNP
single-nucleotide polymorphism
- SNV
single-nucleotide variation
- TSH
thyrotropin
- UKBB
UK Biobank
Author notes
Jie Yuan and Xue Liu contributed equally to this work and share first authorship.
