


Abstract
Although cognitive impairment in nonalcoholic fatty liver disease (NAFLD) has received attention in recent years, little is known about detailed cognitive functions in histologically diagnosed individuals.
This study aimed to investigate the association of liver pathological changes with cognitive features and further explore the underlying brain manifestations.
We performed a cross-sectional study in 320 subjects who underwent liver biopsy. Among the enrolled participants, 225 underwent assessments of global cognition and cognitive subdomains. Furthermore, 70 individuals received functional magnetic resonance imaging scans for neuroimaging evaluations. The associations among liver histological features, brain alterations, and cognitive functions were evaluated using structural equation model.
Compared with controls, patients with NAFLD had poorer immediate memory and delayed memory. Severe liver steatosis (odds ratio, 2.189; 95% CI, 1.020-4.699) and ballooning (OR, 3.655; 95% CI, 1.419-9.414) were related to a higher proportion of memory impairment. Structural magnetic resonance imaging showed that patients with nonalcoholic steatohepatitis exhibited volume loss in left hippocampus and its subregions of subiculum and presubiculum. Task-based magnetic resonance imaging showed that patients with nonalcoholic steatohepatitis had decreased left hippocampal activation. Path analysis demonstrated that higher NAFLD activity scores were associated with lower subiculum volume and reduced hippocampal activation, and such hippocampal damage contributed to lower delayed memory scores.
We are the first to report the presence and severity of NAFLD to be associated with an increased risk of memory impairment and hippocampal structural and functional abnormalities. These findings stress the significance of early cognitive evaluation in patients with NAFLD.
Nonalcoholic fatty liver disease (NAFLD) is the most common chronic liver disease affecting nearly 32.4% of the population worldwide (1). NAFLD comprises a spectrum of diseases, ranging from nonalcoholic fatty liver, nonalcoholic steatohepatitis (NASH), and liver cirrhosis, which can increase the risk of hepatocellular carcinoma (2). In addition to its liver-related consequences, NAFLD is related to altered gut microbiota, visceral adipose tissue accumulation, insulin resistance, oxidative stress, and chronic inflammation, which have important roles in the development of extensive extrahepatic effects such as diabetes, cardiovascular disease, and chronic kidney disease (3, 4).
With an aging population and a lack of efficient prevention interventions, cognitive impairment places tremendous social and economic burdens worldwide. According to its severity, cognitive impairment can be classified as mild cognitive impairment and dementia (5). Neuropsychological scales are the most commonly used methods to measure global cognition and a variety of cognitive subdomains. It has been estimated that 47 million individuals worldwide currently have dementia, and that this number will climb to 131.5 million by 2050 (6). Early evaluation and prevention of the related risk factors are key to optimal management of cognitive dysfunction (7). In recent years, the association between NAFLD and cognitive impairment has received much attention (8). A meta-analysis indicated that individuals with NAFLD had an overall 1.44-fold increased risk of cognitive impairment compared with healthy controls (9). Nonetheless, most studies to date have included patients diagnosed with ultrasound or computed tomography. A recent case control study of 80 patients with biopsy-proven NAFLD demonstrated a negative relationship between ballooning grade and Mini-Mental State Examination (MMSE) scores for global cognition; however, the cognitive subdomains were not comprehensively assessed (10). Before now, the relationship between liver histological characteristics and detailed cognitive changes has been uncovered.
Brain imaging techniques offer a noninvasive approach to investigate deep brain morphological and functional alterations, and thus can evaluate brain changes associated with cognitive decline. Different brain structures may play roles underlying different cognitive processes (11), and brain function abnormalities are considered early manifestations underlying cognitive dysfunction (12). Previous imaging research have revealed that patients with NAFLD had smaller total brain volume, decreased cerebral blood flow, and greater arterial stiffness than subjects without NAFLD (13-15). To date, the research has been limited to the whole-brain structure and lacked precise quantification of specific brain regions. In addition, the association of NAFLD with brain functional alterations has never been determined.
The present study used comprehensive cognitive tests and functional magnetic resonance imaging (fMRI) scans in individuals undergoing liver biopsy to investigate the cognitive features as well as brain structural and functional changes in subjects with histologically diagnosed NAFLD. The findings of this study are anticipated to bridge the gap between NAFLD and markers of cognitive function as well as brain health and to raise the importance of early cognitive evaluation in patients with NAFLD.
Materials and Methods
Study Population
Individuals who were planning to undergo bariatric surgery and willing to receive cognitive assessments in Drum Tower Hospital affiliated to Nanjing University Medical School were recruited from May 2020 to September 2022. Participants eligible for our study were aged 20 to 75 years and had more than 6 years of education. Subjects were excluded if they (1) consumed excessive alcohol (≥210 g/wk for males or ≥140 g/wk for females); (2) had a history of other liver diseases including chronic hepatitis virus infection, biliary obstructive diseases or autoimmune hepatitis; (3) had untreated thyroid diseases; (4) were in a state of anxiety or depression; or (5) had history of malignancy. Among the enrolled participants, those who had no contraindications further underwent brain fMRI scans. A flow chart of participant selection is provided in Supplementary Fig. S1 (16).
Demographic data and lifestyle factors were collected on standardized questionnaires by self-report at enrollment. Body weight, height, waist circumference, and blood pressure were measured according to a standard protocol and body mass index (BMI) was calculated as weight (kilograms)/square of height (meters). Visceral fat area was tested by the In-body 770 Body Analyzer (InBody Co, LTD) as a measure of visceral obesity.
The study protocol was approved by the Ethics Committee of the Drum Tower Hospital Affiliated to Nanjing University Medical School and registered on ClinicalTrails.gov (NCT 05563259). Before participating in the protocol, all participants signed an informed consent form, as required by the Helsinki Declaration. All authors had access to the study data and reviewed and approved the final manuscript.
Liver Pathology Examination and Patient Classification
Liver histology was assessed according to the Nonalcoholic Steatohepatitis Clinical Research Network scoring system by 2 proficient pathologists (17). Controls were defined as subjects with <5% steatosis and no clinical, biochemical, or imaging evidence of fatty liver disease. NAFLD was defined by the presence of steatosis in at least 5% of hepatocytes as well as the absence of excessive alcohol consumption or other chronic liver diseases. Steatosis scores were calculated based on the percentage of hepatocytes with fat droplets as S0 (<5%), S1 (5-33%), S2 (>33-66%), and S3 (>66%). Lobular inflammation (LI) was graded by the number of foci of as LI0 (none), LI1 (<2 foci), LI2 (2-4 foci), and LI3 (>4 foci). Hepatocyte ballooning was scored as: 0 (none), 1 (few balloon cells), and 2 (prominent ballooning). Fibrosis was scored as F0 (none), F1 (perisinusoidal or periportal fibrosis), F2 (perisinusoidal and portal/periportal fibrosis), F3 (bridging fibrosis), and F4 (cirrhosis). The NAFLD activity score (NAS) was calculated as the sum of the steatosis, lobular inflammation, and ballooning scores. Participants diagnosed with NAFLD were further categorized into non-NASH (NAS <5) and NASH (NAS ≥5) groups.
Cognitive Assessments
Global cognitive status and specific cognitive subdomains were evaluated in all participants. Global cognition was assessed using the Chinese version of the MMSE and the Beijing version of the Montreal Cognitive Assessment (MoCA). The normal range for the MMSE score is 27 to 30 (18), and for the MoCA score is 26 to 30 (19). Multiple cognitive subdomains, including the immediate memory, visuospatial constructional, language, attention, and delayed memory subdomains were evaluated using the Chinese version of the Repeatable Battery for the Assessment of Neuropsychological Status (RBANS) (20). Raw scores on all cognitive subdomains were converted to age-adjusted scores according to the RBANS scoring tables. A specific subdomain score below 85 was regarded as probable cognitive impairment in that domain (21-23). All these tests were administered and scored by skilled examiners in a fixed order in a quiet room.
MRI Data Acquisition and Processing
Image data were acquired using a 3.0T magnetic resonance imaging (MRI) scanner (Ingenia 3.0T CX, Philips Medical Systems, The Netherlands) with an 8-channel head coil. Image processing was performed using MATLAB (R2018a, MathWorks). For further details regarding the materials used, please refer to the Supplementary Material (16).
Biochemical Measurements
Blood samples were collected from subjects after an overnight fast of at least 8 hours. Serum concentrations of total cholesterol, triglyceride, high-density lipoprotein cholesterol, low-density lipoprotein cholesterol, alanine aminotransferase (ALT), aspartate aminotransferase (AST), gamma-glutamyl transferase were measured using an autoanalyzer (Abbott Laboratories, USA). Glycated hemoglobin (HbA1c) concentrations were measured by high-performance liquid chromatography (HLC-73G8, Tosoh, Japan). Fasting blood glucose (FBG) was measured using a hexokinase method (TBA-200FR, Tokyo, Japan). Fasting insulin (FINS) was determined by electrochemiluminescence immunoassay (Roche, USA). C-reactive protein was measured using the nephelometric method on the Siemens Dade Behring BN II analyzer (Siemens Healthcare Diagnostics, Deerfield, IL). Homeostasis Model Assessment of Insulin Resistance (HOMA-IR) was calculated using the formula: FINS (μIU/mL) × FBG (mmol/L)/22.5 (24).
Statistical Analysis
Data for clinical variables and cognitive assessment results are presented as the mean ± standard deviation, unless otherwise indicated. Continuous variables in 2 groups were compared by independent-samples t-tests, whereas continuous variables in 3 or more groups were compared by one-way ANOVA and post hoc Dunnett T3 tests. Dichotomous variables were compared by χ2 tests. Propensity score matching was used to match control and NAFLD groups based on age and education level. The association of liver pathological features with cognitive dysfunction was estimated by binary logistic regression analysis. Model 1 consisted of demographics characteristics including age, sex, and education level, which have been widely recognized to closely relate to cognition. Model 2 included the factors in model 1, along with anthropometric measures differing significantly between control and NAFLD groups. Model 3 included the variables in model 2 and those factors showing significant differences between control and NAFLD groups. These analyses were undertaken with SPSS v22.0 software (IBM, Armonk, NY, USA). P < .05 (two-tailed) was considered statistically significant.
Regarding MRI data, differences in brain structure and function were compared using analyses of covariance. Structures were compared with age, sex, education, and estimated total intracranial volume as covariates, with multiple comparisons performed with Bonferroni correction. The significance threshold correction of fMRI was conducted according to Gaussian random field theory with a voxel level of P < .001 and a cluster level of P < .05. The analyses were conducted with DPABI software.
The involvement of brain alterations in the association of liver pathological characteristics with cognitive function were investigated using a structural equation model (SEM). The relationships between these variables were investigated using Pearson correlation and then determined on the basis of SEM. SEM analysis was performed via the robust maximum likelihood evaluation method using AMOS 22.0 (Amos Development Co., Greene, ME, USA). P < .05 was considered statistically significant.
Results
Participant Overview
A total of 320 participants who underwent liver biopsy were recruited and 301 of them completed cognitive assessments. After matching for age, sex, and education level, 225 individuals (mean age, 32.8 ± 7.4 years; mean education level, 13.8 ± 2.6 years) were included in the final analysis (control: n = 35; NAFLD: n = 190). The clinical characteristics are summarized in Table 1. Compared with the control group, NAFLD patients had higher waist circumference and blood pressure. In terms of metabolic indicators, patients with NAFLD had higher ALT, AST, HbA1c, FBG, FINS and HOMA-IR levels than controls. There was no significant difference in serum lipid levels. The liver pathological characteristics of all participants are listed in Supplementary Table S1 (16).
Demographic and clinical characteristics of all participants
| Control (n = 35) | NAFLD | P value | ||||||
|---|---|---|---|---|---|---|---|---|
| Total (n = 190) | Non-NASH (n = 136) | NASH (n = 54) | Control vs NAFLD | Control vs non-NASH | Control vs NASH | Non-NASH vs NASH | ||
| Demographic factors | ||||||||
| Age (y) | 34.7 ± 8.6 | 32.4 ± 7.1 | 32.7 ± 7.2 | 31.6 ± 6.8 | .134 | .487 | .202 | .691 |
| Sex (male, n, %)a | 7(20.0) | 59(31.1) | 44(32.4) | 15(27.8) | .187 | .154 | .406 | .539 |
| Education (y) | 13.4 ± 3.2 | 13.9 ± 2.5 | 13.8 ± 2.6 | 14.3 ± 2.2 | .293 | .895 | .419 | .467 |
| Smoking (n, %)a | 8(22.9) | 42(22.1) | 34(25.0) | 8(14.8) | .922 | .793 | .334 | .127 |
| Drinking (n, %)a | 2(5.7) | 10(5.3) | 9(6.6) | 1(1.9) | .913 | .846 | .324 | .185 |
| BMI (kg/m2) | 35.9 ± 6.6 | 37.6 ± 5.7 | 37.2 ± 5.8 | 38.5 ± 5.3 | .131 | .658 | .168 | .385 |
| Waist circumference (cm) | 110.5 ± 17.2 | 115.8 ± 13.6 | 114.6 ± 13.8 | 119.0 ± 12.8 | .044 | .496 | .044 | .102 |
| Visceral fat area (cm2) | 202.6 ± 43.7 | 208.9 ± 45.5 | 206.9 ± 45.4 | 214.7 ± 45.8 | .505 | .957 | .610 | .687 |
| SBP (mm Hg) | 133.5 ± 20.5 | 143.1 ± 20.8 | 142.4 ± 20.6 | 144.6 ± 21.5 | .013 | .072 | .048 | .894 |
| DBP (mm Hg) | 86.4 ± 15.5 | 91.9 ± 14.4 | 91.5 ± 13.9 | 92.8 ± 15.8 | .044 | .229 | .180 | .937 |
| Comorbidities | ||||||||
| Diabetes (n, %)a | 8(22.9) | 60(31.6) | 42(30.9) | 18(33.3) | .302 | .352 | .288 | .743 |
| Hypertension (n, %)a | 13(37.1) | 105(55.3) | 76(55.9) | 29(53.7) | .049 | .048 | .126 | .785 |
| Obesity (n, %)a | 33(94.3) | 182(95.8) | 129(94.9) | 53(98.1) | .657 | 1.000 | .559 | .444 |
| Hyperlipidemia (n, %)a | 14(40.0) | 114(60.0) | 79(58.1) | 35(64.8) | .040 | .060 | .029 | .417 |
| Drug use | ||||||||
| Antihypertensive drugs (n, %)a | 2(5.7) | 2(1.1) | 2(1.5) | 0(0.0) | .115 | .186 | .152 | 1.000 |
| Hypoglycemia drugs (n, %)a | 3(8.6) | 15(7.9) | 14(10.3) | 1(1.9) | 1.000 | 1.000 | .296 | .071 |
| Lipid-lowering drugs (n, %)a | 0(0.0) | 2(1.1) | 2(1.5) | 0(0.0) | 1.000 | 1.000 | 1.000 | 1.000 |
| Metabolic-related characteristics | ||||||||
| ALT (U/L) | 20.3 [15.5, 42.1] | 44.7 [29.4, 73.4] | 40.5 [25.1, 60.4] | 60.3 [35.8, 102.7] | <.001 | <.001 | <.001 | .001 |
| AST (U/L) | 20.0 [14.9, 27.9] | 27.8 [20.3, 42.1] | 29.5 [18.5, 38.2] | 35.9 [26.7, 54.0] | <.001 | .032 | <.001 | <.001 |
| GGT (U/L) | 53.6 [31.1, 69.2] | 65.8 [40.0, 79.7] | 62.8 [39.9, 79.6] | 67.0 [40.4, 80.9] | .103 | .192 | .047 | .369 |
| HbA1c (%) | 5.7 ± 0.8 | 6.3 ± 1.5 | 6.3 ± 1.6 | 6.4 ± 1.2 | <.001 | .004 | .002 | .863 |
| Fasting glucose (mmol/L) | 5.3 ± 1.3 | 6.1 ± 2.3 | 6.0 ± 2.3 | 6.4 ± 2.4 | .003 | .044 | .019 | .710 |
| Fasting insulin (mIU/mL) | 15.7 [10.8, 24.6] | 25.5 [17.8, 32.5] | 24.2 [16.3, 31.3] | 29.2 [20.7, 36.8] | <.001 | .007 | <.001 | .058 |
| Triglycerides (mmol/L) | 1.4 [1.0, 1.6] | 1.6 [1.2, 2.3] | 1.6 [1.2, 2.2] | 1.7 [1.3, 2.5] | .022 | .156 | .032 | .752 |
| Total cholesterol (mmol/L) | 4.99 ± 1.14 | 5.05 ± 1.42 | 4.99 ± 1.36 | 5.20 ± 1.55 | .825 | 1.000 | .848 | .762 |
| HDL cholesterol (mmol/L) | 1.16 ± 0.30 | 1.08 ± 0.25 | 1.08 ± 0.25 | 1.10 ± 0.25 | .088 | .054 | .060 | .040 |
| LDL cholesterol (mmol/L) | 3.04 ± 0.94 | 2.92 ± 0.64 | 2.93 ± 0.66 | 2.90 ± 0.59 | .358 | .169 | .178 | .098 |
| C-reactive protein (mg/L) | 9.0 [4.4, 14.8] | 8.0 [4.3, 15.9] | 7.8 [4.3, 15.1] | 10.6 [4.2, 18.3] | .737 | .645 | .988 | .690 |
| HOMA-IR | 3.9 [2.2, 8.1] | 6.3 [4.5, 9.2] | 5.9 [4.1, 8.6] | 7.1 [5.7, 11.1] | <.001 | .007 | <.001 | .022 |
| Global cognition | ||||||||
| MMSE | 29.4 ± 0.7 | 29.1 ± 0.9 | 29.2 ± 0.9 | 29.1 ± 0.9 | .161 | .461 | .202 | .790 |
| MoCA | 28.7 ± 0.8 | 28.4 ± 1.0 | 28.4 ± 1.0 | 28.4 ± 0.8 | .118 | .236 | .490 | .967 |
| RBANS total scores | 99.7 ± 10.2 | 96.9 ± 8.6 | 97.4 ± 9.0 | 95.7 ± 7.3 | .084 | .512 | .139 | .484 |
Data are presented as mean ± SD, median [IQR], or n (%).
Abbreviations: ALT, alanine aminotransferase; AST, aspartate aminotransferase; BMI, body mass index; DBP, diastolic blood pressure; GGT, gamma-glutamyl transferase; HbA1c, glycated hemoglobin; HDL, high-density lipoprotein; HOMA-IR: Homeostasis Model Assessment of Insulin Resistance; LDL, low-density lipoprotein; MMSE, Mini-Mental State Examination; MoCA, Montreal Cognitive Assessment; RBANS, Repeatable Battery for the Assessment of Neuropsychological Status; SBP, systolic blood pressure.
aPearson χ2 analysis for dichotomous variables.
Patients With NAFLD had Worse Memory Function Compared With Controls
The global cognitive levels were within normal ranges and no significant differences were observed in MMSE, MoCA, or RBANS total scores between the control and NAFLD groups (Table 1). Evaluation of cognitive subdomains showed that immediate memory (85.0 ± 6.6 vs 89.0 ± 9.9; P = .026) and delayed memory (90.9 ± 8.1 vs 95.8 ± 6.2; P = .001) scores were significantly lower in patients with NAFLD than in controls. In addition, the proportion of subjects with immediate memory impairment (63.7% vs 37.1%; P = .003) and delayed memory impairment (21.1% vs 5.7%; P = .032) were higher in the NAFLD than in the control group. Scores on the visuospatial constructional, language, and attention subdomains did not differ significantly between the control and NALFD groups (Fig. 1).

Assessments of cognitive domains in patients with NAFLD and control participants. (A) The scores of immediate memory, visuospatial constructional, language, attention, and delayed memory in the 2 groups. (B) The proportion of immediate memory and delayed memory impairment in the 2 groups. *P < .05 was considered significant.
The Severity of Liver Pathological Changes was Related to the Degree of Memory Impairment
Further, to investigate the association of liver histology with memory impairment, memory functions were compared in participants with specific pathological changes, including severity of steatosis, lobular inflammation, hepatocellular ballooning, and fibrosis. Evaluation of steatosis grades showed that the percentages of patients with immediate (73.5% vs 55.7%; P = .025) and delayed (40.8% vs 12.5%; P < .001) memory impairment were significantly higher in those with S3 (>66%) than in S0-2 (≤66%) steatosis. In addition, the percentage of subjects with immediate memory impairment was significantly higher in those with any grade of hepatocyte ballooning than in those without hepatocyte ballooning (63.5% vs 34.6%; P = .005). Comparison of grades of lobular inflammation and fibrosis showed no differences in the rates of memory impairment (Fig. 2). Regarding cognitive assessment scores, individuals with S3 (>66%) steatosis demonstrated lower immediate memory (83.3 ± 3.1 vs 86.3 ± 8.0; P < .001) and delayed memory (88.3 ± 8.1 vs 92.6 ± 7.7; P = .001) scores than those with S0-2 (≤66%) steatosis (Supplementary Fig. S2) (16).
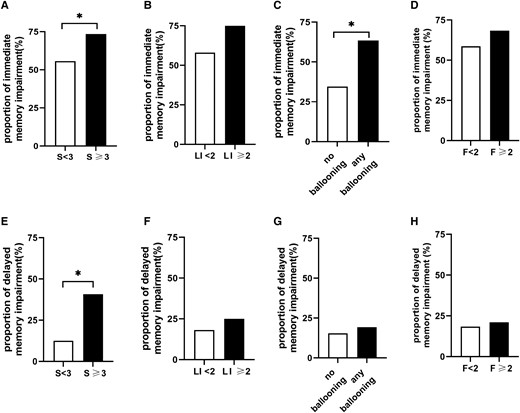
Proportions of subjects with immediate and delayed memory impairment as a function of histologically determined subscores. (A-D) Proportion of immediate memory impairment. (E-H) Proportion of delayed memory impairment. F, fibrosis grade; LI, lobular inflammation grade; S, steatosis grade. *P < .05 was considered significant.
Logistic regression analysis showed that severe steatosis stage (S3) was related to immediate memory impairment when adjusting for age, sex, and education in model 1 (odds ratio [OR], 2.160; 95% CI, 1.059-4.408; P = .034). The association remained significant after adjusting for BMI, waist circumference, hypertension, and hyperlipidemia in model 2 (OR, 2.285; 95% CI, 1.098-4.759; P = .027) and after additional adjustment for HbA1c, HOMA-IR, ALT, and AST in model 3 (OR, 2.189; 95% CI, 1.020-4.699; P = .044). Ballooning was also associated with a higher proportion of immediate memory impairment (OR, 4.024; 95% CI, 1.612-10.048; P = .003) in model 1. After further adjustment in model 2 (OR, 3.656; 95% CI, 1.442-9.271; P = .006) and model 3 (OR, 3.655; 95% CI, 1.419-9.414; P = .007), a significant association was still noted. In addition, the severe steatosis stage was significantly associated with higher proportion of delayed memory impairment in model 1 (OR, 4.604; 95% CI, 2.202-9.628; P < .001), model 2 (OR, 4.808; 95% CI, 2.245-10.300; P < .001), and model 3 (OR, 5.498; 95% CI, 2.311-13.081; P < .001). In light of higher NAS indicating more severe disease (25), the associations between NAS and memory impairment were also evaluated. The multivariable-adjusted model indicated that higher NAFLD activity scores were associated with higher proportion of immediate memory (OR, 1.514; 95% CI, 1.169-1.960; P = .002) and delayed memory impairment (OR, 1.657; 95% CI, 1.162-2.365; P = .005) (Supplementary Table S2) (16).
NASH was Related to Higher Risk of Memory Impairment
The association of NASH with memory function was evaluated next. As shown in Fig. 3, compared with the control group, the non-NASH group had lower delayed memory scores (91.3 ± 8.0 vs 95.8 ± 6.2; P = .002), and the NASH group had both lower immediate memory (83.5 ± 4.0 vs 89.0 ± 9.9; P = .009) and delayed memory scores (89.7 ± 8.1 vs 95.8 ± 6.2; P < .001). Besides, the NASH group had a higher proportion of immediate memory impairment (74.1% vs 37.1%; P = .001) and delayed memory impairment (31.5% vs 5.7%; P = .004) than the control group. Notably, a higher proportion of delayed memory impairment was found in the NASH group when compared with the non-NASH group (31.5% vs 16.9%; P = .026).
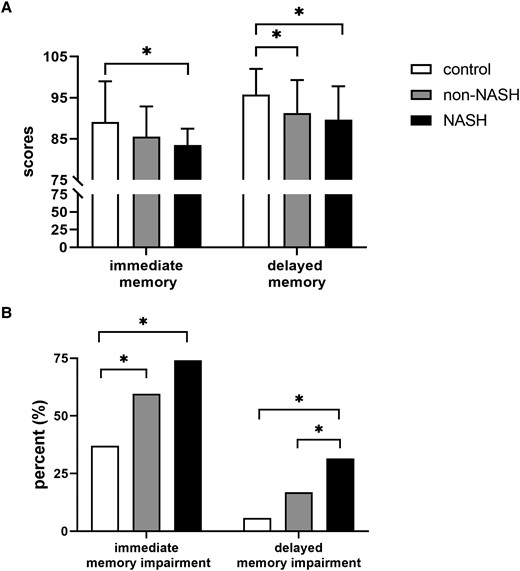
Memory assessments of all participants. (A) Immediate memory and delayed memory scores in control, non-NASH, and NASH groups. (B) Proportions of subjects with immediate and delayed memory impairment in the control, non-NASH, and NASH groups. *P < .05 was considered significant.
Taking control as the reference group, the risk of immediate memory impairment (OR, 4.582; 95% CI, 1.635-12.838; P = .004) and delayed memory impairment (OR, 6.512; 95% CI, 1.229-34.512; P = .028) was markedly higher in the NASH group after adjustment for all variables mentioned previously. In addition, HOMA-IR was associated with delayed memory impairment (OR, 1.110; 95% CI, 1.016-1.213; P = .021) (Supplementary Table S3) (16).
Impaired Hippocampal Structure and Function Were Found in Patients With NASH
Underlying brain manifestations in these subjects were analyzed using MRI scans. Among the 75 participants undergoing fMRI scans, 70 with complete and valid MRI data were included in the analyses (control: n = 12; non-NASH: n = 37; NASH: n = 21). The baseline characteristics of these subjects are shown in Supplementary Table S4 (16). Patients in each group who underwent MRI did not differ in age, sex, or education level from that of the total population.
Regarding the brain structure, no significant differences were observed in the total intracranial volume, gray matter, white matter, cerebrospinal fluid, and white matter hyperintensity volumes among the 3 groups (Supplementary Table S5) (16). Given the crucial role of hippocampus in cognitive formation, alterations in the hippocampus were focused on. It was noteworthy that the volume of the left hippocampus was significantly lower in the NASH than in the non-NASH group (3234.1 ± 275.5 mm3 vs 3427.7 ± 237.0 mm3; P = .004) after controlling for age, sex, education, and total intracranial volume (Supplementary Table S6) (16). Further analysis of left hippocampal subregions demonstrated that the volumes of 2 subfields were smaller in the NASH group than in the non-NASH group (left presubiculum: 289.3 ± 38.9 mm3 vs 313.4 ± 28.1 mm3 vs, P = .013; left subiculum: 405.0 ± 31.7 mm3 vs 439.0 ± 38.4 mm3, P = .003) (Fig. 4 and Supplementary Table S6) (16). No difference was found in brain volumes between controls and patients with NAFLD.
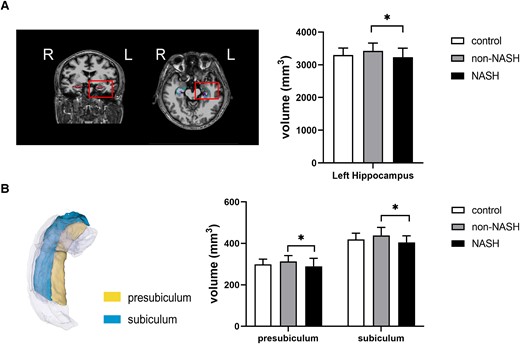
Volumes of left hippocampus and its subfields in the control, non-NASH, and NASH groups. (A) Volumes of the entire left hippocampus. (B) Volumes of the left subiculum and the left presubiculum. L, left. *P < .05 was considered significant.
In respect to fMRI, all 3 groups showed bilateral activation in response to odor stimulation. Decreased activation in the left hippocampus was observed in patients with NAFLD compared with the control subjects. Moreover, the NASH group showed significantly decreased left hippocampal activation than the non-NASH group (with Gaussian random field correction; voxel level: P < .001; cluster level: P < .05; and cluster size threshold 7 voxels) (Fig. 5 and Supplementary Table S7) (16).
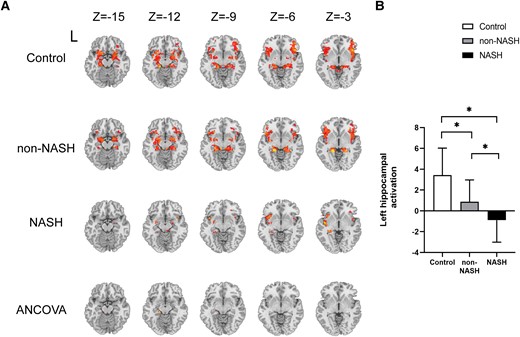
Task-based brain activation in the control, non-NASH, and NASH groups. (A-B) Brain activation in the left hippocampus of subjects in the three groups. Cluster size: 8 voxels. L, left. *P < .05 was considered significant.
Hippocampal Impairment was Involved in the Association of Liver Pathological Severity With Delayed Memory
The contribution of hippocampal alterations to the association between liver pathological changes and cognitive function was assessed using a structural equation model. Hippocampal abnormalities in the model were first screened with the Pearson correlation test (Supplementary Table S8) (16) and finally determined by a structural equation model. In the established model (Fig. 6), NAFLD activity scores were negatively associated with left hippocampal activation (estimate/standard error [EST/SE] = −5.408, P < .001), and left hippocampal activation was positively associated with delayed memory scores (EST/SE = 2.604, P = .009). In addition, higher NAS scores were associated with smaller left subiculum volume (EST/SE = −2.210, P = .027), and smaller left subiculum was associated with poorer delayed memory (EST/SE = 1.987, P = .047). These findings indicated that the severity of liver pathological changes was associated with poorer delayed memory and that structural and functional impairments in the left hippocampus were involved in this relationship. The model showed a good fit (χ2/degrees of freedom = 1.361 <3, goodness of fit index = 0.981 >0.9, Tucker Lewis index = 0.941 >0.9, comparative fit index = 0.980 >0.9, and root mean square error of approximation = 0.072 <0.08).
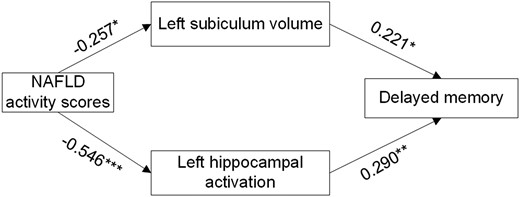
Structural equation model defining the hippocampal alterations involved in the association of NAS with delayed memory. Numbers next to arrow lines represent standardized path coefficients. NAS, nonalcoholic fatty liver disease activity score. *P < .05, **P < .01, and ***P < .001 were considered significant.
Discussion
To our knowledge, this is the first study to report the detailed cognitive function and brain alterations in patients with histologically diagnosed NAFLD. This study found that, compared with control individuals, patients with NAFLD had poorer cognitive function, especially poorer memory, with these deficits being more pronounced in patients with NASH. Besides, the severity of liver steatosis and ballooning was associated with memory impairment. This study also found smaller total left hippocampus and its subregion volumes as well as decreased left hippocampal activation in patients with NASH. Further analysis indicated that hippocampal damage was involved in the adverse effects of NAFLD on delayed memory.
Research regarding the cognitive function in NAFLD is attracting growing interest in recent years. Previous studies have found poor global cognition of lower MMSE and MoCA scores in patients with NAFLD (10, 26). Several other studies assessing cognitive domain function in patients with NAFLD showed impairment in several specific subdomains, including attention, executive function, and working memory (27, 28). Although these studies reported that patients with NAFLD were prone to cognitive impairment, NAFLD in these cohorts was not pathologically confirmed. Thus, the present research evaluated detailed cognitive function in subjects with biopsy-diagnosed NAFLD and found that these patients had lower memory scores and a higher proportion of memory impairment than BMI-matched controls. This finding was consistent with previous studies. These patients, however, did not show global cognitive decline, perhaps because of the young age of the participants. Indeed, memory impairment is recognized as an early sign of cognitive decline and dementia, before the appearance of other objective impairments (29). Thus, the present study highlighted the importance of early cognitive evaluation in patients with NAFLD before the onset of clinically measurable cognitive impairment.
The current study further found that the liver pathologic characteristics of the liver were associated with cognitive performance. The proportion of memory impairment was found to be higher in the NASH group, but not in the non-NASH group, compared with the control group. As a progressive stage of disease, NASH frequently accompanies extrahepatic effects, including obesity, dyslipidemia, type 2 diabetes, and metabolic syndrome (30). Our findings presented that cognitive impairment was another extrahepatic effect of NASH. Further detailed analysis of the pathological features in these participants showed that severe stages of hepatic steatosis and hepatocyte ballooning were related to higher risk of memory impairment. The mechanisms underlying cognitive impairment during NAFLD are not well covered. Obesity, metabolic disorders, subclinical inflammation, and insulin resistance may lead to neurodegeneration and clinical or subclinical cerebrovascular changes in NAFLD, and these changes are closely related to brain structure and function (31-34). In our study, levels of HOMA-IR were significantly higher in patients with NAFLD than in the controls. Furthermore, HOMA-IR was associated with delayed memory impairment in the multivariate regression. Insulin resistance is one of the primary mechanisms involved in the pathogenetic development of hepatic steatosis and its progression to NASH (35, 36). Several studies have also found that insulin resistance was related to cognitive dysfunction (37, 38). Insulin has many important physiological functions, including affecting brain biological energy, increasing synaptic viability and neurotransmitters, and modulating vascular function (39). Accumulating evidence has demonstrated that multiple markers, including visceral adiposity, inflammatory factors, and neurofilament were associated with reduced cognitive scores and cognitive impairment (40-46). The cytokines produced by adipose tissue, such as leptin, adiponectin, and inflammatory factors, have an important role in cognitive and memory functions (34). Inflammatory factors can cross the brain–blood barrier and affect the activity of nerve cells, leading to cognitive decline (47, 48). More research with larger sample sizes is needed to detect the association between NAFLD and these markers.
Rapid developments in MRI technology offer opportunities to accurately segment the brain and better explore the roles of aberrant brain structure and function underlying cognitive impairment. One research study measuring brain health by MRI found that NAFLD was associated with lower total tissue volume and reduced gray matter cerebral blood flow (14). Similarly, in a study published in 2018, NAFLD was found to accelerate brain aging by 4.2 years compared with adults without NAFLD (15). These studies, however, did not include detailed evaluation of brain structures that may play crucial roles in specific cognitive performance. The present study used MRI to evaluate whole-brain structure and hippocampal subregions, thus allowing the determination of potential brain changes associated with NAFLD. Whole left hippocampal volume was found to be lower in patients with NASH and further hippocampal segmentation revealed that the volumes of the left subiculum and presubiculum were smaller in patients with NASH. In contrast to previous studies, however, these patients did not show alterations indicative of whole-brain atrophy. The hippocampus is essential for memory and learning, and the hippocampal damage occurs before the onset of cognitive decline symptoms (42, 49-51). In addition, the subiculum is crucial for cognitive function and the changes in its volume were predictive of conversion from normal cognition to mild cognitive impairment (52). A study in a large population-based cohort reported that smaller volumes of the hippocampal presubiculum and subiculum were related to the risk of dementia (51). Thus, our study not only verified the smaller hippocampal volume in NASH but also localized it to more detailed hippocampal subregions. In addition, the present study found decreased left hippocampal activation in the NASH group during task phases. Abnormal hippocampal activation was previously found to be an early sign of brain alterations in patients with Alzheimer disease and diabetes (12, 42, 49, 53). The present findings suggested that alterations in hippocampal function were also indicative of early brain changes in individuals with NAFLD.
Further path analysis revealed that individuals with higher NAS scores were susceptible to having smaller left subiculum volumes as well as decreased left hippocampal activation, and that these abnormalities were associated with poor delayed memory. It demonstrated that hippocampal damage was an important mediating variable between NAFLD and cognitive dysfunction. Our study provided new insight into memory impairment in patients with NAFLD and more trials are needed to further confirm these relationships.
The key strengths of the present study include using detailed cognitive scales and brain fMRI in subjects with pathologically confirmed NAFLD. In this study, multiple abnormalities in memory function and hippocampal alterations in subjects with NAFLD are described. Importantly, associations of these abnormalities with the histological phenotype and severity of NAFLD were identified. Some limitations of the present study should be acknowledged. This was an observational study with a cross-sectional design that did not permit the determination of a causal sequence involving NAFLD, cognitive dysfunction and brain alterations. All the patients with NAFLD in this study were overweight or obese young individuals who were planning to undergo bariatric surgery; therefore, our results may not be generalizable to the general population. In addition, the number of subjects who underwent MRI scans was relatively small, although their demographic characteristics were representative of the total population. Further prospective studies with larger sample sizes are needed to validate these findings.
In conclusion, the present study demonstrated that severity of histologic disease in patients with NAFLD was associated with cognitive impairment as well as hippocampal structural and functional abnormalities. Given the high prevalence of NAFLD and the huge health and economic burdens imposed by dementia, these results highlight the importance of further evaluation to identify patients with NAFLD at risk for further liver-related complications.
Acknowledgments
The authors thank all volunteers for their participation in this study and thank all the involved clinicians, nurses, and the technicians from the Affiliated Drum Tower Hospital of Nanjing University for dedicating their time and efforts to this study.
Data Availability
The raw data used and analyzed in the current study are available from the corresponding author on reasonable request.
Funding
This work was supported by the National Natural Science Foundation of China Grant Awards (82030026, 82270883, and 82000775); the Key Research and Development Program of Jiangsu Province of China (BE2022666); the Natural Science Foundation of Jiangsu Province of China (BK20200114); the Six Talent Peaks Project of Jiangsu Province of China (YY-086); and Fundings for Clinical Trails from the Affiliated Drum Tower Hospital, Medical School of Nanjing University (2022-LCYJ-ZD-03, and 2022-LCYJ-PY-02).
Author Contributions
Y.M. contributed to data collection, statistical analyses, and wrote the manuscript. Z.Z. designed the protocol, contributed to statistical analyses, and reviewed the manuscript. B.Z. designed the protocol and reviewed the manuscript. X.S. and D.F. contributed to liver pathology data collection. W.Z. contributed to magnetic resonance imaging (MRI) data collection and analysis. X.X., C.Y., Y.H., Q.D., and S.Y. contributed to data collection. X.M. and T.W. contributed to MRI data analysis. L.F. contributed to MRI data collection. Y.B. designed the study and oversaw all clinical aspects of study conduct and manuscript preparation. Y.B. is the guarantor of this work and, as such, has full access to all the data in the study as well as taking responsibility for the integrity of the data and the accuracy of the data analysis.
Disclosures
There are no potential conflicts of interest relevant to this article.
References
Abbreviations
- ALT
alanine aminotransferase
- AST
aspartate aminotransferase
- BMI
body mass index
- EST/SE
estimate/standard error
- FBG
fasting blood glucose
- FINS
fasting insulin
- fMRI
functional magnetic resonance imaging
- HbAlc
glycated hemoglobin
- HOMA-IR
homeostasis model assessment of insulin resistance
- LI
lobular inflammation
- MMSE
Mini-Mental State Examination
- MoCA
Montreal Cognitive Assessment
- MRI
magnetic resonance imaging
- NAFLD
nonalcoholic fatty liver disease
- NAS
nonalcoholic fatty liver disease activity score
- NAS
NASH, nonalcoholic steatohepatitis
- OR
odds ratio
- RBANS
Repeatable Battery for the Assessment of Neuropsychological Status
- SEM
structural equation model
Author notes
Y.M. and B.Z. contributed equally to the manuscript.
