


Abstract
The waiting time for radioactive iodine therapy (WRAIT) after total thyroidectomy (TT) in patients with papillary thyroid cancer (PTC) and lymph node metastases (N1) has not been sufficiently investigated for risk of adverse outcomes.
This work aimed to estimate the effect of WRAIT on the outcomes of disease persistence and recurrence among patients with N1 PTC and investigate factors predictive of delayed radioactive iodine therapy (RAIT).
This retrospective cohort study was conducted in a university hospital. A total of 909 patients with N1 PTC were referred for RAIT between 2014 and 2018. WRAIT is the duration between TT and initial RAIT. The optimal WRAIT threshold determined using recursive partitioning analysis was used to define early and delayed RAIT. The primary end point was tumor persistence/recurrence. We compared the outcomes of patients with early and delayed RAIT using inverse probability weighting based on the propensity score.
The WRAIT threshold that optimally differentiated worse long-term remission/excellent response outcomes was greater than 88 days (51% of our cohort; n = 464). WRAIT exceeding 88 days was associated with an augmented risk of disease persistence/recurrence (odds ratio, 2.47; 95% CI, 1.60-3.82) after adjustment. Predictors of delayed RAIT included residence in lower-income areas, reoperation before the initial RAIT, TT at a nonuniversity-affiliated hospital, multifocality, extrathyroidal extension, N1b disease, and pre–RAIT-stimulated thyroglobulin level less than 1 ng/mL.
Delayed RAIT beyond 88 days after TT in patients with N1 PTC independently increased the risk of disease persistence/recurrence. Evaluation of the predictive determinants of prolonged WRAIT may help target at-risk patients and facilitate interventions.
Thyroid cancer is the most commonly diagnosed endocrine malignancy, and its incidence is rapidly increasing worldwide, with more than 586 000 new cases in 2020 (1). Among them, 80% to 85% are papillary thyroid cancers (PTCs) (2, 3). While regional cervical lymph node (LN) metastasis occurs in approximately half of the patients with PTC and represents an adverse pathologic finding associated with a detrimental effect on oncologic outcomes (4-7), in select individuals with LN involvement, the addition of radioactive iodine therapy (RAIT) to total thyroidectomy (TT) has been shown to result in high rates of disease-free and overall survival (8-11).
In real-world practice, however, patients may experience longer waiting time for radioactive iodine therapy (WRAIT) following surgery because of various patient-, disease-, or system-related factors, including comorbidities, postoperative complications, nonadherence, increased pretreatment radiologic/pathological workup, low-efficiency health care process, or limited medical facilities for RAIT (12-14). Presently, the issue of delays for patients scheduled for RAIT has been further exacerbated by the ongoing COVID-2019 pandemic. However, the established recommendations offer little guidance regarding the appropriate waiting time for postoperative administration of RAI, regardless of low-, intermediate-, or high-risk status (15-17).
Previous retrospective studies in low-, intermediate-, or high-risk PTC patients have characterized the prognostic significance of WRAIT by using an arbitrary time-to-RAI cutoff, such as 1, 2, 3, 6, or 9 months, and different primary outcome measures (14, 18-23); thus, conclusions drawn from these studies have varied, and further investigation is warranted. An optimal WRAIT threshold in patients with node-positive PTC has not been determined. Identifying a threshold number of days precisely defining a prolonged WRAIT would help guide cancer treatment centers on the appropriate allocation and increased use of resources. Moreover, data regarding determinants of the extended delay to RAIT for PTC are scarce, and research is needed to identify susceptible patients and intervene prospectively.
In the present study, we sought to establish a time-to-RAI threshold based on clinical outcomes in patients with PTC and pathological N1 disease in a university medical center. We also analyzed the association of delayed RAIT with the risk of disease persistence or recurrence. In addition, we investigated factors predictive of extended WRAIT in this population.
Materials and Methods
Study Population
This study was approved by the institutional review board of the Zhujiang Hospital, Southern Medical University (approval No. 2021-KY-059-01); the institutional review board waived the requirement for written informed consent. We used the institution's electronic medical records system to retrieve the records of all consecutive patients with thyroid cancer admitted to our tertiary referral center between January 2014 and October 2018. We selected all patients with pathologically confirmed PTC and regional LN metastases at presentation, who underwent TT plus central neck LN dissection with or without lateral neck LN dissection, followed by RAIT (n = 2860). We excluded patients with missing or incomplete data (n = 1673) or those with less than 6 months of follow-up after the initial RAI administration (n = 106). We next excluded patients with detectable thyroglobulin (Tg) antibody (TgAb) or serum thyrotropin (TSH) levels (before the first RAIT) lower than 30 mUI/L (n = 172). The final cohort comprised 909 patients.
Data Collection and Definitions
Patient baseline demographic information, histopathologic characteristics, and treatment details, including age at diagnosis, sex, body mass index, the travel distance between the patient's residence and our facility, American Thyroid Association (ATA) risk stratification, primary tumor stage, extrathyroidal extension (ETE), bilateral tumor, BRAF V600E mutational status, node stage, number of metastatic LNs, number of LNs removed, extranodal extension (ENE), size of metastatic LN foci in the largest diameter, cumulative RAI doses, laboratory test results (TSH, TgAb, and Tg), Charlson-Deyo comorbidity score (0 or ≥1) (24), thyroid surgery–specific postoperative complications, such as hypoparathyroidism/hypocalcemia and vocal cord/fold paralysis (25), surgical hospital type (university affiliated or nonuniversity affiliated), and insurance status, were recorded from the electronic medical record. In addition, as we did not directly collect data on patient socioeconomic status (SES), 2 area-based socioeconomic measures, the annual per capita disposable income (APCDI) and the proportion of students who are receiving a first- to ninth-grade education obtained from the 2019 National Economic and Social Development Statistical Bulletins and Statistical Yearbooks of various regions (26), were used as proxies for SES. The great-circle formula calculated travel distance. The type of insurance comprised self-pay; Publicly Funded Free Medical Care for civil servants; New Cooperative Medical System for rural residents; Urban Resident Basic Medical Insurance for urban unemployed, older individuals, children, and students; and Urban Employee Basic Medical Insurance for urban employed and retired (27). Both income and educational status were stratified by respective medians, creating high income (top 50th percentile) vs low income (bottom 50th percentile) and high educational status (top 50th percentile) vs low educational status (bottom 50th percentile) variables. As defined by the seventh edition of the American Joint Commission on Cancer staging system for differentiated thyroid cancer, ETE can be classified into no, microscopic, and macroscopic ETEs (28). All patients were restaged according to the guidelines of the eighth edition of the American Joint Commission on Cancer (29). The risk of disease recurrence was classified according to the 2015 ATA risk stratification criteria (15). Serum Tg and TgAb tests were assessed using an electrochemiluminescent immunometric assay (Cobas e801 instrument, Roche Diagnostics; TgAb, catalog No. 04738578, RRID: AB_263104) with a lower detection limit of 0.04 ng/mL and 10 IU/mL, respectively. Serum TSH levels were measured using an immunoradiometric assay (Weifang Sanwei Bioengineering Group Co Ltd) with a lower detection limit of 0.01 mIU/L.
Treatment and Follow-up Protocol
Specialized head-neck surgeons performed all TTs and LN dissections in eligible individuals; all surgical specimens were carefully examined by experienced surgeons and pathologists. Routine prophylactic central-compartment neck dissection was performed in patients with TT. For patients with clinically apparent lateral neck disease or biopsy-proven disease, therapeutic lateral neck dissection of the involved compartments was performed. Voice/laryngeal assessment and serum calcium, phosphate, and parathyroid hormone levels were measured at 2 to 8 weeks postoperatively at the discretion of the surgical team in the hospital where the patients underwent the first surgery. Postoperative initial RAIT was typically administered following 3 weeks of thyroid hormone withdrawal. All individuals were advised to adhere to an iodine-restricted diet for approximately 1 to 2 weeks preceding RAIT. A TSH level of 30 mIU/L or greater before RAIT was confirmed in all individuals. The stimulated serum Tg and TgAb levels were measured immediately before the first RAIT. The choice of the initial RAI-administered activities between 30 and 100 mCi, 100 and 150 mCi, and 100 and 200 mCi was at the treating physician's discretion in low-, intermediate-, and high-risk patients, respectively.
Clinical assessments after completion of the first RAIT were scheduled at 1 and 4 months, every 3 to 6 months for the first 2 to 3 years, and then annually thereafter. The routine follow-up protocol consisted of a medical history review and clinical examination; basal serum Tg level on thyroxine therapy, TgAb, and TSH tests; and neck ultrasonography. Six to 18 months after the initial administration of RAI, a diagnostic RAI whole-body scan combined with stimulated Tg measurement in the presence of TSH of 30 mIU/L or greater through thyroid hormone withdrawal was performed in most patients. In patients with suspected persistent or newly identified evidence, additional imaging studies, such as cross-sectional imaging (computed tomography [CT] or magnetic resonance imaging [MRI]) or positron emission tomography (PET)/CT scan, were performed when required for further clarification. During follow-up, additional treatments (ie, repeated surgery or RAIT, or other therapies) for persistent or recurrent disease were administered when required based on the judgment of the attending clinicians and the consensus of the thyroid cancer multidisciplinary team. Repeated RAI treatment with empirically prescribed activity of iodine-131 (100-200 mCi) was administered to patients with persistent nonresectable disease every 6 to 12 months as long as the disease continued to concentrate RAI and an objective benefit was demonstrated (eg, decreases in lesion size and Tg level). Follow-up duration was calculated from the initial surgical treatment date to the most recent clinic visit. The cutoff date for follow-up was October 10, 2022.
Waiting Time for Radioactive Iodine Therapy and Definition of Clinical Outcome
We defined WRAIT as the interval in days from TT for thyroid cancer to the first administration of RAI. The outcome measures of our study were a biochemical or structural persistent disease, recurrence, and disease remission, based on reassessment at each follow-up visit after initial postsurgery RAIT. Patients were considered to have an excellent response or long-term disease remission status at the final known follow-up examination if they had no biochemical (suppressed Tg level of <1 ng/mL, stimulated Tg level of <10 ng/mL, and no detectable TgAb), no evidence of disease on cross-sectional imaging (ultrasonography, CT, or MRI), functional imaging (RAI whole-body scan or PET/CT), or biopsy-proven disease (cytology or histology). Patients were deemed to have persistent biochemical disease only if they displayed a suppressed Tg level of 1 ng/mL or greater, stimulated Tg level of 10 ng/mL or greater, or increasing levels of TgAbs without a structural correlate. Persistent structural disease involving local soft tissues, LNs, and distant areas was defined as evidence of disease on imaging studies or biopsy-proven disease, regardless of Tg or TgAb values. Recurrence was noted when new evidence of cancer's structural or biochemical persistence was detected after a disease-free status for at least 1 year (30). Disease-free survival (DFS) was defined as the time between initial RAI administration and disease persistence/recurrence (31).
Statistical Analysis
Continuous variables are presented as median (interquartile range [IQR]) and compared using the Wilcoxon rank sum test, and categorical variables are presented as numbers (percentages) and compared using the χ2 test. An optimal threshold for WRAIT (in days) was identified using the recursive partitioning analysis (RPA) to determine the greatest differences in the estimated risk of developing the persistent or recurrent disease (32). The cutoff was validated by iterative Wald tests for the odds of persistent or recurrent disease at increasing WRAIT thresholds of 5 days. The WRAIT producing the maximal χ2 scores was designated to dichotomize time and divide patients into receiving either early or delayed RAIT. Univariable and multivariable logistic regression models were performed to evaluate the effect of WRAIT on outcomes and identify risk factors for prolonged WRAIT based on the identified optimal cutoff. Prognostic factors were retained in the multivariable model only if they had P values less than .05 on univariable analysis. Cramer's V correlation coefficient and variance inflation factor (VIF) were calculated to investigate the collinearity between the receipt of reoperation before the first RAIT and surgical hospital type. In general, Cramer's value of 0.3 or greater denotes a strong association (33). Collinearity was considered present when dependent variables were highly correlated, and the VIF of 1 variable was at least 10 (34). In addition, to address selection bias, an inverse probability of treatment weighting (IPTW) via propensity score (PS) methods were performed (35). The PS, defined as the probability that a patient would receive either early RAIT or late RAIT, was calculated through logistic regression, including all baseline covariates. In the IPTW analysis, the PSs were used to calculate the stabilized inverse probability weights. Logistic models that used the stabilized inverse probability weights were reported. The balance of covariates between treatment groups was examined using the SDs, in which differences below 20% indicated successful balance. DFS curves were estimated with the Kaplan-Meier method and compared using the log-rank test.
To assess the robustness of the main results, 4 post hoc sensitivity analyses were performed. First, we conducted a reduced multivariable logistic regression for evaluating variables related to extended WRAIT. Second, we examined the association between longer WRAIT and incident persistent or recurrent disease in a PS-matched cohort, in which the one-to-one nearest-neighbor matching algorithm and caliper width 0.1 were applied to create a subsample controlled for potential confounders. Third, we repeated analyses stratified by age at PTC diagnosis (<55 years vs ≥55 years), ATA risk stratification (low vs intermediate vs high risk), T stage (T1-2 vs T3-4), N stage (N1a vs N1b), and different levels of stimulated Tg before the first RAIT (Tg <1 ng/mL vs 1≤ Tg ≤10 ng/mL vs Tg >10 ng/mL). Fourth, we repeated analyses using previously published WRAIT thresholds of 90-day or 180-day defining early and delayed groups. To explore whether the effect of WRAIT on the outcome was proportional to histopathological characteristics, we used causal mediation analysis to characterize the causality relationship in our retrospective study (36). RPA was performed with the use of JMP Pro 14 software (SAS Institute Inc). All other analyses were conducted with the use of R software (R Foundation, version 4.1.1). Two-sided P less than .05 denoted statistical significance.
Results
Patient Characteristics and Propensity Adjustment
Our cohort comprised 909 patients with node-positive PTC. There were 869 patients with a conventional form of PTC (95.6%), 29 with a follicular variant, 2 with a diffuse sclerosing variant, 1 with tall cell variant, 1 with columnar variant, 2 with insular variant, and 5 with a solid variant. Overall, 808 patients (88.9%) were younger than 55 years, and 63.4% were female (Table 1). A total of 391 (43%) patients had LN metastases involving the central compartment alone, 101 (11.1%) involved the lateral compartment alone, and 417 (45.9%) involved both central and lateral compartments. Of these 909 patients, the maximum sizes of the metastatic foci within an LN were less than 0.2 cm in 148 (16.3%), 0.2 to 3 cm in 756 (83.2%), and greater than 3 cm in 5 (0.6%). The median numbers of dissected and positive LNs were 15 and 5, respectively. ENE was observed in 351 (38.6%) patients. Overall, 95 patients (10.4%) underwent at least 1 reoperation after the initial surgical procedure for PTC. No patient had a history of high-dose iodine exposure (eg, intravenous contrast, amiodarone, or others) within 3 months before RAIT. The median WRAIT was 91 days (IQR, 63-188 days) post surgery. RPA and Wald statistics identified a WRAIT of 88 days for maximizing differences in the risk of persistent or recurrent disease when comparing patients with a longer time to initial RAIT with those with an equal or shorter time to initial RAIT. Delayed RAIT was defined as the use of RAI occurring more than 88 days after surgery.
Baseline characteristics of unweighted sample, inverse probability of treatment-weighted sample, and propensity score-matched sample based on waiting time for radioactive iodine threshold of 88 days
| Characteristic | Unweighted sample, No. (%) | Weighted sample, % | PS-matched sample, No. (%) | ||||||
|---|---|---|---|---|---|---|---|---|---|
| WRAIT ≤88 d(n = 445) | WRAIT > 88 d(n = 464) | P | WRAIT ≤88 d(n = 457.7) | WRAIT > 88 d(n = 463.9) | Standardized difference | WRAIT ≤88 d(n = 306) | WRAIT > 88 d(n = 306) | Standardized difference | |
| Age at diagnosis, y | .606 | ||||||||
| <55 | 398 (89.4) | 410 (88.4) | 85.5 | 88.7 | −0.097 | 273 (89.2) | 272 (88.9) | 0.010 | |
| ≥55 | 47 (10.6) | 54 (11.6) | 14.5 | 11.3 | 0.097 | 33 (10.8) | 34 (11.1) | −0.010 | |
| Sex | .785 | ||||||||
| Female | 280 (62.9) | 296 (63.8) | 59.5 | 64.9 | −0.111 | 190 (62.1) | 195 (63.7) | −0.034 | |
| Male | 165 (37.1) | 168 (36.2) | 40.5 | 35.1 | 0.111 | 116 (37.9) | 111 (36.3) | 0.034 | |
| Body mass index | 22.7 (20.3-24.8) | 22.2 (19.9-24.7) | .053 | 22.8 (20.2-25.4) | 22.6 (20.1-24.8) | 0.072 | 22.2 (20.0-24.6) | 22.2 (20.0-24.5) | 0.054 |
| Insurance type | .057 | ||||||||
| PFFMC | 14 (3.1) | 13 (2.8) | 2.5 | 2.6 | −0.006 | 5 (1.6) | 9 (2.9) | −0.088 | |
| UEBMI | 363 (81.6) | 390 (84.1) | 81.5 | 83.9 | −0.065 | 262 (85.6) | 250 (81.7) | 0.106 | |
| URBMI | 8 (1.8) | 8 (1.7) | 1.6 | 1.9 | −0.020 | 3 (1.0) | 7 (2.3) | −0.103 | |
| NCMS | 35 (7.9) | 44 (9.5) | 10.4 | 8.4 | 0.068 | 23 (7.5) | 31 (10.1) | −0.092 | |
| Self-pay | 25 (5.6) | 9 (1.9) | 4.0 | 3.1 | 0.045 | 13 (4.2) | 9 (2.9) | 0.070 | |
| Education level | .847 | ||||||||
| Low | 339 (76.2) | 356 (76.7) | 78.1 | 77.1 | 0.022 | 238 (77.8) | 239 (78.1) | −0.008 | |
| High | 106 (23.8) | 108 (23.3) | 21.9 | 22.9 | −0.022 | 68 (22.2) | 67 (21.9) | 0.008 | |
| Income level | <.001 | ||||||||
| Low | 213 (47.9) | 273 (58.8) | 57.6 | 54.2 | 0.069 | 173 (56.5) | 175 (57.2) | −0.013 | |
| High | 232 (52.1) | 191 (41.2) | 42.4 | 45.8 | −0.069 | 133 (43.5) | 131 (42.8) | 0.013 | |
| Distance, km | .273 | ||||||||
| ≤54 | 231 (51.9) | 224 (48.3) | 46.1 | 50.1 | −0.079 | 147 (48.0) | 152 (49.7) | −0.033 | |
| >54 | 214 (48.1) | 240 (51.7) | 53.9 | 49.9 | 0.079 | 159 (52.0) | 154 (50.3) | 0.033 | |
| CCI score | .164 | ||||||||
| 0 | 342 (76.9) | 338 (72.8) | 76.9 | 74.1 | 0.066 | 231 (75.5) | 230 (75.2) | 0.008 | |
| ≥1 | 103 (23.1) | 126 (27.2) | 23.1 | 25.9 | −0.066 | 75 (24.5) | 76 (24.8) | −0.008 | |
| Surgical hospital type | <.001 | ||||||||
| University affiliated | 339 (76.2) | 267 (57.5) | 62.4 | 65.8 | −0.072 | 216 (70.6) | 204 (66.7) | 0.085 | |
| Nonuniversity affiliated | 106 (23.8) | 197 (42.5) | 37.6 | 34.2 | 0.072 | 90 (29.4) | 102 (33.3) | −0.085 | |
| Thyroid surgery–specific complications | .262 | ||||||||
| No | 334 (75.1) | 333 (71.8) | 75.2 | 73.3 | 0.042 | 223 (72.9) | 222 (72.5) | 0.007 | |
| Yes | 111 (24.9) | 131 (28.2) | 24.8 | 26.7 | −0.042 | 83 (27.1) | 84 (27.5) | −0.007 | |
| Receipt of reoperation before first RAIT | <.001 | ||||||||
| No | 435 (97.8) | 379 (81.7) | 86.1 | 89.5 | −0.104 | 296 (96.7) | 292 (95.4) | 0.067 | |
| Yes | 10 (2.2) | 85 (18.3) | 13.9 | 10.5 | 0.104 | 10 (3.3) | 14 (4.6) | −0.067 | |
| Bilateral tumor | .531 | ||||||||
| No | 305 (68.5) | 309 (66.6) | 70.8 | 67.7 | 0.068 | 209 (68.3) | 205 (67.0) | 0.028 | |
| Yes | 140 (31.5) | 155 (33.4) | 29.2 | 32.3 | −0.068 | 97 (31.7) | 101 (33.0) | −0.028 | |
| Extrathyroidal extension | .003 | ||||||||
| Nil | 269 (60.4) | 233 (50.2) | 52.1 | 54.5 | −0.048 | 165 (53.9) | 162 (52.9) | 0.020 | |
| Microscopic | 152 (34.2) | 188 (40.5) | 41.2 | 38.1 | 0.063 | 119 (38.9) | 119 (38.9) | 0.000 | |
| Macroscopic | 24 (5.4) | 43 (9.3) | 6.7 | 7.4 | −0.026 | 22 (7.2) | 25 (8.2) | −0.037 | |
| ATA risk stratification | .049 | ||||||||
| Low | 46 (10.3) | 48 (10.3) | 8.9 | 9.7 | −0.030 | 35 (11.4) | 33 (10.8) | 0.021 | |
| Intermediate | 358 (80.4) | 349 (75.2) | 80.2 | 78.9 | 0.033 | 243 (79.4) | 235 (76.8) | 0.063 | |
| High | 41 (9.2) | 67 (14.4) | 10.9 | 11.4 | −0.015 | 28 (9.2) | 38 (12.4) | −0.106 | |
| T stage | .125 | ||||||||
| T1 | 322 (72.4) | 317 (68.3) | 67.8 | 69.8 | −0.045 | 209 (68.3) | 211 (69.0) | −0.014 | |
| T2 | 85 (19.1) | 86 (18.5) | 22.3 | 19.3 | 0.075 | 64 (20.9) | 60 (19.6) | 0.033 | |
| T3 | 24 (5.4) | 33 (7.1) | 5.4 | 6.1 | −0.028 | 20 (6.5) | 18 (5.9) | 0.027 | |
| T4 | 14 (3.1) | 28 (6.0) | 4.5 | 4.8 | −0.015 | 13 (4.2) | 17 (5.6) | −0.061 | |
| N stage | <.001 | ||||||||
| N1a | 224 (50.3) | 167 (36.0) | 41.0 | 42.8 | −0.035 | 130 (42.5) | 131 (42.8) | −0.007 | |
| N1b | 221 (49.7) | 297 (64.0) | 59.0 | 57.2 | 0.035 | 176 (57.5) | 175 (57.2) | 0.007 | |
| M stage | .753 | ||||||||
| M0 | 424 (95.3) | 440 (94.8) | 96.1 | 95.8 | 0.015 | 297 (97.1) | 294 (96.1) | 0.054 | |
| M1 | 21 (4.7) | 24 (5.2) | 3.9 | 4.2 | −0.015 | 9 (2.9) | 12 (3.9) | −0.054 | |
| Multifocality | <.001 | ||||||||
| No | 351 (78.9) | 319 (68.8) | 76.2 | 74.6 | 0.038 | 237 (77.5) | 224 (73.2) | 0.099 | |
| Yes | 94 (21.1) | 145 (31.2) | 23.8 | 25.4 | −0.038 | 69 (22.5) | 82 (26.8) | −0.099 | |
| BRAF V600E mutation | .118 | ||||||||
| Negative | 82 (18.4) | 99 (21.3) | 19.7 | 18.9 | 0.019 | 56 (18.3) | 55 (18.0) | 0.008 | |
| Positive | 275 (61.8) | 296 (63.8) | 63.2 | 64.3 | −0.022 | 198 (64.7) | 207 (67.6) | −0.062 | |
| Unknown | 88 (19.8) | 69 (14.9) | 17.1 | 16.8 | 0.008 | 52 (17.0) | 44 (14.4) | 0.072 | |
| Extranodal extension | .7 | ||||||||
| No | 276 (62.0) | 282 (60.8) | 56.3 | 60.4 | −0.083 | 191 (62.4) | 188 (61.4) | 0.020 | |
| Yes | 169 (38.0) | 182 (39.2) | 43.7 | 39.6 | 0.083 | 115 (37.6) | 118 (38.6) | −0.020 | |
| Size of metastatic LN focia, cm | 0.4 (0.2–0.9) | 0.5 (0.2–1.1) | .027 | 0.4 (0.25-1.1) | 0.5 (0.2-1.0) | 0.005 | 0.4 (0.2-1.0) | 0.5 (0.2-1.0) | −0.011 |
| No. of LNs examined | 13 (6–25) | 16 (8–29.2) | .004 | 16 (8-26) | 15 (7-28) | −0.025 | 14 (7-27) | 15 (7-27) | 0.021 |
| No. of metastatic LNs | 5 (3–9) | 5 (3–10) | .408 | 5 (3-10) | 5 (3-10) | 0.019 | 5 (3-9) | 5 (3-9) | 0.009 |
| Cumulative RAI dose, mCi | 150 (140–180) | 150 (100–180) | <.001 | 150 (135-180) | 150 (120-248) | −0.018 | 150 (136.2-174) | 150 (102-180) | 0.066 |
| sTg before first RAIT, ng/mL | <.001 | ||||||||
| <1 | 79 (17.8) | 125 (26.9) | 18.2 | 21.8 | −0.089 | 57 (18.6) | 76 (24.8) | −0.151 | |
| 1-10 | 208 (46.7) | 164 (35.3) | 40.2 | 39.7 | 0.010 | 145 (47.4) | 117 (38.2) | 0.186 | |
| >10 | 158 (35.5) | 175 (37.7) | 41.6 | 38.5 | 0.063 | 104 (34.0) | 113 (36.9) | −0.062 | |
Continuous variables are presented as medians with interquartile ranges.
Bold indicates statistically significant P values.
Abbreviations: ATA, American Thyroid Association; CCI, Charlson Comorbidity Index; LN, lymph node; NCMS, New Cooperative Medical System; PS, propensity score; RAI, radioactive iodine; RAIT, radioactive iodine therapy; sTg, stimulated thyroglobulin; PFFMC, Publicly Funded Free Medical Care; UEBMI, Urban Employee Basic Medical Insurance; URBMI, Urban Resident Basic Medical Insurance; WRAIT, waiting time for radioactive iodine therapy.
The longest diameter of the metastatic LN foci.
Based on the estimated threshold, 445 patients (49%) received early RAIT, and 464 patients (51%) received delayed RAIT (see Table 1). Before weighting, patients who received delayed initial RAIT were significantly more likely to undergo TT at a nonuniversity-affiliated hospital and reoperation before the initial RAIT; have a lower cumulative radioiodine dose; and present with ETE, N1b disease, multifocality, an ATA high risk of recurrence, a larger size of the largest metastatic focus in metastatic LNs, an increasing number of LNs examined, and a lower stimulated Tg value before the initial RAIT (all P < .05). In terms of urban and rural regions metrics of SES, patients who underwent delayed RAIT tended to live in regions with a lower APCDI level (P < .001). After IPTW adjustment, the 2cohorts were well-balanced on these and the other baseline factors, with all SD less than 20%.
Factors Associated With Delayed Postoperative Administration of Radioactive Iodine
Following multivariable adjustment (Table 2), independent factors predictive of delayed WRAIT longer than 88 days included reoperation before the initial RAIT, TT at a nonuniversity-affiliated hospital, ETE, multifocality, and stage N1b disease. In contrast, patients who lived in areas with a higher income level or presented with stimulated Tg of 1 ng/mL or greater before the first RAIT had a higher likelihood of initial RAI administration before 88 days. In addition, no differences in the WRAIT were found concerning T stage, BRAF V600E mutation, size of the largest metastatic focus in metastatic LNs, or number of LNs examined. Analysis was repeated in a reduced model for robustness with similar results (see Table 2). Furthermore, reoperation before the first RAIT displayed a significantly weak correlation with surgical hospital type (Cramer's V correlation coefficient = 0.1933; P < .0001), and the VIFs were 1.08 for reoperation before the first RAIT and 1.07 for surgical hospital type (Supplementary e-Tables S1 and S2) (37), showing no sign of collinearity between these 2 predictors. Finally, the key clinical characteristics of ETE, multifocality, and N1b disease were compared according to surgical hospital type, receipt of reoperation before initial RAI administration, and income level. The results are presented in Supplementary e-Table S3 (37). Compared with patients who did not undergo reoperation, a higher percentage of patients who underwent reoperation had stage N1b (14.9% vs 4.6%; P < .0001) and multifocal (13.8% vs 9.3%; P = .0482) diseases. The prevalence of reoperation (8.4%) in patients with ETE was similar to the frequency of reoperation (12.2%) in patients without ETE (P = .063). When comparing patients who underwent thyroid surgery in a nonuniversity-affiliated hospital with those in a university-affiliated hospital, the proportions of ETE, multifocality, and N1b disease significantly differed at 37.8% and 29.7%, 39.8% and 31.0%, and 36.7% and 28.9%, respectively (all P < .05). No statistically significant association was noted between the APCDI and any of these 3 tumor features (all P > .1).
Multivariable logistic regression model of factors potentially predictive of prolonged waiting time for radioactive iodine therapy based on the optimal threshold of 88 days
| Characteristic | Full model | Reduced model | ||
|---|---|---|---|---|
| OR (95% CI) | P | OR (95% CI) | P | |
| Receipt of reoperation before first RAIT (Ref: no) | 9.33 (4.65-18.73) | <.001 | 8.36 (4.20-16.65) | <.001 |
| Yes | ||||
| Income level (Ref: low) | ||||
| High | 0.64 (0.48-0.86) | .003 | 0.66 (0.50-0.87) | .004 |
| Surgical hospital type (Ref: university affiliated) | ||||
| Nonuniversity affiliated | 1.92 (1.40-2.62) | <.001 | 1.90 (1.40-2.59) | <.001 |
| Extrathyroidal extension (Ref: none) | ||||
| Present | 1.45 (1.07-1.96) | .016 | 1.53 (1.15-2.04) | .004 |
| T stage (Ref: T1) | ||||
| T2 | 0.97 (0.67-1.40) | .875 | NA | NA |
| T3 | 1.15 (0.63-2.08) | .651 | NA | NA |
| T4 | 1.40 (0.68-2.89) | .366 | NA | NA |
| N stage (Ref: N1a) | ||||
| N1b | 1.63 (1.15-2.32) | .006 | 1.49 (1.11-1.99) | .007 |
| Multifocality (Ref: no) | ||||
| Yes | 1.44 (1.03-2.01) | .034 | 1.42 (1.03-1.98) | .034 |
| BRAF V600E mutation (Ref: negative) | ||||
| Positive | 1.26 (0.86-1.84) | .239 | NA | NA |
| Size of metastatic LN focia, cm | 0.94 (0.71-1.25) | .674 | NA | NA |
| No. of LNs examined | 1.00 (0.99-1.01) | .623 | NA | NA |
| sTg before first RAIT, ng/mL (Ref: <1) | ||||
| 1-10 | 0.44 (0.30-0.64) | <.001 | 0.45 (0.31-0.66) | <.001 |
| >10 | 0.49 (0.33-0.73) | <.001 | 0.48 (0.33-0.71) | <.001 |
Bold indicates statistically significant P values.
Abbreviations: LN, lymph node; NA, not applicable; OR, odds ratio; Ref, reference; sTg, stimulated thyroglobulin.
The longest diameter of the metastatic LN foci.
Prolonged Waiting Time for Radioactive Iodine Therapy and Risk of Persistent or Recurrent Disease
During a median follow-up time of 53.2 months (IQR, 35.6-68.6 months; range, 7.1-193.7 months), 652 patients achieved long-term complete remission or excellent response to therapy. A total of 257 patients (28.3%) showed persistent (n = 218) or recurrent (n = 39) disease at the end of follow-up. Of 257 patients, 65 (7.2%), 153 (16.8%), and 7 (0.8%) patients had a biochemical incomplete response, a structural incomplete response, and a biochemical recurrence, respectively. None of the patients died. When classified based on the 2015 ATA risk stratification system, 12.7% (12/94), 26.3% (186/707), and 54.6% (59/108) of the low-, intermediate-, and high-risk patients (P < .001), respectively, had persistent or recurrent disease detected during follow-up.
Before applying the PS methods, 21.8% (97/445) of patients treated with early RAIT and 34.5% (160/464) of patients treated with delayed RAIT presented with a disease event. The crude 5-year DFS rate was 62.48% for patients treated with delayed RAIT vs 77.03% for patients treated with early RAIT (log-rank P < .0001) (Fig. 1A). On univariable logistic regression analysis (Table 3 and Supplementary e-Table S4) (37), WRAIT was a significant prognostic factor for disease nonremission (odds ratio [OR], 1.89; P < .001). After adjusting for confounding variables (see Table 3 and Supplementary e-Table S4) (37), WRAIT remained an independent prognostic factor for disease nonremission (OR, 2.50; P < .001). Among the patients in the IPTW sample, the crude 5-year DFS rate among patients treated with delayed RAIT was still statistically significantly lower than those treated with early RAIT (62.28% vs 75.53%; log-rank P < .0001) (Fig. 1B). On multivariable analysis with IPTW (see Table 3 and Supplementary e-Table S5) (37), there was a statistically significant positive association between delayed RAI use and a greater risk of persistent or recurrent disease (OR, 2.47; P < .001). As presented in Supplementary e-Table S6 (37), the association of WRAIT with persistent or recurrent disease was not mediated by ETE, multifocality, or stage N1b disease (data not shown).
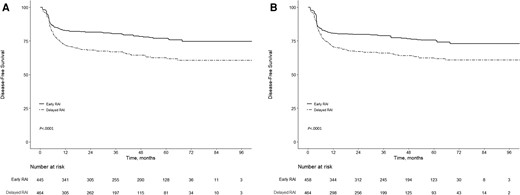
Kaplan-Meier survival curves for patients treated with early radioactive iodine (RAI) (≤88 days) and delayed RAI (>88 days) following surgery. A, Kaplan-Meier survival curves for patients treated with early RAI and delayed RAI following surgery before propensity score weighting. B, Kaplan-Meier survival curves for patients treated with early RAI and delayed RAI following surgery after propensity score weighting. P value is shown for comparison by using the log-rank test.
Effect of waiting time for radioactive iodine therapy on odds of persistent or recurrent disease
| Analytic approach | No. of events/No. of patients at risk (%) | OR (95% CI) | P | |
|---|---|---|---|---|
| Early RAIT group | Delayed RAIT group | |||
| Crude analysis | 97/445 (21.8) | 160/464 (34.5) | 1.89 (1.41-2.54) | <.001 |
| Multivariable analysis | 97/445 (21.8) | 160/464 (34.5) | 2.50 (1.67-3.75) | <.001 |
| PS analyses | ||||
| With IPTW | 107.1/457.7 (23.4) | 162.8/463.9 (35.1) | 2.47 (1.60-3.82)a | <.001 |
| With matchingc | 63/306 (20.6) | 107/306 (35.0) | 2.64 (1.68-4.14)b | <.001 |
Full regression models can be found in Supplementary e-Tables S4, S5, and S7.
Bold indicates statistically significant P values.
Abbreviations: IPTW, inverse probability of treatment weighting; OR, odds ratio; PS, propensity score; RAIT, radioactive iodine therapy.
Shown is the primary analysis with an OR from the multivariable logistical regression model with inverse probability weighting according to propensity score.
Shown is the OR from a multivariable logistical regression model with matching according to propensity score.
Matching was performed based on nearest neighbor method in a 1:1 ratio without any replacement, with a caliper distance of 0.1 of the SD of the logit of the propensity score.
The robustness of our findings was assessed using post hoc sensitivity analyses. To further confirm the effects of WRAIT, we implemented PS-matching analysis. From the delayed RAIT group, 306 patients (65.9%) were matched with 306 patients who underwent early RAIT. Patients treated with and without timely RAI were balanced on 25 baseline characteristics (see Table 1). In our propensity-matched cohort, WRAIT exceeding 88 days was still associated with an increased risk of PTC persistence or recurrence (OR, 2.64; P < .001) (see Table 3 and Supplementary e-Table S7) (37). Moreover, the magnitude of the associations between RAI administration delay and the persistent or recurrent disease outcomes of interest did not substantially change when we did subgroup analyses regarding age, ATA risk group, T stage, N stage, and stimulated Tg levels before the initial RAIT (Supplementary e-Table S8) (37), and when we repeated analyses by selecting 90 days or 180 days as a cutoff at which delay is defined (Supplementary e-Table S9) (37).
Discussion
This study investigated the effect of and factors for delayed RAIT following TT for an exclusively node-positive PTC population. The results demonstrated that WRAIT exceeding 88 days was associated with a statistically significantly higher rate of persistent or recurrent PTC events. This association remained even when accounting for numerous predetermined potentially confounding patient, socioeconomic, hospital, and tumor characteristics and in the PS-weighting and multiple sensitivity analyses. Although a causal relationship between WRAIT and clinical outcomes cannot be established, our results implied that shorter WRAIT could potentially reduce the incidence of PTC persistence or recurrence. Moreover, using regression analysis, we identified several independent risk factors for delayed RAIT, which included residence in lower-income areas, reoperation before the initial RAIT, TT at a nonuniversity-affiliated hospital, multifocality, ETE, stage N1b disease, and pre–RAIT-stimulated Tg level less than 1 ng/mL.
Previous investigations into the prolonged WRAIT for patients with low-, intermediate-, or high-risk differentiated thyroid cancer differed concerning the patient, the sample size, the treatment characteristics included, the statistical approaches used, the outcome measures used, as well as the arbitrarily selected cutoff for the definition of early vs delayed RAITs (14, 18-23). As a result, while some investigations have found that an increasing WRAIT is associated with an increased probability of disease persistence or recurrence, suggesting that longer WRAIT may risk tumor regrowth (14, 20, 21), other investigations have demonstrated that a reasonable delay between thyroidectomy and RAIT does not carry a worse prognosis on patient outcomes (18, 19, 22, 23). Importantly, no studies have examined the prognostic significance of the WRAIT, specifically in patients with nodal metastases, who represent a common clinical scenario and are associated with increased PTC recurrence and mortality. To our knowledge, the present study is the first to address the optimal timing of postoperative administration of RAI in a sizable cohort of 909 patients with node-positive disease. A strength of this study is that the RPA approach improves on previous efforts by examining the effect of WRAIT as a continuous variable on patient outcomes in an objective fashion without prespecified an arbitrary cutoff time. Another strength of this study was that our sample size is significantly larger than previously published studies focusing on the effect of RAI timing on patients with low-, intermediate-, or high-risk disease. Furthermore, we used the PS-weighting method to minimize inherent bias, and we relied on the conservative analytic approach, IPTW-adjusted models, and sensitivity analyses to base our conclusions.
There has been less research on the predictors of RAI treatment delay in differentiated thyroid cancer. Similar to what others have described regarding head and neck cancers (38, 39), we observed that patients who lived in lower-income areas were more likely to have extended WRAIT, implying that socioeconomic barriers remain considerable in preventing them from receiving timely and appropriate care. Interestingly, patients who underwent TT in nonuniversity-affiliated hospitals reported longer WRAIT than those who underwent TT in university-affiliated hospitals. Indeed, many pathology reports from these nonuniversity-affiliated hospitals did not contain additional clinical factors required for initial risk stratification and postoperative RAI decision-making, such as the presence or absence of ENE, size of the largest metastatic focus within an LN, BRAF mutational status, and specific histological subtypes. In such contexts, surgical pathology specimens are typically requested from referring surgical facilities and reevaluated independently by 2 experienced pathologists at our facility. Additionally, most nonuniversity-affiliated hospitals are located farther away. Thus, obtaining and analyzing additional pathologic materials increase the WRAIT. It is also possible that head and neck surgeons at nonuniversity-affiliated hospitals are more likely to delay referral to nuclear medicine specialists for RAIT. However, we were unable to assess this based on our analyses. Repeated local surgery after the initial surgery for PTC can also affect the timeliness. In our study cohort, patients who underwent reoperation took longer to receive their first RAI administration, potentially because of the additional workup required to evaluate the disease extent and ensure that they were adequate candidates for reoperation. In addition, a postoperative stimulated Tg value of less than 1 ng/mL generally suggests long-term remission and reflects a prolonged event-free survival (40, 41). We cannot exclude that physicians may have selected patients to receive a late RAI administration owing to a postoperative stimulated Tg value of less than 1 ng/mL.
In our study, the clinical characteristics associated with increased WRAIT were ETE, multifocality, and N1b disease. The reason for this is not completely clear; however, the heterogeneity of patients referred to our facility may partially explain this finding. Some patients with adverse tumor features may have experienced more pretreatment analyses that postponed the initial RAIT. This hypothesis is supported by the fact that there was a higher rate of reoperation before the initial RAIT in patients with multifocal disease and lateral cervical LN metastases (see Supplementary e-Table S3) (37). There are also data suggesting that advanced tumor stage is associated with neck reoperation (42). Furthermore, patients with ETE, multifocality, or N1b disease more frequently received TT in a nonuniversity-affiliated hospital (see Supplementary e-Table S3) (37), which may exacerbate delays in RAIT because TT for PTC in a nonuniversity-affiliated hospital has been shown to be a determinant of increased WRAIT (see Table 2). Factors that may influence the variation between hospitals in the WRAIT should be explored in the future.
Although the presence of ETE, multifocality, and N1b disease had emerged as important risk factors for the persistence or recurrence of PTC (15, 43), it was difficult to explore whether these key clinical features played a substantial role in the relationship between WRAIT and disease persistence or recurrence in our retrospective observational study. Causal mediation analysis was applied to address this limitation. In the present study, we used WRAIT as the treatment and ETE, multifocality, or N1b disease as a mediator variable and found that the effect of increased WRAIT was not mediated by each of these tumor characteristics (see Supplementary e-Table S6) (37). This finding may reflect the true effect of WRAIT in real-world clinical practice and further confirm the benefit of reduced WRAIT in patients with node-positive PTC, regardless of whether the patients present with adverse tumor features at the time of diagnosis. Further studies are warranted to identify the main factors involved in the association between delayed RAI administration and poor prognosis.
The present study has some limitations. First, this is a nonrandomized, retrospective observational study and hence suffers from potential selection and ascertainment bias despite robust PS weighting and matching. Although we attempted to include as many potential confounders as possible, it is still possible that some amount of unmeasured confounding remains, which may have affected our results. Second, although the single-center nature of this study may provide insight into the role of RAIT delay in the setting of a highly select group of patients with node-positive PTC, it may not necessarily be generalizable to histologic types other than PTC. Larger prospective studies in more diverse populations must validate our findings for generalizability. Third, we were not able to evaluate several important variables relevant to clinical outcome and prolonged WRAIT in the analyses, such as the diagnosis-to-surgery interval and individual reasons for delayed RAI use (eg, nonadherence, missed appointments, unrelated medical comorbidities, or unknown) because of incomplete clinical data before RAIT at our facility.
In conclusion, this is the first study showing that longer WRAIT beyond 88 days after TT in N1 PTC was associated with greater disease persistence or recurrence. Residence in lower-income areas, reoperation before the initial RAIT, TT at a nonuniversity-affiliated hospital, multifocality, extrathyroidal extension, N1b disease, and pre–RAIT-stimulated Tg level less than 1 ng/mL were associated with delayed RAI administration. Identifying predictive factors for RAIT delay can assist in recognizing at-risk patients with node-positive PTC and pinpoint specific areas to reduce delay.
Disclosures
All authors declare that they do not have any commercial association that might create a conflict of interest in connection with this manuscript.
Data Availability
Some or all data sets generated during and/or analyzed during the current study are not publicly available but are available from the corresponding author on reasonable request.
References
National Comprehensive Cancer Network Inc 2021 practice guidelines in oncology–thyroid carcinoma v.3. Accessed October 15, 2021. http://www.nccn.org/professionals/physician_gls/PDF/thyroid.pdf
Abbreviations
- APCDI
annual per capita disposable income
- ATA
American Thyroid Association
- CT
computed tomography
- DFS
disease-free survival
- ENE
extranodal extension
- ETE
extrathyroidal extension
- IPTW
inverse probability of treatment weighting
- IQR
interquartile range
- LN
lymph node
- MRI
magnetic resonance imaging
- OR
odds ratio
- PET
positron emission tomography
- PS
propensity score
- PTC
papillary thyroid cancer
- RAI
radioactive iodine
- RAIT
radioactive iodine therapy
- RPA
recursive partitioning analysis
- SES
socioeconomic status
- Tg
thyroglobulin
- TgAb
thyroglobulin antibody
- TSH
thyrotropin
- TT
total thyroidectomy
- VIF
variance inflation factor
- WRAIT
waiting time for radioactive iodine therapy
Author notes
Y.S., Q.S., and J.T. contributed equally to this work.
