


Abstract
It is still not clear how the free triiodothyronine (FT3) to free thyroxine (FT4) ratio affects the prognosis of acute myocardial infarction (AMI), especially the risk of heart failure (HF) subsequent to AMI.
The purpose of this study was to see how peripheral sensitivity to thyroid hormones, as measured by the FT3/FT4 ratio, affected HF and mortality after AMI.
Our study was a retrospective cohort study. The primary endpoint was HF after AMI during and after hospitalization. The secondary endpoints were all-cause death and cardiovascular death after hospitalization.
The main sample included 3648 inpatients with AMI with a median age of 61.0 years; 68.9% were male. In the fully adjusted model, compared with patients in the lowest Q1 of the FT3/FT4 ratio, the risk of in-hospital HF in the highest Q4 patients was reduced by 44% (OR 0.56, 95% CI 0.44-0.72, P trend < .001), the risk of out-of-hospital HF was reduced by 37% (HR 0.63, 95% CI 0.48-0.84, P trend < .001), and the risks of all-cause and cardiovascular death were also significantly reduced. The analysis of different subgroups is consistent with the overall results. Furthermore, the sensitivity analysis of the euthyroid sample of 2484 patients was consistent with the main sample. Mediation analysis showed that altered levels of amino-terminal pro-B-type natriuretic peptide were mediators between the FT3/FT4 ratio and all endpoints in our study.
The thyroid hormone peripheral sensitivity of the FT3/FT4 ratio is an independent predictor of HF and mortality after AMI.
Sensitivity to thyroid hormones has received increasing attention in recent years (1-7). The thyroid hormone is a key regulator of metabolism and has a complex relationship with the cardiovascular system through multiple mechanisms (8). Thyroxine (T4) is the main product of thyroid secretion, but it is considered to be a prohormone with low biologic activity (9). When T4 is transported to the peripheral target cells, T4 is catalyzed by iodothyronine deiodinase (DIO) to remove iodine at the 5′ position to form triiodothyronine (T3) with more biological activity (10-12). The increase in peripheral DIO activity increases the conversion rate of T4 to T3 and the bioavailability of thyroid hormones. Therefore, the free triiodothyronine (FT3) to free thyroxine (FT4) ratio can be regarded as an index to evaluate peripheral DIO activity (13-17). The FT3/FT4 ratio represents the peripheral metabolism of thyroid hormones and is used to evaluate the peripheral sensitivity to thyroid hormones (1-7). A higher FT3/FT4 ratio indicates greater peripheral thyroid hormone sensitivity.
Under physiologic conditions, thyroid function is regulated by the hypothalamic–pituitary–thyroid axis through the classic endocrine feedback loop mechanism (18-20). However, some acute diseases (including acute myocardial infarction [AMI] and heart failure [HF]) can disturb the normal negative feedback regulation of thyroid function, affecting thyroid hormone homeostasis (21). The FT3/FT4 ratio can more comprehensively characterize thyroid hormone homeostasis modulation than FT3 or FT4 alone (2, 8). In addition, our research group has previously confirmed that, compared with FT3 and FT4 levels in the general population, the FT3/FT4 ratio can better predict all-cause mortality, cardiovascular mortality, and cardiovascular disease risk (22). However, the influence of the FT3/FT4 ratio on prognosis in AMI patients, specifically the development of HF subsequent to AMI, remains uncertain.
Based on the AMI cohort established by the Second Affiliated Hospital of Harbin Medical University (HMUSAH), we explored the effect of thyroid hormone peripheral sensitivity of the FT3/FT4 ratio on the prognosis of AMI patients.
Materials and Methods
Study Population
The AMI cohort established by the HMUSAH has been described in the past (23). In short, this AMI cohort is part of a registered study established under the support of the National 13th Five-Year Key R&D Program of China. All enrolled patients signed written informed consent. The research protocol was approved by the Ethics Committee of HMUSAH (KY2017-249) and was performed in accordance with the Declaration of Helsinki.
In this study, 4335 consecutive patients with AMI were enrolled from April 1, 2017, to March 31, 2019. We used the fourth edition of the “Global Definition of Myocardial Infarction” criteria to define AMI, which required clinical evidence of both acute myocardial injury and acute myocardial ischemia (24). We excluded patients under 18 years of age or without measured FT3, FT4, and thyroid-stimulating hormone (TSH) levels (n = 506), and we further excluded 118 patients for the following conditions: previous HF, severe liver disease, uremia, malignancies, and patients using drugs that affect thyroid function tests (amiodarone, long-term use of glucocorticoids, chronic intravenous dobutamine, lithium). We included the remaining patients as the main sample in our analysis, for a total of 3648 patients. We further excluded 1164 patients with previous thyroid dysfunction and patients with FT3, FT4, and TSH values outside the reference range. Finally, a sample of 2484 patients with normal thyroid function were included for sensitivity analysis. Figure 1 depicts the complete data integration process.
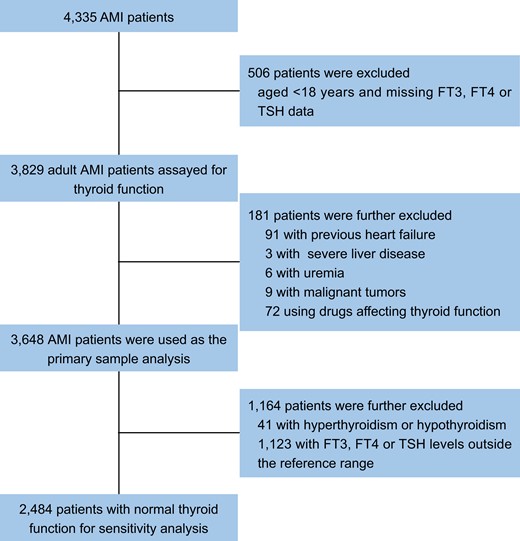
Flow chart. Abbreviations: AMI, acute myocardial infarction; FT3, free triiodothyronine; FT4, free thyroxine; TSH, thyroid-stimulating hormone.
Determination of Serum Thyroid Function
Thyroid function tests were drawn on an empty stomach in the early morning of the next day after admission, after at least an 8-hour overnight fast. Then the blood samples were sent to the laboratory immediately after collection. The levels of FT3, FT4, and TSH were detected using the chemiluminescence method on an AIA2000 automated immunoassay analyzer in the laboratory of the HMUSAH. In our central laboratory, the normal reference ranges for thyroid function are the following: FT3, 2.43-6.01 pmol/L; FT4, 9.01-19.5 pmol/L; and TSH, 0.35-4.94 µIU/mL.
Study Outcomes
The primary endpoint was HF post-AMI after and during hospitalization. The secondary endpoints were all-cause death and cardiovascular death post-AMI after hospitalization. All participants were followed for HF and death at 1, 3, 6, and every 6 months after discharge by cardiovascular physicians. They were either seen at our outpatient clinic designed to follow up patients with AMI, or contacted by telephone if they were unable to come in person for follow-up. A standardized medical questionnaire was administered to all patients. Based on the patient's condition, the corresponding examinations, and laboratory tests determined the endpoint of HF and guided treatment. All the above-mentioned information was uploaded to the patient's medical record management system (Thinvent Technology, Nanchang, China). When determining the HF event, 2 additional cardiovascular physicians reviewed all the above medical records again to ensure the accuracy of the results.
The definition of HF was mainly made based on the Framingham study (25) and 2016 European Society of Cardiology guidelines (26). Patients with HF post-AMI were defined as symptoms of dyspnea with 1 or more of the following: treatment with diuretic or intravenous vasodilator therapy for HF, pulmonary rales, edema of lower limbs, radiographic evidence of pulmonary congestion, or third heart sounds together with persistent sinus tachycardia. Patients with amino-terminal pro-B-type natriuretic peptide (NT-proBNP) < 300 pg/mL in the acute setting and patients with NT-proBNP < 125 pg/mL in the chronic setting were excluded from the HF definition. Cardiovascular causes of death included HF, myocardial infarction, malignant arrhythmia, cardiogenic shock, cardiac rupture, and sudden death.
Data Collection and Study Variables
In this study, all clinical care decisions were made by cardiovascular physicians in accordance with current standards of guideline recommendations; clinical data collection was performed by the clinical research coordinator according to standardized protocols. The researchers did not participate in the determination of the clinical treatment plan or the collection of original data, but they cleaned and analyzed the existing data. Study variables included demographics, anthropometrics, vital signs at admission, laboratory and echocardiographic parameters, AMI types, previous history or comorbidities, coronary conditions, and oral medication. In the current study, body mass index (BMI) was calculated as weight (kg)/[height (m)]2. In addition, we used the Chronic Kidney Disease Epidemiology Collaboration equation to calculate the estimated glomerular filtration rate (27). We defined chronic kidney disease as estimated glomerular filtration rate < 60 mL/min/L.
Statistical Analysis
Patients were stratified into 4 groups based on FT3/FT4 ratio quartiles. We used the Kolmogorov–Smirnov test to determine continuous variable normality and the Kruskal–Wallis test for analysis of non-normally distributed continuous variables, reported as median (interquartile range). We reported categorical variables as numbers (%) and used the chi-square test for analysis. Linear regression for continuous variables and logistic regression for categorical variables were used to assess the trend of baseline characteristics across FT3/FT4 ratio strata. Multiple imputation was conducted using chained equations to impute missing values.
The Poisson distribution was used to estimate HF and death incidence rates and 95% CI, presented as events rate per 1000 person-years of follow-up. We used restricted cubic splines (RCSs) (4 nodes, 25th percentile as reference point) to assess multivariate nonlinear associations of the FT3/FT4 ratio with HF and mortality after AMI. We used the Kaplan–Meier method to analyze the cumulative event rates of outcomes after hospitalization, and the log-rank test was utilized to compare group differences.
In primary and normal thyroid function test samples, we used logistic regression models to estimate the association of the FT3/FT4 ratio with HF during hospitalization. The Fine and Gray competing risk model was used to estimate the association between the FT3/FT4 ratio and HF after hospitalization, and we considered non-HF death as a competing risk. Similarly, when we analyzed the association between the FT3/FT4 ratio and cardiovascular death, we considered non-cardiovascular death as a competing risk. We used Cox proportional hazards models to estimate the association between the FT3/FT4 ratio and all-cause mortality. We further used gender, age, BMI, MI types, hypertension, diabetes, and chronic kidney disease for subgroup analysis. We used multiplicative interactions to see if the connections between the FT3/FT4 ratio and outcomes were affected by these underlying determinants.
We performed mediation analyses using the Python package pingouin 0.3.12. Mediation analysis was carried out for metabolic, cardiovascular, and renal markers as possible mediators of the association of the FT3/FT4 ratio with HF and mortality among individuals. In the mediation analysis, we adjusted for the potential confounders including gender, age, MI types, smoking, BMI, hypertension, diabetes, previous MI, previous percutaneous coronary intervention, and previous coronary artery bypass grafting, multivessel disease, percutaneous coronary intervention during this hospitalization, triglyceride (TG), total cholesterol, creatinine, cardiac troponin I, heart rate, TSH, and NT-proBNP.
We used Stata Version 17.0 (Stata Corp. College Station, TX) and python version 3.7 (Python Software Foundation, Wilmington, DE) for the analyses. P < .05 was considered to be statistically significant.
Results
Participant Characteristics
In our study, we analyzed 3648 subjects as the primary sample, with a median age of 61.0 (53.0-69.0) years, 68.9% male, and 68.3% ST segment elevation myocardial infarction (STEMI). Table 1 shows the characteristics of the study population grouped according to the FT3/FT4 ratio quartile. Patients with higher FT3/FT4 ratio tended to be younger, more likely to be male and smoke, had fewer multivessel illnesses, were less likely to have hypertension and diabetes, had higher BMI and TG level, and lower NT-proBNP and creatinine level.
Patient characteristics by quartiles of the FT3/FT4 ratio at baseline in the main sample (n = 3648)
| Q1 | Q2 | Q3 | Q4 | P value | P trend | |
|---|---|---|---|---|---|---|
| ≤0.218 | 0.219-0.254 | 0.255-0.292 | >0.292 | |||
| Participants | 912 | 912 | 912 | 912 | ||
| Age, years | 65.0 (58.0-72.0) | 63.0 (54.0-70.0) | 59.0 (51.0-67.0) | 58.0 (49.0-65.0) | <.001 | <.001 |
| Male | 468 (51.3) | 608 (66.7) | 689 (75.5) | 747 (81.9) | <.001 | <.001 |
| Smoking | 531 (58.2) | 575 (63.0) | 625 (68.5) | 661 (72.5) | <.001 | <.001 |
| BMI, kg/m2 | 24.0 (21.6-26.7) | 24.5 (22.4-27.1) | 25.0 (22.9-27.6) | 25.4 (23.3-27.8) | <.001 | <.001 |
| Heart rate, beats/min | 79.0 (68.0-90.0) | 81.0 (72.3-90.0) | 83.0 (72.3-91.0) | 82.0 (73.0-90.0) | <.001 | <.001 |
| STEMI | 628 (68.9) | 643 (70.5) | 621 (68.1) | 598 (65.6) | .149 | .152 |
| PCI | 762 (83.6) | 755 (82.8) | 765 (83.9) | 770 (84.4) | .814 | .816 |
| Multivessel disease | 474 (52.0) | 398 (43.6) | 382 (41.9) | 346 (37.9) | <.001 | <.001 |
| Hypertension | 538 (59.0) | 486 (53.3) | 469 (51.4) | 407 (44.6) | <.001 | <.001 |
| Diabetes | 291 (31.9) | 229 (25.1) | 198 (21.7) | 133 (14.6) | <.001 | <.001 |
| EF, % | 59.0 (50.0-62.0) | 60.6 (54.0-62.0) | 61.0 (55.0-63.0) | 61.0 (55.1-63.0) | <.001 | <.001 |
| cTNI, ng/L | 34.6 (10.6-91.6) | 31.1 (10.2-95.1) | 29.4 (7.7-85.4) | 31.6 (7.8-101.4) | .251 | .246 |
| NT-proBNP, pmol/L | 2041.5 (699.0-5199.0) | 1152.0 (383.3-2554.5) | 756.5 (307.0-1784.0) | 634.0 (221.5-1466.3) | <.001 | <.001 |
| eGFR, mL/min/1.73 m2 | 74.0 (56.5-90.2) | 81.9 (66.9-94.6) | 85.5 (70.6-96.6) | 87.3 (72.6-98.0) | <.001 | <.001 |
| Creatinine, μmol/L | 84.0 (69.0,104.0) | 81.0 (70.0,97.0) | 82.0 (71.0,94.0) | 82.0 (72.0,94.0) | .017 | <.001 |
| TG, mmol/L | 1.3 (0.9-1.8) | 1.4 (1.0-1.9) | 1.4 (1.0-2.0) | 1.5 (1.0-2.2) | .001 | .010 |
| TC, mmol/L | 4.6 (3.8-5.3) | 4.6 (4.0-5.3) | 4.6 (3.9-5.4) | 4.5 (3.9-5.2) | .249 | .169 |
| FT3, pmol/L | 2.6 (2.3-3.0) | 3.1 (2.9-3.4) | 3.4 (3.2-3.7) | 3.8 (3.5-4.2) | <.001 | <.001 |
| FT4, pmol/L | 14.0 (12.7-15.6) | 13.1 (12.1-14.2) | 12.5 (11.6-13.6) | 11.8 (11.0-12.9) | <.001 | <.001 |
| TSH, µIU/mL | 0.6 (0.3-1.1) | 0.7 (0.4-1.3) | 0.8 (0.4-1.6) | 1.0 (0.5-2.1) | <.001 | <.001 |
| Aspirin | 868 (95.2) | 887 (97.3) | 895 (98.1) | 898 (98.5) | <.001 | <.001 |
| Clopidogrel/ticagrelor | 875 (95.9) | 892 (97.8) | 899 (98.6) | 898 (98.5) | <.001 | .004 |
| Statins | 855 (93.8) | 888 (97.4) | 889 (97.5) | 894 (98.0) | <.001 | <.001 |
| ACEI/ARB | 641 (70.3) | 687 (75.3) | 694 (76.1) | 712 (78.1) | .001 | .002 |
| β-Blocker | 866 (95.0) | 891 (97.7) | 885 (97.0) | 884 (96.9) | .008 | .020 |
| Spironolactone | 271 (29.7) | 240 (26.3) | 194 (21.3) | 224 (24.6) | <.001 | <.001 |
Data are presented as median (25th; 75th percentile) or n (%).
Abbreviations: ACEI, angiotensin converting enzyme inhibitor; ARB, angiotensin II receptor blocker; BMI, body mass index; cTNI, cardiac troponin I; EF, ejection fraction; eGFR, estimated glomerular filtration rate; FT3, free triiodothyronine; FT4, free thyroxine; NT-proBNP, amino-terminal pro-B-type natriuretic peptide; PCI, percutaneous coronary intervention; Q, quartile; STEMI, ST segment elevation myocardial infarction; TG, triglyceride; TC, total cholesterol; TSH, thyroid-stimulating hormone.
FT3/FT4 Ratio and Heart Failure During Hospitalization
A total of 880 patients developed HF during hospitalization. According to RCS fitting, after adjusting for all variables (model 2 of footnotes for Table 2), the risk of in-hospital HF gradually decreased with the increase in the FT3/FT4 ratio (Fig. 2A). We further analyzed the correlation between the FT3/FT4 ratio and in-hospital HF based on logistic regression. Similar to the unadjusted results, the FT3/FT4 ratio Q4 group had a lower risk for in-hospital HF than the Q1 group in the adjusted model (model 2; OR 0.56, 95% CI 0.44-0.72, P trend < .001) (Table 2).
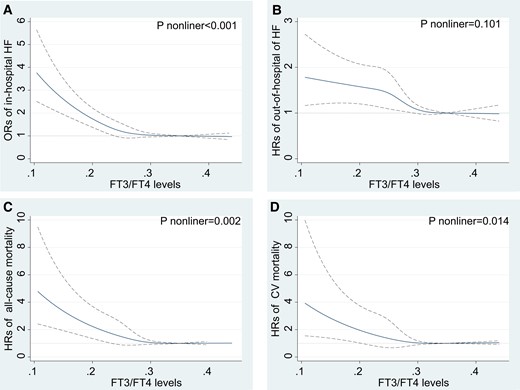
RCS fitting for the correlation between FT3/FT4 ratio with outcomes after AMI based on fully adjusted models in the main sample (n = 3648). HRs or ORs were evaluated by setting the FT3/FT4 value = 0.218 as reference. (A) In-hospital heart failure based on logistic regression. (B) Out-of-hospital heart failure based on competing risks regression. (C) All-cause mortality based on Cox proportional regression. (D) Cardiovascular mortality based on competing risks regression. Abbreviations: AMI, acute myocardial infarction; HF: heart failure; FT3, free triiodothyronine; FT4, free thyroxine; HRs, hazard ratios; ORs, odds ratios.
The association of the FT3/FT4 ratio with the incidence of heart failure and mortality after AMI in the main sample (n = 3648)
| FT3/FT4 ratio | Q1 | Q2 | Q3 | Q4 | P trend | 1 SD increase |
|---|---|---|---|---|---|---|
| In-hospital HFa | ||||||
| Unadjusted | ref | 0.55 (0.45-0.67) | 0.37 (0.30-0.46) | 0.31 (0.25-0.39) | <.001 | 0.49 (0.43-0.56) |
| Model 1 | ref | 0.63 (0.51-0.77) | 0.48 (0.39-0.61) | 0.46 (0.36-0.58) | <.001 | 0.63 (0.55-0.72) |
| Model 2 | ref | 0.74 (0.60-0.93) | 0.59 (0.46-0.75) | 0.56 (0.44-0.72) | <.001 | 0.72 (0.63-0.82) |
| Out-of-hospital HFb | ||||||
| Unadjusted | ref | 0.71 (0.57-0.88) | 0.50 (0.39-0.64) | 0.41 (0.32-0.53) | <.001 | 0.62 (0.51-0.75) |
| Model 1 | ref | 0.75 (0.60-0.94) | 0.58 (0.45-0.75) | 0.51 (0.38-0.67) | <.001 | 0.71 (0.58-0.87) |
| Model 2 | ref | 0.80 (0.64-1.01) | 0.62 (0.48-0.81) | 0.56 (0.42-0.74) | <.001 | 0.75 (0.61-0.92) |
| Model 3 | ref | 0.88 (0.70-1.10) | 0.71 (0.54-0.92) | 0.63 (0.48-0.84) | <.001 | 0.83 (0.69-0.99) |
| All-cause mortalityb | ||||||
| Unadjusted | ref | 0.53 (0.36-0.77) | 0.37 (0.25-0.57) | 0.26 (0.16-0.42) | <.001 | 0.46 (0.36-0.59) |
| Model 1 | ref | 0.59 (0.40-0.86) | 0.48 (0.31-0.74) | 0.36 (0.22-0.59) | <.001 | 0.57 (0.44-0.74) |
| Model 2 | ref | 0.66 (0.45-0.98) | 0.55 (0.36-0.85) | 0.43 (0.25-0.72) | <.001 | 0.63 (0.48-0.82) |
| CV mortalityb | ||||||
| Unadjusted | ref | 0.46 (0.28-0.76) | 0.39 (0.23-0.67) | 0.27 (0.14-0.50) | <.001 | 0.51 (0.31-0.85) |
| Model 1 | ref | 0.53 (0.32-0.89) | 0.52 (0.30-0.91) | 0.37 (0.19-0.73) | .002 | 0.66 (0.39-1.09) |
| Model 2 | ref | 0.63 (0.37-1.08) | 0.63 (0.36-1.11) | 0.47 (0.23-0.92) | .025 | 0.75 (0.45-1.24) |
Model 1 adjusted for gender, age, MI types, smoking, BMI, hypertension, diabetes, previous MI, previous PCI, and previous CABG.
Model 2 further adjusted: multivessel disease, PCI during this hospitalization, TG, TC, creatinine, cTNI, heart rate, TSH, and NT-proBNP (because NT-proBNP is one of the diagnostic criteria for in-hospital HF, NT-proBNP is not included in Model 2 of in-hospital HF).
Model 3 is only suitable for out-of-hospital HF; replace NT-proBNP of Model 2 with in-hospital HF.
Abbreviations: BMI, body mass index; CABG, coronary artery bypass grafting; cTNI, cardiac troponin I; FT3, free triiodothyronine; FT4, free thyroxine; HF, heart failure; ref, reference; MI, myocardial infarction; NT-proBNP, amino-terminal pro-B-type natriuretic peptide; PCI, percutaneous coronary intervention; TG, triglyceride; TC, total cholesterol; TSH, thyroid-stimulating hormone.
Values are odds ratios (95% CI).
Values are hazard ratios (95% CI).
FT3/FT4 Ratio and Heart Failure After Hospitalization
During follow-up, a total of 511 AMI patients developed HF after hospitalization. The incidence rates per 1000 person-years were 193.4 (167.4-223.5), 129.1 (109.4-152.3), 87.0 (71.7-105.6), and 71.3 (57.7-88.2) among Q1, Q2, Q3, Q4 groups of the FT3/FT4 ratio quartiles (Table 3). According to RCS fitting, after adjusting for all variables (model 3 of footnotes for Table 2), the risk of out-of-hospital HF gradually decreased with the increase in the FT3/FT4 ratio (Fig. 2B). Figure 3A shows the Kaplan–Meier curve, which estimates the cumulative event rates of out-of-hospital HF in FT3/FT4 quartile groups.
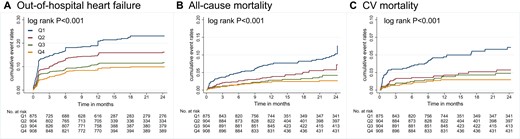
Cumulative incidence of out-of-hospital events by Kaplan–Meier survival curves across FT3/FT4 ratio quartiles in the main sample (n = 3648). (A) Out-of-hospital heart failure. (B) All-cause mortality. (C) Cardiovascular mortality. AMI, acute myocardial infarction; FT3, free triiodothyronine; FT4, free thyroxine.
Incidence rates per 1000 person-years across the FT3/FT4 ratio quartile groups
| FT3/FT4 ratio, mortality rate per 1000 person-years (95% CI) | ||||
|---|---|---|---|---|
| ≤0.218 | 0.219-0.254 | 0.255-0.292 | >0.292 | |
| Out-of-hospital heart failure | 193.4 (167.4-223.5) | 129.1 (109.4-152.3) | 87.0 (71.7-105.6) | 71.3 (57.7-88.2) |
| All-cause mortality | 66.2 (52.8-83.0) | 34.6 (25.7-46.6) | 24.3 (17.1-34.5) | 17.1 (11.3-25.9) |
| Cardiovascular mortality | 39.7 (29.7-53.1) | 17.7 (11.7-26.8) | 14.9 (9.5-23.2) | 10.1 (5.9-17.3) |
| Non–cardiovascular mortality | 26.5 (18.5-37.8) | 16.9 (11.0-25.8) | 9.4 (5.4-16.4) | 7.0 (3.7-13.3) |
| Non–heart failure mortality | 46.8 (35.8-61.2) | 28.1 (20.2-39.1) | 16.4 (10.8-25.1) | 11.7 (7.1-19.3) |
Based on competing risk regression, we analyzed the correlation between the FT3/FT4 ratio and out-of-hospital HF (Table 2). The FT3/FT4 ratio was significantly associated with the incidence of out-of-hospital HF in models unadjusted and adjusted for demographic characteristics, clinical risk factors, and common biomarkers (model 2; all P trend < .001). Even after adding in-hospital HF as a covariate in the final model (model 3), the FT3/FT4 ratio was independently associated with out-of-hospital HF risk. Compared with the Q1 group, the FT3/FT4 ratio Q4 group had a lower risk of out-of-hospital HF (HR 0.63, 95% CI 0.48-0.84, P trend < .001).
FT3/FT4 Ratio and Mortality After Hospitalization
A total of 171 patients experienced death after discharge, 99 patients had cardiovascular death. The incidence rates per 1000 person-years of all-cause mortality and cardiovascular mortality are shown in Table 3. RCS plots demonstrated that when the FT3/FT4 ratio grew, after adjusting for all variables (model 2 of footnotes for Table 2), the risk of all cause and cardiovascular mortality dropped gradually (Fig. 2C and 2D). Kaplan–Meier curves demonstrated lower all-cause and cardiovascular mortality in patients with a higher FT3/FT4 ratio during follow-up, both log-rank P < .001 (Fig. 3B and 3C).
In the fully adjusted Cox model, the FT3/FT4 ratio Q4 group had a lower risk of all-cause mortality compared with the Q1 group (model 2, HR 0.43, 95% CI 0.25-0.72, P trend < .001) (Table 2). The adjusted competing risks regression model showed a lower risk for cardiovascular mortality in the FT3/FT4 ratio Q4 group compared with the Q1 group (model 2, HR 0.47, 95% CI 0.23-0.92, P trend = 0.025; Table 2).
Subgroup Analysis
In subgroup analysis of HF, both during and after hospitalization, the prognostic impact of the FT3/FT4 ratio was all the more pronounced in patients aged <65 years (Fig. 4). In the subgroup analysis of all-cause death, the FT3/FT4 ratio showed a greater substantial influence in patients with BMI < 25 kg/m2, STEMI, and hypertension (Fig. S1A (28)). In the subgroup analysis of cardiovascular death, the FT3/FT4 ratio had a more significant effect on patients with STEMI and hypertension (Fig. S1B (28)). The remaining subgroups had no significant interactions. Overall, the analysis of the different subgroups was consistent with the overall results, all showing that higher FT3/FT4 ratio levels were associated with a lower risk of endpoint events.
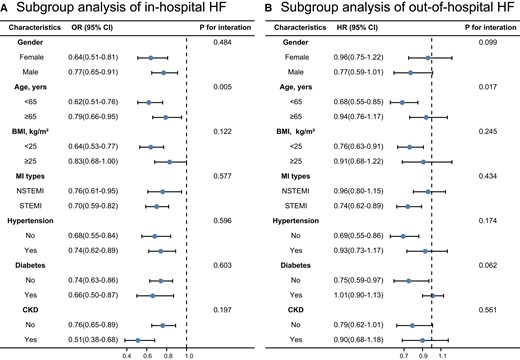
Stratified analysis of in-hospital HF (A) and out-of-hospital HF (B) based on the final model in the main sample (n = 3648). Abbreviations: HF, heart failure; MI, myocardial infarction; BMI, body mass index; STEMI, ST segment elevation myocardial infarction; NSTEMI, non–ST segment elevation myocardial infarction; CKD, chronic kidney disease.
Sensitivity Analyses in Euthyroid Samples
In sensitivity analyses, this process was repeated in euthyroid samples (n = 2484), after excluding 1164 patients with previous thyroid dysfunction and patients with FT3, FT4, and TSH values outside the reference range. It is surprising that the results were consistent with the main sample, and the FT3/FT4 ratio remained significantly associated with in-hospital and out-of-hospital HF in both unadjusted and fully adjusted models (model 2 for in-hospital HF and model 3 for out-of-hospital HF of footnotes for Table 4). The risk of all-cause death was significantly lower in patients with a higher FT3/FT4 ratio. And the risk of cardiovascular death had a trend toward lower in patients with a higher FT3/FT4 ratio; however, the difference did not reach statistical significance (Table 4).
The association of the FT3/FT4 ratio with the incidence of heart failure and mortality after AMI in the normal thyroid function sample (n = 2484)
| FT3/FT4 ratio | Q1 | Q2 | Q3 | Q4 | P trend | 1- SD increase |
|---|---|---|---|---|---|---|
| In-hospital HFa | ||||||
| Unadjusted | ref | 0.61 (0.47-0.80) | 0.42 (0.32-0.56) | 0.33 (0.24-0.44) | <.001 | 0.44 (0.37-0.54) |
| Model l | ref | 0.68 (0.51-0.90) | 0.53 (0.40-0.72) | 0.47 (0.34-0.64) | <.001 | 0.56 (0.46-0.69) |
| Model 2 | ref | 0.76 (0.57-1.01) | 0.60 (0.44-0.81) | 0.53 (0.38-0.74) | <.001 | 0.61 (0.49-0.75) |
| Out-of-hospital HFb | ||||||
| Unadjusted | ref | 0.66 (0.51-0.87) | 0.47 (0.35-0.63) | 0.36 (0.26-0.49) | <.001 | 0.48 (0.39-0.59) |
| Model l | ref | 0.69 (0.53-0.92) | 0.53 (0.39-0.72) | 0.42 (0.30-0.59) | <.001 | 0.54 (0.43-0.67) |
| Model 2 | ref | 0.76 (0.57-1.02) | 0.58 (0.42-0.80) | 0.48 (0.34-0.69) | <.001 | 0.59 (0.47-0.73) |
| Model 3 | ref | 0.81 (0.61-1.08) | 0.64 (0.46-0.88) | 0.56 (0.39-0.79) | <.001 | 0.65 (0.52-0.81) |
| All-cause mortalityb | ||||||
| Unadjusted | ref | 0.59 (0.37-0.95) | 0.35 (0.20-0.60) | 0.27 (0.15-0.49) | <.001 | 0.40 (0.28-0.59) |
| Model l | ref | 0.63 (0.39-1.02) | 0.42 (0.24-0.73) | 0.36 (0.19-0.68) | <.001 | 0.50 (0.33-0.75) |
| Model 2 | ref | 0.75 (0.45-1.24) | 0.52 (0.29-0.93) | 0.47 (0.25-0.91) | .010 | 0.61 (0.41-0.93) |
| CV mortalityb | ||||||
| Unadjusted | ref | 0.53 (0.28-1.01) | 0.38 (0.19-0.77) | 0.27 (0.12-0.59) | .001 | 0.47 (0.27-0.81) |
| Model 1 | ref | 0.59 (0.30-1.16) | 0.48 (0.23-1.02) | 0.36 (0.15-0.85) | .017 | 0.59 (0.33-1.07) |
| Model 2 | ref | 0.70 (0.34-1.44) | 0.60 (0.28-1.33) | 0.46 (0.20-1.08) | .077 | 0.72 (0.41-1.26) |
Model 1 adjusted for gender, age, MI types, smoking, BMI, hypertension, diabetes, previous MI, previous PCI, and previous CABG.
Model 2 further adjusted: multivessel disease, PCI during this hospitalization, TG, TC, creatinine, cTNI, heart rate, TSH, and NT-proBNP (because NT-proBNP is one of the diagnostic criteria for in-hospital HF, NT-proBNP is not included in Model 2 of in-hospital HF).
Model 3 is only suitable for out-of-hospital HF; replace NT-proBNP of model 2 with in-hospital HF.
Abbreviations: BMI, body mass index; CABG, coronary artery bypass grafting; cTNI, cardiac troponin I; HF, heart failure; FT3, free triiodothyronine; FT4, free thyroxine; MI, myocardial infarction; NT-proBNP, amino-terminal pro-B-type natriuretic peptide; PCI, percutaneous coronary intervention; ref, reference; TG, triglyceride; TC, total cholesterol; TSH, thyroid-stimulating hormone.
Values are odds ratios (95% CI).
Values are hazard ratios (95% CI).
Mediation Analysis
When we looked at the biological mechanisms that could be linked to the FT3/FT4 ratio and the incidence of HF after AMI, we discovered that altered NT-proBNP mediated 16.72% and 6.00%, and creatinine mediated 29.01% and 12.00% of the associations of in-hospital and out-of-hospital HF, respectively (Table 5). TG explained 3.10% and BMI explained 2.25% of the relationship between the FT3/FT4 ratio and in-hospital HF (Table 5). Heart rate explained 3.50% of the relationship between the FT3/FT4 ratio and out-of-hospital HF (Table 5). In the mediation analysis of all-cause death and cardiovascular death, we found that only NT-proBNP were mediators of the FT3/FT4 ratio and event occurrence (Table S1 (28)).
Mediation analysis for metabolic, cardiovascular, and renal markers as possible mediators of the association of the FT3/FT4 ratio with heart failure among individualsa
| Total effect | Direct effect | Indirect effect | % Mediatedb | ||||||||||
|---|---|---|---|---|---|---|---|---|---|---|---|---|---|
| OR | Lower | Upper | P value | OR | Lower | Upper | P value | OR | Lower | Upper | P value | ||
| 97.5% CI | 97.5% CI | 95% CI | 95% CI | 95% CI | 95% CI | ||||||||
| In-hospital HF | |||||||||||||
| NT-proBNP, pmol/L | 0.70117 | 0.59990 | 0.81873 | <.001 | 0.73712 | 0.63381 | 0.85813 | <.001 | 0.95028 | 0.90303 | 0.98118 | <.001 | 16.72% |
| cTNI, ng/L | 0.69350 | 0.59333 | 0.81058 | <.001 | 0.70117 | 0.59990 | 0.81873 | <.001 | 0.98906 | 0.97531 | 1.00200 | .100 | 3.10% |
| TG, mmol/L | 0.70893 | 0.60714 | 0.82779 | <.001 | 0.70117 | 0.59990 | 0.81873 | <.001 | 1.01106 | 1.00300 | 1.02532 | <.001 | −3.10% |
| TC, mmol/L | 0.70047 | 0.59990 | 0.81873 | <.001 | 0.70117 | 0.59990 | 0.81873 | <.001 | 0.99900 | 0.99501 | 1.00100 | .736 | 0.28% |
| BMI, kg/m2 | 0.69559 | 0.59571 | 0.81221 | <.001 | 0.70117 | 0.59990 | 0.81873 | <.001 | 0.99203 | 0.98118 | 0.99900 | .028 | 2.25% |
| Heart rate, beats/min | 0.70187 | 0.60110 | 0.81955 | <.001 | 0.70117 | 0.59990 | 0.81873 | <.001 | 1.00100 | 0.99302 | 1.00904 | .716 | −0.28% |
| Creatinine, μmol/L | 0.63255 | 0.54010 | 0.74008 | <.001 | 0.70117 | 0.59990 | 0.81873 | <.001 | 0.90213 | 0.85727 | 0.93333 | <.001 | 29.01% |
| Out-of-hospital HF | |||||||||||||
| NT-proBNP, pmol/L | 0.80977 | 0.70893 | 0.92404 | .002 | 0.81873 | 0.71749 | 0.93426 | .003 | 0.98807 | 0.96079 | 0.99800 | <.001 | 6.00% |
| cTNI, ng/L | 0.81302 | 0.71106 | 0.92960 | .003 | 0.81873 | 0.71749 | 0.93426 | .003 | 0.99302 | 0.97336 | 1.00803 | .384 | 3.50% |
| TG, mmol/L | 0.82037 | 0.71892 | 0.93613 | .003 | 0.81873 | 0.71749 | 0.93426 | .003 | 1.00200 | 0.99501 | 1.01308 | 0.612 | −1.00% |
| TC, mmol/L | 0.81791 | 0.71677 | 0.93333 | .003 | 0.81873 | 0.71749 | 0.93426 | .003 | 0.99900 | 0.99402 | 1.00100 | .368 | 0.50% |
| BMI, kg/m2 | 0.81546 | 0.71462 | 0.93053 | .003 | 0.81873 | 0.71749 | 0.93426 | .003 | 0.99601 | 0.98708 | 1.00000 | .120 | 2.00% |
| Heart rate, beats/min | 0.82448 | 0.72253 | 0.94082 | .004 | 0.81873 | 0.71749 | 0.93426 | .003 | 1.00702 | 1.00100 | 1.01715 | .012 | −3.50% |
| Creatinine, μmol/L | 0.79932 | 0.70047 | 0.91211 | .001 | 0.81873 | 0.71749 | 0.93426 | .003 | 0.97629 | 0.95504 | 0.99302 | .008 | 12.00% |
Abbreviations: BMI, body mass index; CABG, coronary artery bypass grafting; cTNI, cardiac troponin I; HF, heart failure; FT3, free triiodothyronine; FT4, free thyroxine; MI, myocardial infarction; NT-proBNP, amino-terminal pro-B-type natriuretic peptide; PCI, percutaneous coronary intervention; ref, reference; TG, triglyceride; TC, total cholesterol; TSH, thyroid-stimulating hormone.
Odd ratios were adjusted for gender, age, MI types, smoking, BMI, hypertension, diabetes, previous MI, previous PCI, and previous CABG; multivessel disease, PCI during this hospitalization, TG, TC, creatinine, cTNI, heart rate, TSH, and NT-proBNP (because NT-proBNP is one of the diagnostic criteria for in-hospital HF, NT-proBNP is not included in the correction factor for in-hospital HF).
The percentage mediated was calculated by log (indirect effect)/log (total effect).
Discussion
We found that the thyroid hormone peripheral sensitivity of the FT3/FT4 ratio is an independent predictor of HF and mortality after AMI. These associations were independent of traditional clinical factors and biomarkers, and were confirmed in patients with normal thyroid function.
This study demonstrated for the first time a significant association between FT3/FT4 and new-onset HF after AMI, which is a unique and innovative feature of this study. Several mechanisms may explain the link. For instance, some factors that cause the reduction of FT3/FT4 levels, such as silencing DIO2, lead to increased reactive oxygen species in cardiomyocytes, decreased mitochondrial unfolded protein response, severely impaired mitochondrial respiration, and decreased cell survival (29). However, factors that cause an increase in FT3/FT4 levels, such as pretreatment with triiodothyronine in a mouse model of myocardial infarction (30), the use of triiodothyronine for reperfusion in an ischemia–reperfusion model (31), or a short-term infusion of triiodothyronine after ischemia–reperfusion (32), can reduce myocardial apoptosis, inflammation, infarct size, myocardial fibrosis, and improve left ventricular function after myocardial infarction. Therefore, the FT3/FT4 ratio plays a key role in left ventricular remodeling, cardiovascular function maintenance, and mitochondrial integrity after ischemia.
In addition, there is still a lack of clinical studies on the correlation between FT3/FT4 ratio and HF after AMI, but some observational studies have similar results to ours. A study of patients with HF confirmed that the FT3/FT4 ratio is a predictor for the severity and prognosis of HF, and that a lower FT3/FT4 ratio predicts higher all-cause death and cardiovascular death in patients with HF. In this subgroup analysis, a lower FT3/FT4 ratio was a stronger predictor of all-cause and cardiovascular mortality in patients with previous myocardial infarction (12). Another study involving 130 patients with AMI found that patients with low T3 syndrome had impaired late diastolic longitudinal strain rates and left ventricular rotation than those with normal T3, but T4 levels did not differ significantly between the 2 groups (33). Therefore, we hypothesized that patients with lower FT3/FT4 ratio in this sample might also have impaired cardiac function. In addition, we also found in our study that the baseline FT3/FT4 ratio was negatively correlated with baseline NT-proBNP levels (r = −0.304, P < .001), was positively associated with baseline ejection fraction (r = 0.129, P < .001), and the group with a higher FT3/FT4 ratio had less multivessel disease. These data also supported our main findings that higher FT3/FT4 ratios were connected to a lower risk of HF.
Previous research has indicated that the FT3/FT4 ratio can predict the long-term risk of death from cardiovascular disease. For example, Yu et al enrolled 953 patients with AMI undergoing percutaneous coronary intervention and discovered that the FT3/FT4 ratio was an independent predictor of 1 year all-cause death (34). Yuan et al discovered that in individuals with 3-vessel coronary disease, low FT3/FT4 ratios were independently related to an elevated risk of long-term cardiac death and severe cardiac and cerebrovascular events (35). These studies are consistent with our results, but there is still a lack of comprehensive prognostic analysis of FT3/FT4 and the prognosis of patients with AMI, especially the risk of HF subsequent to AMI. Our study found that higher baseline FT3/FT4 ratios were independently associated with a lower risk of HF, and all-cause and cardiovascular death. Baseline FT3/FT4 ratios are very robust prognostic predictors of myocardial infarction. However, additional well-designed studies are needed to confirm the causal relationship and related mechanism between thyroid hormone peripheral sensitivity and the prognosis of AMI. It is worth mentioning that FT3/FT4 is very easy to measure and does not increase the clinical burden, which is very worthy of promotion.
Although we have carefully adjusted for many potential confounding factors, residual confounding from unmeasured variables remains a possibility. Firstly, we did not measure some variables that were difficult to accurately capture, such as diet, patient disease awareness, homecare, and so on. To reduce the effect of diet, we measured thyroid function in the fasted state. To strengthen patients’ awareness of the disease and the knowledge of home care, we regularly follow up with patients after discharge. But these unmeasured variables could still confound the correlation of FT3/FT4 with the outcome. Secondly, similar to many previous cohort clinical studies (2, 36-39), patients were tested for thyroid function on an empty stomach in the early morning of the next day after admission, rather than immediately after admission. However, thyroid hormone levels are affected by the clinical status of patients (21, 40). Patients with AMI who received standard care after hospitalization may improve their clinical status, resulting in changes in the FT3/FT4 ratio. No generally accepted metric is available for objectively evaluating the general status of patients, so we did not collect the general status of patients during thyroid function measurement. This could lead to an overestimation of the relationship between FT3/FT4 ratio and outcome. Lastly, due to the limited collection of variables in the cohort, we did not record the use of heparin, which may cause bias in the results. However, heparin will be rapidly metabolized over time, diminishing its effect on thyroid function (41). In the meantime, heparin enhanced the competitive binding ability of free fatty acids to thyroid hormone–binding protein by increasing triglyceride to free fatty acid metabolism, which increases FT3 and FT4 content (42), but the effect on FT3/FT4 ratio is still unknown. Furthermore, we corrected the triglyceride variable in the multivariate analysis, which may have reduced the effect of heparin on the results to some extent.
Our research has some other limitations. This was a single-center study. Most of the population is from northeast China, and whether it is applicable to other populations with different genetic backgrounds needs to be further verified. However, the relatively large sample size of our study provides good evidence for assessing the relationship between the FT3/FT4 ratio and prognosis of AMI. In addition, we only measured thyroid function once and did not observe the dynamic evolution of thyroid function, but the baseline FT3/FT4 ratio also provided a very good predictive role for the prognosis of patients with AMI.
Conclusion
The thyroid hormone peripheral sensitivity of the FT3/FT4 ratio is an independent predictor of HF and mortality after AMI. This information will be valuable for early risk stratification after AMI and also provide potential intervention targets for patients with AMI.
Acknowledgments
We would like to thank all of the authors for their efforts and support.
Funding
The National Natural Science Foundation of China (grant 81770255), the Key Laboratory of Myocardial Ischemia, Ministry of Education (grant KF202216), the thyroid research program of young and middle-aged physicians (grant BJHPA-2022-JZHXZHQNYJ-LCH-04).
Author Contributions
L.X.Y., conceptualization; writing-original draft; formal analysis. Z.B., software; writing-review; editing. F.S.H., software; data curation. L.L.L., formal analysis. L.Z.Y., software; data curation. W.N.L., collected data. Z.Y.H., collected data. X.L., conceptualization; software. L.Y.L., formal analysis; writing—original draft. Z.Y., writing—review; editing.
Disclosures
All authors declare no conflict of interest.
Data Availability
Some or all datasets generated during and/or analyzed during the current study are not publicly available but are available from the corresponding author on reasonable request.
Ethics Statement
This study was approved by the Ethics Committee of Harbin Medical University (KY2017-249) and was performed in accordance with the Declaration of Helsinki.
Clinical Trial Information
ClinicalTrials.gov ID: NCT03297164 (registered September 29, 2017).
References
Abbreviations
- AMI
acute myocardial infarction
- BMI
body mass index
- DIO
iodothyronine deiodinase
- FT3
free triiodothyronine
- FT4
free thyroxine
- HF
heart failure
- NT-proBNP
amino-terminal pro-B-type natriuretic peptide
- RCS
restricted cubic spline
- STEMI
ST segment elevation myocardial infarction
- T3
triiodothyronine
- T4
thyroxine
- TG
triglyceride;
- TSH
thyroid-stimulating hormone
