


Abstract
Anti-Müllerian hormone (AMH) levels strongly correlate with the number of antral follicles (total follicle count, TFC) in the ovary. In women with polycystic ovary syndrome (PCOS), this is reflected by significantly increased serum AMH levels. Different assays have been developed to measure AMH. However, little is known about the interassay correlation in women with increased AMH levels.
To investigate the correlation of AMH values between different AMH assays and with TFC in PCOS patients.
AMH levels were measured in 1660 PCOS patients, using 3 different AMH assays: Gen II (Beckman Coulter); picoAMH (Ansh Labs); and Elecsys (Roche). Passing Bablok regression was used to compare assay methods. Spearman’s correlation was used to correlate AMH levels and TFC.
Strong interassay correlations were present over the total range of AMH levels (0.81-0.94). Stratification in subgroups, revealed an AMH level–dependent interassay correlation with strong interassay correlations in the low (<2.80 ng/mL) and high (>7.04 ng/mL) subgroups (0.62-0.86). However, the correlation in the mid-AMH subgroup (2.80-7.04 ng/mL) was only moderate (0.28-0.56). A strong correlation was present between the total range of AMH levels and TFC (0.57-0.62). However, in all 3 AMH subgroups the correlation became moderate at best, independently of assay method (0.11-0.45).
In conclusion, both the interassay correlation and the correlation between AMH level and follicle count depend on the range of serum AMH levels. This once more emphasizes the need of a standardization of AMH measurement for an accurate interpretation of AMH in clinical practice.
Anti-Müllerian hormone (AMH) is a gonadal specific member of the transforming growth factor beta family and is expressed by granulosa cells of growing gonadotrophin-independent follicles in the ovary (1, 2). AMH is secreted as a 140 kDa disulfide-linked homodimer (proAMH) (1). Activation of proAMH requires proteolytic cleavage resulting in a stable complex (AMHN,C), consisting of the N-terminal proregion (AMHN) and the C-terminal mature region (AMHC) (3). Both the AMHN,C and the AMHC isoforms can bind the AMH specific type II receptor (AMHRII) and, after binding to the AMH type I receptor, activate downstream SMAD signaling (4, 5). A second cleavage site is present at position aa229 in the N-terminal proregion, dividing the AMHN region into 2 additional isoforms, a pro-and a mid-region (AMHN,229 and AMHM, respectively) (6). Dimerization of the AMHM and the AMHC could result in another potential isoform (AMHM,C). Hence, there are theoretically in total at least 7 potential AMH isoforms that could be present in circulation (7).
Over the past years, both manual and automated assays have been developed to measure serum AMH levels and various assays are currently used in clinical practice. These assays use antibodies against specific AMH regions. The total AMH concentration measured in circulation therefore depends on the presence of specific AMH isoforms and the ability of the used antibodies to detect these isoforms. Together with the lack of a gold standard for AMH measurement, this has led to interassay variability. At the same time, AMH measurement has gained widespread use in clinical practice in monitoring ovarian reserve and predicting ovarian response to stimulation during in vitro fertilization (IVF) treatment (8, 9). Comparative analyses using different AMH assays have been performed in many different studies (10-15). However, these studies are difficult to compare as they use various inclusion criteria for their study populations, resulting in different regression equations per study. Therefore, a consensus on interassay correlation has not yet been established.
PCOS is a common heterogeneous disorder in women of reproductive age, characterized by a combination of ovulatory dysfunction, hyperandrogenism, and polycystic ovary morphology (PCOM) (16-18). AMH levels strongly correlate with the number of antral follicles, and in PCOS this results in significantly increased serum AMH levels (19, 20). Considering this strong correlation, the serum AMH level is suggested as a substitute for PCOM in women with PCOS (21). However, studies investigating AMH cut-offs for PCOM diagnosis have reported a broad range of values due to heterogeneous diagnostic criteria, intra-assay discrepancy, and the use of different AMH assays (22). In addition, studies comparing different AMH assays have mainly been performed in normo-ovulatory or (sub)fertile women with normal or low serum AMH levels (10-14); therefore, little is known about the interassay correlation in the higher range of AMH levels. Especially in women with PCOS, this has not been studied in detail.
Hence, in this study, we have compared 3 different AMH assays in a large cohort of women with PCOS: modified Gen II AMH enzyme-linked immunosorbent assay (ELISA) (Beckman Coulter), picoAMH assay (Ansh Labs), and the Elecsys AMH Plus assay (Roche). In addition, we have stratified our cohort into 3 subgroups based on the reported range of AMH cut-off values for PCOM to investigate whether the interassay correlation was consistent across AMH levels. As AMH levels strongly correlate with follicle count, we were also interested in determining whether this correlation was similar across the 3 different assays and whether this was consistent across AMH levels and different age categories.
Materials and Methods
Cohort
In the period 2005-2016 a total of 1660 women with PCOS were included in the study. Ethics approval was previously obtained for the studies from which residual serum samples were utilized. PCOS was diagnosed based on the Rotterdam criteria requiring at least 2 out of the following 3 criteria: (1) oligo- or amenorrhea, defined as chronic menstrual cycle interval >35 days; (2) clinical hyperandrogenism, defined as modified Ferriman–Gallwey score above 5 and/or biochemical hyperandrogenism, defined as elevated (>4.5) free androgen index (testosterone × 100/sex hormone–binding globulin); and (3) polycystic ovarian morphology, defined as 12 or more follicles of 2 to 9 mm in at least 1 ovary and/or an ovarian volume >10 mL using an ultrasound <12 MHz (18). The ultrasound equipment did not change during the entire period. To ensure that there was no investigator-driven bias in total follicle count (TFC), we performed a boxplot to visualize the average number of follicles over the years (data not shown). This did not show any pattern in TFCs over the years.
AMH Measurements
Blood samples were collected at the first visit to the clinic and immediately stored at –20°C. Samples were measured by 4 AMH assays: (1) Original Gen II AMH ELISA (Beckman Coulter, Inc., Webster, TX); (2) Modified Gen II AMH ELISA (catalog # A79765, RRID:AB_2800500) (Beckman Coulter, Inc., Webster, TX); (3) picoAMH assay (catalog # AL-124, RRID:AB_2783675) (Ansh Labs®, Webster, Texas, USA); and (4) Elecsys® AMH plus assay (catalog # 06331076, RRID:AB_2895131) (Roche Diagnostics International Ltd, Rothkreuz, Switzerland). All samples were measured in 3 different laboratories. Measurements with both Beckman Coulter assays were performed at the diagnostic endocrine laboratory of Erasmus University Medical Center, Rotterdam. Measurements with the picoAMH assay were performed at ANSH Labs (Webster, TX, USA) and measurements with the Elecsys AMH plus assay were performed at a diagnostic laboratory in Rothkreuz. The intra- and interassay variability was below 5% in all assays.
In the period 2005-2011, AMH was measured with the original Gen II AMH ELISA. These AMH values were per batch, adjusted to allow comparison with the modified Gen II ELISA as described previously (23). The Gen II AMH and the picoAMH are manual assays, whereas the Elecsys AMH plus assay is an automated assay. Both the Gen II AMH and the Elecsys AMH plus assays use the same capture antibody recognizing an epitope in the AMHN,229 region and the same detector antibody recognizing an epitope in the C-terminal region (AMHC) (24). The picoAMH assay has a capture antibody recognizing the C-terminal region, whereas the detector antibody recognizes the AMHM region. All AMH levels are presented in ng/mL.
All patients were divided into 3 subgroups based on previously reported AMH cut-off values for PCOM: low AMH (<2.80 ng/mL), mid AMH (2.80-7.04 ng/mL), and high AMH level (>7.04 ng/mL). These cut-off values are based on 5 studies, using different Beckman Coulter AMH assays, as described in a systematic review (22). Three of these studies used the Immunotech-Beckman AMH ELISA kit (IOT) (25-27), the other 2 studies used the predecessor of the modified Gen II AMH ELISA (28, 29). To investigate whether the correlation between AMH and follicle count was dependent on age, the total population was divided into 3 age categories based on an age-related nomogram of follicle count in normo-ovulatory women: (1) early reproductive age (<25 years) (2), mid reproductive age (25-30 years), and (3) late reproductive age (>31 years).
Statistical Analysis
Values are presented as median with interquartile range, unless indicated otherwise. Passing Bablok regression equations were used to pair-wise compare the different assay methods. The Bland–Altman plot was used to visualize the linearity of the assay method comparison and to check whether there was homoscedasticity between the variability in measurements. Correlations of AMH values with total follicle number and between the different assays were calculated and evaluated by Spearman’s rank correlation. Statistical analysis were performed using Rstudio, version 3.6.1 (http://www.rstudio.com/).
Results
Cohort Characteristics
In total, 1660 women diagnosed with PCOS were included in the study, with median age of 28 years (interquartile range 24-31), median body mass index of 25.1 kg/m2 (interquartile range 21.7-30.1), and median follicle count of 39 (interquartile range 28-55). Each sample was measured with all 3 AMH assays. The characteristics of the 3 AMH assays are described in Table 1. The Elecsys AMH plus assay yielded lower serum AMH levels over the total range compared with the picoAMH and the Gen II AMH assays (0.01-22.93 vs 0-47.96 and 0-78.50 respectively). This is also reflected by lower median and mean AMH levels measured by the Elecsys AMH plus assay. The median and mean AMH values were similar between the Gen II AMH and picoAMH assays, although the Gen II AMH measured a broader range of AMH levels (0.00-78.50 ng/mL) than the picoAMH assay (0.00-47.96 ng/mL) (Table 1).
Summary characteristics of AMH measurements of all 3 assays
| Characteristics | picoAMH (Ansh Labs) | Gen II AMH (Beckman Coulter) | Elecsys plus (Roche) |
|---|---|---|---|
| Median (IQR) (ng/mL) | 8.56 (5.56-12.98) | 7.90 (4.77-12.85) | 5.58 (3.81-8.45) |
| Mean ± SD (ng/mL) | 9.83 ± 6.12 | 9.90 ± 7.71 | 6.55 ± 3.93 |
| Measuring range (ng/mL) | 0.00-47.96 | 0.00-78.50 | 0.01-22.94 |
Assay characteristics of the picoAMH assay (Ansh Labs), Gen II AMH ELISA (Beckman Coulter), and Elecsys AMH plus assay (Roche). Data are presented as median (IQR), mean ± SD and range of AMH levels.
Abbreviations: AMH, anti-Müllerian hormone; IQR, interquartile range.
Comparison AMH Assays
Pearson’s correlation coefficients and the corresponding Bland–Altman plots of the comparative analysis between the 3 different assays are shown in Fig. 1. Pair-wise comparison of the 3 assays showed a strong interassay correlation over the total range of AMH levels. The Pearson correlation coefficients are Gen II AMH vs Elecsys AMH plus: 0.81; picoAMH vs Gen II AMH: 0.81; picoAMH vs Elecsys AMH plus: 0.94 (Fig. 1A-1C) (P < .001). The corresponding Bland–Altman plots, however, showed that the interassay correlations were not linear, reflected by an increasing difference in AMH measurement with higher AMH levels (Fig. 1D-1F). This is especially evident in the Elecsys AMH plus assay compared with the other 2 assays (Fig. 1D and 1F). Moreover, the regression equations showed that the Gen II AMH and the picoAMH assays measure approximately 77% and 55% higher serum AMH levels than the Elecsys AMH plus assay.
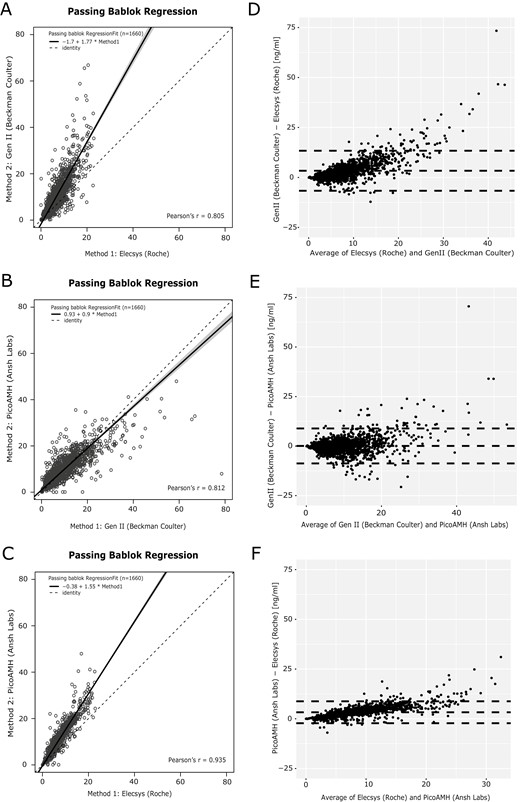
Passing–Bablok regression and Bland–Altman graphs. (A-C) Regression curves comparing AMH levels measured by the Gen II AMH ELISA (Beckman Coulter), Elecsys AMH plus assay (Roche), and picoAMH assay (Ansh Labs). Solid black lines are the regression curve with the 95% CI in grey relative to a slope of 1 (dotted black lines). (D-F) Bland–Altman graphs with a mean difference and 95% CI (dotted lines).
To investigate whether the correlation between AMH assays was consistent across serum AMH levels, we stratified the cohort in 3 subgroups based on reported AMH cut-off values for PCOM: low AMH (<2.80 ng/mL), mid AMH (2.80-7.04 ng/mL), and high AMH level (>7.04 ng/mL) (22). We repeated the regression analysis for these 3 subgroups (Fig. 2). The strongest interassay correlation was present in both the low AMH level and high AMH subgroups, ranging from 0.62 to 0.86 (Fig. 2A-2C and 2G-2I). Surprisingly, the correlation in the mid AMH level subgroup was much lower, with correlation coefficients ranging between 0.28 and 0.56 (Fig. 2D-2F). All correlations had P < .001.
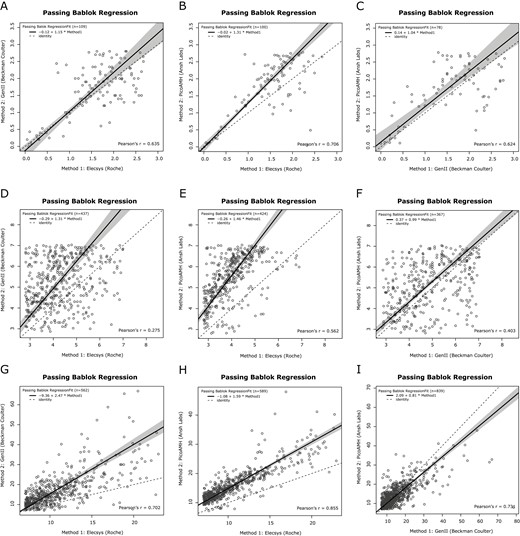
Passing–Bablok regression curves of the pair-wise comparison between assay-specific AMH methods across AMH subgroups. Regression curves comparing AMH levels measured by the Gen II AMH ELISA (Beckman Coulter), Elecsys AMH plus assay (Roche), and picoAMH assay (Ansh Labs). Solid black lines are the regression curve with the 95% CI in grey relative to a slope of 1 (dotted black lines). (A-C) Regression curves for the subgroup with AMH levels <2.80 ng/mL. (D-F) Regression curves for the subgroup with AMH levels between 2.80 and 7.04 ng/mL. (G-I) Regression curves for the subgroup with AMH levels >7.04 ng/mL. AMH, anti-Müllerian hormone; ELISA, enzyme-linked immunosorbent assay.
Correlation AMH Levels and Follicle Count
As AMH levels strongly correlate with follicle number, we also investigated whether the correlation of serum AMH with follicle count was similar across the 3 different assays and whether these correlations were consistent across the serum AMH level subgroups. There was a strong positive correlation present between AMH levels and follicle count with correlation values ranging from 0.57 to 0.62 (P < .001) (Fig. 3). However, subgroup analysis based on AMH levels showed that independent of the assay method used, the correlation coefficients decreased from moderate to low values (0.12-0.45). (Fig. 4A-4I and Table 2). While analyzing the data for the presence of PCOM, we observed that in the total cohort only 50 women (3%) did not have the PCOM phenotype. Comparing the percentage of absence of PCOM across the 3 subgroups showed that the majority was present in the low AMH level subgroup (18.9%, 21.4% and 14.6% for the Elecsys AMH plus, picoAMH and Gen II AMH assays respectively). In the mid AMH subgroup, the percentage of women without PCOM was respectively 1.71%, 3.55%, and 3.55%. In the high AMH level subgroup, the percentage without PCOM was below 1%, independent of the assay method used (Fig. 4A-4I). All correlations had P < .001, except for the correlation between the picoAMH assay and TFC in the low AMH subgroup (P =.02, Fig. 4C and Table 2)
Spearman coefficients of the correlation between assay-specific AMH measurement and follicle count
| N | Total (ρ) | N, % | <2.8 ng/mL (ρ) | N, % | 2.8-7.04 ng/mL (ρ) | N, % | >7.04 ng/mL (ρ) | |
|---|---|---|---|---|---|---|---|---|
| Elecsys plus | 1660 | 0.62 | 208, 13% | 0.35 | 857, 52% | 0.30 | 595, 36% | 0.38 |
| picoAMH | 1660 | 0.61 | 112, 7% | 0.12a | 535, 32% | 0.18 | 1013, 61% | 0.45 |
| Gen II AMH | 1660 | 0.57 | 158, 10% | 0.33 | 563, 34% | 0.20 | 939, 57% | 0.37 |
AMH levels measured by the Elecsys AMH plus assay (Roche), Gen II ELISA assay (Beckman Coulter), and picoAMH assay (Ansh Labs). Correlation values are presented as Spearman’s rho for the total cohort and for the 3 subgroups stratified by the AMH value indicated.
Abbreviation: AMH, anti-Müllerian hormone.
aindicates a non-significant p-value of 0.21.
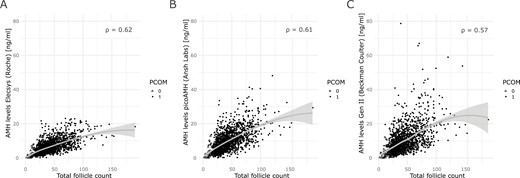
Regression curves of the correlation between assay-specific AMH measurements and follicle count. Solid grey lines represent the regression curve with the 95% CI. Every dot represents a patient. Patients without PCOM are indicated with open triangles. Patients with PCOM are indicated with solid circles. (A) Correlation between AMH levels measured by the Elecsys AMH plus assay (Roche) and total follicle count. (B) Correlation between AMH levels measured by the Gen II AMH ELISA (Beckman Coulter) with total follicle count. (C) Correlation between AMH levels measured by the picoAMH assay (Ansh Labs) with total follicle count. All correlations had P < .001. AMH, anti-Müllerian hormone; PCOM, polycystic ovary morphology.

Regression curves of the correlation between assay-specific AMH measurements and follicle count across AMH subgroups. Solid grey lines represent the regression curve with the 95% CI. Every dot represents a patient. Patients without PCOM are indicated with open triangles. Patients with PCOM are indicated with solid circles. AMH levels were measured by the Elecsys AMH plus assay (Roche), the Gen II AMH ELISA (Beckman Coulter) and the picoAMH (Ansh Labs). (A-C) Regression curves for AMH levels <2.80 ng/mL. (D-F) Regression curves for AMH levels between 2.80 and 7.04 ng/mL. (G-I) Regression curves for AMH levels >7.04 ng/mL. aNonsignificant P value of .21. All other correlations had P < .001. AMH, anti-Müllerian hormone; TFC, total follicle count; PCOM, polycystic ovary morphology.
Correlation AMH Levels and Follicle Count in Age Subgroups
Both serum AMH levels and follicle numbers decrease with increasing age to undetectable levels after menopause. Therefore, we also investigated whether the correlation of serum AMH levels with follicle number was age dependent. Hence, we stratified the patient population into 3 age categories: (1) early reproductive age, <24 years; (2) mid-reproductive age, 25–30 years; and (3) late reproductive age, 31-48 years; and investigated the AMH level–dependent correlation with follicle count in each of these 3 age categories. We observed that the overall correlation between AMH level and follicle count was similar in all 3 age categories, independently of the assay used (0.54-0.64) (Table 3). All correlations had a P < .001.
Spearman coefficients of the correlation between assay-specific AMH measurement and follicle count across different age subgroups
| N | Mean (SD) | Correlation Gen II AMH (Beckman Coulter) | Correlation Elecsys plus (Roche) | Correlation picoAMH (Ansh Labs) | |
|---|---|---|---|---|---|
| ERA (<24 years) | 431 | 21.66 (2.14) | 0.54 | 0.59 | 0.57 |
| MRA (25-30 years) | 750 | 27.49 (1.65) | 0.56 | 0.63 | 0.61 |
| LRA (31-48 years) | 469 | 33.58 (2.63) | 0.56 | 0.62 | 0.64 |
Correlation values are presented as Spearman’s rho for the total cohort. Mean age levels are presented for the 3 age subgroups.
Abbreviations: AMH, anti-Müllerian hormone; ERA, early reproductive age; MRA, mid reproductive age; LRA, late reproductive age.
Discussion
The aim of this study was to perform a comparative analysis of different AMH assays in a large cohort of women with PCOS. We demonstrated that, in general, a strong interassay correlation exists over the total range of AMH levels. However, although the Elecsys AMH plus assay was standardized against the Gen II AMH ELISA (30), our results report lower values measured by the Elecsys AMH plus assay than both the Gen II AMH and the picoAMH assays. This is in line with previously published studies, in which AMH levels measured in respectively 57 female blood donors and 83 women undergoing IVF treatment were compared (30, 31). The reason for the difference in AMH levels between the Elecsys AMH plus assay and both the Gen II AMH and the picoAMH assays is not clear. But differences in assay calibration and/or sample dilution steps have been suggested as a possible explanation (31). Our corresponding Bland–Altman graphs however showed a nonlinear relation between the assays, reflected by larger interassay differences with increasing AMH levels. This was confirmed by separate correlation analyses, in which we observed that the interassay correlation depends on serum AMH level.
Previous studies comparing AMH measurements of different assays have mainly been performed in small cohorts with normo-ovulatory or infertile women (10-15). Although these studies have not yet established a consensus on the interassay correlations, the reported equations do support the hypothesis that the variation in interassay correlation might depend on the serum AMH level (10-15). For instance, the reported equation in the study from Hyldgaard et al (10) resulted in 45% higher AMH levels in the Elecsys AMH plus assay than the Gen II AMH ELISA for an AMH level of 1 ng/mL. However, using the same equation, an AMH level of 5 ng/mL resulted in a 16.6% decrease (7).
In the current study, we show that by comparing the correlation within 3 AMH level subgroups, the interassay correlation was indeed serum AMH level-dependent. These subgroups were based on a systematic review that included 5 different studies describing AMH level cut-off values in a range of 2.80 to 7.04 ng/mL for the diagnosis of PCOM in women with PCOS using previous Beckman Coulter assays (22). In our study, we have compared the modified Gen II AMH ELISA (Beckman Coulter), the Elecsys AMH plus assay (Roche), and the picoAMH assay (Ansh Labs). Only a recent study used the Elecsys AMH plus assay to generate an AMH cut-off value for PCOM (32). In this study, a cut-off value of 3.2 ng/mL was reported based on a comparison between 455 women with PCOS and 500 controls (32). Another recently published study reported a cut-off value of 6.13 ng/mL for PCOM using the picoAMH assay by comparing 31 women with clinical diagnosed PCOS and 77 women with no PCOS characteristics (33). However, since the reported AMH cut-offs strongly depend on the cohort specifications, we decided to study the AMH level–dependent correlation using on the reported broad range in the systematic review (22).
Our results showed that the strongest interassay correlation was present in patients with either low (<2.80 ng/mL) or high (>7.04 ng/mL) AMH levels. In the subgroup of patients with serum AMH levels between 2.80 and 7.04 ng/mL, the interassay correlation dropped. This subgroup of mid AMH levels constitutes 34% to 52% of the total cohort, depending on the assay used. In other words, for nearly 50% of the women in our PCOS cohort, serum AMH levels cannot be accurately converted to an AMH value measured by other AMH assays due to a poor interassay correlation. This once more emphasis the need of standardization of AMH measurements to prevent clinical misinterpretation of serum AMH levels.
This AMH level–dependent correlation has been demonstrated in previously published studies (12, 34). Magnusson et al (12) compared the original Gen II AMH ELISA with the modified Gen II AMH ELISA in a small cohort of 269 infertile women with mean serum AMH values of 3.29 ng/mL and 4.43 ng/mL respectively. The cause of infertility varied within the cohort and was not specified in detail. They demonstrated that the interassay correlation decreased for AMH levels <4.5 ng/mL compared with the correlation over the total range of AMH levels. In contrast to the study of Magnusson et al (12), in our study the best correlation was observed for the lower AMH values (<2.80 ng/mL) and the high AMH values (>7.04 ng/mL). However, it should be noted that in our cohort the mean AMH levels were significantly higher, with concentrations ranging from 6.55 to 9.90 ng/mL. Thus, we compared the interassay correlation across a much higher range of AMH levels. These differences suggest that the interassay correlation is not only dependent on AMH levels, but also on the population studied. These results once more emphasize the need of a standardization of AMH measurement. In addition to an international standard of AMH to harmonize calibration of AMH assays, alternative methods for AMH measurements could be useful, such as liquid chromatography coupled to mass spectrometry techniques, as has been applied for other peptide hormones. However, this method may also pose challenges in predicting the molecular weight of AMH, particularly if multiple AMH isoforms are present in circulation.
In clinical practice, serum AMH levels are receiving increasing interest as a surrogate for PCOM, since AMH levels are a reliable marker for the number of antral follicles present in the ovaries. In this study we confirmed the previous reported positive correlation between serum AMH levels and follicle count, which remained present across the different age groups. However, subgroup analysis showed that also this correlation was AMH level dependent. In contrast to the interassay comparison, all 3 subgroups showed at best a moderate correlation, independent of age and assay method used. The large range in follicle counts compared with a relatively smaller range in serum AMH levels might indicate that there are differences in follicle type that contribute to PCOM within the PCOS population. As follicle size is not precisely measured when transvaginal ultrasounds are performed, a wide range of follicle counts for the same AMH level, might be a reflection of different follicle classes. Another possible explanation might be that the observed discrepancy between follicle number and AMH level is a reflection of the ratio between vital and avital follicles, as this distinction cannot be determined with the current techniques. At last, it is known that patients with PCOS have an overexpression of AMH across the different follicle classes compared with normo-ovulatory women (35). However, there might be subgroups within the PCOS population with altered AMH expression, which could be reflected in AMH level–dependent correlation with follicle count.
Nevertheless, knowledge about the exact number of vital follicles and the AMH expression per follicle may be of great relevance for women with PCOS as these women have an increased risk of developing ovarian hyperstimulation syndrome (OHSS) (36). Indeed, a recent study investigating the risk of developing OHSS in 4351 women with PCOS, demonstrated that both AMH and follicle count on the day of human chorionic gonadotropin injection, are independent risk factors for the development of OHSS (OR 1.25 and OR 1.13, respectively) (37). Recently, a paper from Dapas et al (38) identified a metabolic and reproductive PCOS cluster, based on unsupervised clustering analysis, in a cohort of PCOS patients characterized by the NIH criteria. Our results suggest that AMH levels and follicle count may be partially independent phenotypic parameters of PCOS. Therefore, it will be interesting to determine whether a cluster analysis that includes serum AMH concentration and/or follicle count may lead to better subphenotyping of PCOS patients.
The question arises whether the AMH level–dependent correlation with follicle count is clinically relevant. The reported cut-off values for diagnosing PCOM ranged from 2.80 to 7.04 ng/mL (22, 32, 33). Our results showed that independent of the assay used, the majority of women without PCOM were present in the low AMH subgroup. Thus, although AMH levels may not accurately reflect the number of follicles present in ovaries of women with PCOS, increased levels (>2.80 ng/mL in this study) are in strong agreement with a PCOM diagnosis. However, it should be noted that the majority of the patients in our cohort were diagnosed with PCOM. Because our study was not designed to predict PCOM, calculating the accuracy of each AMH assay to predict the presence of PCOM was not possible. This is an important limitation of our study. In addition, the current PCOM cut-off value has changed due to improved sensitivity of the ultrasound equipment; however, both the old and the new PCOM cut-off are still used, depending on the sensitivity of the equipment present in the clinic (39). Moreover, while our results show that a reliable correlation between AMH levels and follicle number was low to moderate in the lower range AMH levels, it should be stressed that these findings were observed in women with PCOS. Caution is therefore needed when extrapolating these findings to normo-ovulatory women, for whom AMH values may be used to monitor ovarian reserve or to predict ovarian response to stimulation during IVF treatment.
In conclusion, we have shown that both the interassay correlation and the correlation between AMH level and follicle count both depend on serum AMH concentration in a cohort of PCOS patients. While a high AMH level may reflect the presence of PCOM, our results suggest that it does not accurately reflect the total number of follicles in PCOS. Furthermore, our study emphasizes the need of a standardization of AMH measurement for an accurate interpretation of AMH values in clinical practice.
Abbreviations
- AMH
anti-Müllerian hormone
- ELISA
enzyme-linked immunosorbent assay
- IVF
in vitro fertilization
- OHSS
ovarian hyperstimulation syndrome
- PCOM
polycystic ovary morphology
- PCOS
polycystic ovary syndrome
Funding
None.
Disclosures
J.S.E.L. has received consultancy fees from the following companies: Ferring, Roche Diagnostics, and Ansh Labs and has received travel reimbursement from Ferring. J.A.V. has received royalties from AMH assays, paid to the institute/lab with no personal financial gain.
Data Availability
Restrictions apply to the availability of some or all data generated or analyzed during this study to preserve patient confidentiality or because they were used under license. The corresponding author will on request detail the restrictions and any conditions under which access to some data may be provided.
