


Abstract
Many different inherited and acquired conditions can result in premature bone fragility/low bone mass disorders (LBMDs).
We aimed to elucidate the impact of genetic testing on differential diagnosis of adult LBMDs and at defining clinical criteria for predicting monogenic forms.
Four clinical centers broadly recruited a cohort of 394 unrelated adult women before menopause and men younger than 55 years with a bone mineral density (BMD) Z-score < -2.0 and/or pathological fractures. After exclusion of secondary causes or unequivocal clinical/biochemical hallmarks of monogenic LBMDs, all participants were genotyped by targeted next-generation sequencing.
In total, 20.8% of the participants carried rare disease-causing variants (DCVs) in genes known to cause osteogenesis imperfecta (COL1A1, COL1A2), hypophosphatasia (ALPL), and early-onset osteoporosis (LRP5, PLS3, and WNT1). In addition, we identified rare DCVs in ENPP1, LMNA, NOTCH2, and ZNF469. Three individuals had autosomal recessive, 75 autosomal dominant, and 4 X-linked disorders. A total of 9.7% of the participants harbored variants of unknown significance. A regression analysis revealed that the likelihood of detecting a DCV correlated with a positive family history of osteoporosis, peripheral fractures (> 2), and a high normal body mass index (BMI). In contrast, mutation frequencies did not correlate with age, prevalent vertebral fractures, BMD, or biochemical parameters. In individuals without monogenic disease-causing rare variants, common variants predisposing for low BMD (eg, in LRP5) were overrepresented.
The overlapping spectra of monogenic adult LBMD can be easily disentangled by genetic testing and the proposed clinical criteria can help to maximize the diagnostic yield.
Genetic testing is increasingly integrated into the diagnostic workup of all medical disciplines because of the availability of efficient genetic screening methods based on next-generation sequencing. Such analyses allow for further disease classification, the identification of rare monogenic diseases, and thereby individualized treatment. However, discipline-specific criteria for the identification of individuals with rare monogenic disorders are needed to maximize the diagnostic yield of genetic testing. Especially challenging is the recognition of mildly affected individuals with a disease onset in adulthood lacking the classical clinical signs of the corresponding early-onset rare disorder (1).
In clinical routine, rare low bone mass disorders (LBMDs) in adults are primarily diagnosed by dual energy X-ray absorptiometry (DXA) and often subsumed under the umbrella term of osteoporosis, although this term in principle denotes low bone mass and impaired microarchitecture. But a plethora of different pathologies, also including mineralization disorders, can cause metrological “low bone mass.” In addition, after secondary forms of LBMD have been ruled out, it can be difficult to distinguish acquired and inherited forms.
Severe rare monogenic LBMDs with congenital or infantile onset and common age-related (postmenopausal or senile) osteoporosis with multifactorial pathogenesis can be regarded as a continuum of clinical phenotypes with many genetic and pathogenetic overlaps (2, 3). This principle is illustrated by the different forms of bone fragility caused by mutations in WNT1 or LRP5. Biallelic recessive mutations in WNT1 and LRP5 cause severe congenital bone fragility that presents as osteogenesis imperfecta with variable extraskeletal manifestations (4-7). However, monoallelic dominant mutations in WNT1 and LRP5 cause a nonsyndromic LBMD, often with adult onset, which lies between congenital monogenic LBMD and age-related osteoporosis (8-12). Such late-onset monogenic LBMDs are difficult to diagnose clinically within this heterogeneous patient group, and it is currently unclear when and which type of genetic testing should be applied (13).
Genome-wide association studies have identified more than 500 genetic loci harboring common genetic variants influencing bone mineral density (BMD), a major risk factor for age-related osteoporosis, and lifetime fracture risk (14). BMD shows a heritability of 50% to 85% and common genetic variants explain about 25% of the BMD variance (14, 15). Also, common polymorphisms in the LRP5, LRP6, and WNT1 gene loci predispose to low BMD (16). Genetic risk scores (GRSs, also called polygenic risk scores) based on such predisposing polymorphisms have been developed for many common conditions and are ready to be integrated into clinical routine (17). In the osteoporosis field, it was shown that a comprehensive GRS outperformed common clinical and radiological scoring methods in the prediction of osteoporotic fracture risk (15). In addition, testing for monogenic LBMD was suggested in cases with severe osteoporosis with early onset in spite of a disparately low GRS (18). Adult LBMDs affect men and women alike and their management is a challenge because of the lack of guidelines and approved drugs. Early diagnosis and possibilities for treatment stratification are therefore needed.
In this study, we wanted to evaluate to what extent premature low bone mass and fragility, after exclusion of secondary forms, have an underlying monogenic cause. Second, we aimed at identifying clinical criteria predicting monogenic forms of adult LBMD. Third, we wanted to investigate the contribution of common genetic variants to the pathogenesis of premature low bone mass in participants without monogenic cause. To this end, we performed genetic analysis of a cohort of 394 affected individuals.
Materials and Methods
Study Population
All participants recruited within this prospective observational study were adult outpatients seen in the 4 participating clinical centers in Germany (Berlin, Dresden, Hamburg, and Würzburg) between 2016 and 2018. Inclusion criteria were: DXA Z-score < -2.0 and/or clinical evidence for bone fragility such as history of low-energy/osteoporotic fractures assessed by patient history and available medical records. Family history of osteoporosis (ie, known osteoporosis, hip fractures, or other major low energy fractures in first-degree relatives) was recorded as part of the comprehensive medical history. The onset of the phenotype had to be premenopausal in women and before the age of 55 years in men. Participants suffering from conditions known to cause secondary osteoporosis such as multiple myeloma, systemic mastocytosis, systemic steroid therapy (≥ 7.5 mg per day for > 3 months), malabsorption and malassimilation, eating disorders, alcoholism, endocrine diseases such as thyrotoxicosis or primary hyperparathyroidism, chronic inflammatory bowel diseases, as well as chronic liver and kidney diseases were excluded. The diagnostic workup was performed according to current guidelines and included the assessment of BMD by DXA scan at the lumbar spine and hip. Blood samples were taken for biochemical analyses of serum concentrations of calcium, phosphate, creatinine, 25-hydroxycholecalciferol, parathyroid hormone (PTH), alkaline phosphatase, bone-specific alkaline phosphatase, and osteocalcin. Urine samples were taken for analyses of deoxypyridinoline/creatinine. In addition, grip strength was performed as part of a neuromuscular assessment. All recruited participants gave written informed consent, and the study was approved by the ethics committee (EA04/060/16) of Charité-Universitätsmedizin Berlin.
Genotyping
Genomic DNA was isolated from EDTA blood samples, fragmented by an ultrasound device (Covaris, Woburn, MA, USA), and used for library preparation. For enrichment of target sequences, different versions of a custom design Sure Select XT (Agilent, Santa Clara, CA, USA) gene panel (skeletal disease associated genome) containing selected noncoding regions containing single nucleotide polymorphisms (SNPs; in total 20 SNPs) associated with BMD and the core genes for relevant disorders with low and high BMD were used as described before (8). Additionally, in 10 individuals, all coding exons were enriched (Human all exon V6, Agilent, Santa Clara, CA, USA). Sequencing was performed on MiSeq, NextSeq, and HiSeq machines (Illumina, San Diego, CA, USA) with a coverage of > 100X leading to > 20X coverage of > 98% of the target region.
Bioinformatics and Evaluation of Gene Panel Data
After mapping (BWA-MEM algorithm) and variant calling (GATK package), data were analyzed by the software MutationDistiller in a phenotype-driven manner (19). The software Sequence Pilot (JSI Medical Systems, Ettenheim, Germany) was used for unbiased variant prioritization. Global copy number analysis was performed using the software clearCNV (manuscript under review). The pathogenicity of the prioritized variants was judged using MutationTaster version 2 and the freely accessible version of Varsome (20, 21). Variants were compared with databases (ExAC, GnomAD, and HGMD professional, Qiagen, Hilden, Germany). Variant classification followed the American College of Medical Genetics (ACMG) recommendations (22).
Further Statistical Analysis of Sequence Variants
Samples with less than 85% of 20× coverage over the panel target region or with many off-target reads were removed. Because multiple panel enrichments were used, the intersection of all target enrichments (extended + 20 bp) was used when data were jointly analyzed. Two control cohorts were selected for comparison: variants from 503 individuals of European origin from the 1000 Genomes Project (cohort 1KG EUR; controls) and 59 individuals from an in-house high-BMD cohort, sequenced with the same gene panels (cohort high BMD) (23). To exclude outliers, principal component analysis of all 3 cohorts together was performed on variants located in the final target region using the python package “allele.” Linkage disequilibrium pruning was performed with a window size of 200 bp and 20 variants to advance to the next window. Finally, outliers were identified from the first 4 components and were removed in downstream analysis.
Rank Sum Test of Rare Variants According to Combined Annotation Dependent Depletion Scores
Enrichments of potential deleterious variants in genes known to be associated with low BMD (Supplement Table S1) (24) were computed using the raw Combined Annotation Dependent Depletion (CADD) score (25). Here, the enrichment of CADD scores of LBMD individuals compared with other cohorts was tested using the rank-sum test. Variants were annotated with Jannovar v0.34 using the RefSeq database, as well as CADD v1.4 scores and gnomAD exome v2.0.1 allele frequencies. Variants were classified into different groups defined by Jannovar’s variant effect classes and allele frequency of gnomAD nonFinnish Europeans (NFE). The following groups were used: all variants, rare variants (NFE < 0.01), moderate (missense, inframe indel), and high (stop gain/lost, in-frame indel, splice donor/acceptor) effect variants; rare moderate and high effect variants (NFE < 0.01); and ultrarare moderate and high effect variants (not in gnomAD). Genes involved only in high BMD were used as a negative control set. For multiple test correction, the Benjamini-Hochberg (false discovery rate) method was used.
Individual Common Variant Frequency Difference and Genetic Risk Score Calculation
Genetic risk scores per sample were calculated using SNPs associated with BMD in Europeans and located in the high-coverage target regions from the genome-wide association studies catalog (download date November 20, 2019; see Supplement Table S2) (24, 26). For each sample, the beta values (negative beta values have BMD-lowering and positive beta values BMD-increasing effects) of the hits were summarized for each effect allele present in a sample. Homozygous variants were counted twice. Negative beta values account for low BMD and positive beta values account for high BMD. For comparison between LBMD with and without disease-causing variants (DCVs) and the 2 control cohorts, mean SNP effects on BMD were computed and normalized to the 1KG EUR controls. Receiver operating characteristic (ROC) plots were generated to analyze the separation between cohorts. GRS of the different cohorts were compared using 1-way ANOVA. For evaluation of frequencies of individual SNPs in the different cohorts, we used the Fisher exact test.
Statistical Analysis of Phenotype-genotype Correlation
Baseline characteristics are summarized as the number of participants (%) for categorical variables and as the mean (SD) and/or median (range) for continuous variables. Groups were compared using χ 2 tests and Student t tests, respectively. Univariate associations between continuous variables and the presence of a class 4 or 5 variant were investigated using logistic regression models. A classification and regression tree analysis was performed to detect cutoffs of predictive variables. All analyses were performed using R 3.6.1 (R Core Team, Vienna, Austria).
Results
Rare Disease-causing Variants Are a Frequent Finding in Adult LBMDs
A total of 394 unrelated adult index participants that fulfilled the inclusion criteria (DXA Z-score < -2.0 and/or clinical evidence for bone fragility, premenopausal disease onset in women and disease onset at < 55 years in men, no underlying condition known to cause secondary osteoporosis) were recruited in 4 clinical centers (Table 1). Participants’ average age at analysis was 48.1 ± 11.8 years; 45.4% were women and 54.6% were men. Three hundred and fifteen (80%) of these had experienced 1 or multiple fractures at the time of diagnosis. A positive family history of osteoporosis was evident in 124 (31.5%) participants. We performed targeted sequencing using a custom gene panel and additional exome sequencing in 10 individuals with negative gene panel results and a clinical phenotype and/or family history strongly suggesting a monogenic disease. Genotyping revealed 85 DCVs (ACMG variant class IV or V) in 82 (20.8%) individuals (Table 2, Supplement Table S3) (24). Variants of unknown significance (VUSs) (ACMG class III) were present in 28 (7%) participants (Table 2, Supplement Table S4) (24). Thus, we identified bona fide DCV in about 1 of 5 of all participants with broadly defined premature low bone mass and bone fragility.
Baseline characteristics of the low bone mass disorder study population subdivided according to DCV status
| No DCV (n = 312) | DCV (n = 82) | Total (n = 394) | P | |
|---|---|---|---|---|
| Age,a y | 0.739 | |||
| Mean (SD) | 48.2 (11.4) | 47.7 (13.2) | 48.1 (11.8) | |
| Sex | 0.574 | |||
| Male | 168 (53.8%) | 47 (57.3%) | 215 (54.6%) | |
| Female | 144 (46.2%) | 35 (42.7%) | 179 (45.4%) | |
| Family history | <0.001 | |||
| Positive | 85 (27.2%) | 39 (47.6%) | 124 (31.5%) | |
| Vertebral fractures, n | 0.870 | |||
| Mean (SD) | 1.3 (2.4) | 1.3 (2.6) | 1.3 (2.5) | |
| Peripheral fractures, n | <0.001 | |||
| Mean (SD) | 1.8 (3.0) | 5.7 (10.8) | 2.6 (5.8) | |
| BMI, kg/m2 | 0.033 | |||
| n | 306 | 79 | 385 | |
| Mean, SD | 23.6 (4.2) | 24.8 (4.9) | 23.9 (4.3) | |
| Weight, kg (SD) | 70.01 (15.35) | 71.49 (15.88) | 70.34 (15.46) | 0.461 |
| Height, m (SD) | 171.8 (10.7) | 169.6 (12.0) | 171.3 (11.0) | 0.111 |
| Z-score (hip) | 0.369 | |||
| n | 304 | 78 | 382 | |
| Mean (SD) | -2.3 (1.0) | -2.4 (1.1) | -2.3 (1.0) | |
| Z-score group (hip) | 0.460 | |||
| < -2.5 | 128 (42.1) | 34 (43.6%) | 162 (42.4%) | |
| -2.5 to -1.0 | 152 (50.0%) | 41 (52.6%) | 193 (50.5%) | |
| > -1 | 24 (7.9%) | 3 (3.8%) | 27 (7.1%) | |
| Z-score (spine) | 0.842 | |||
| n | 301 | 81 | 382 | |
| mean (SD) | -2.9 (1.1) | -2.9 (1.4) | -2.9 (1.1) | |
| Z-score group (spine) | 0.418 | |||
| < -2.5 | 206 (68.4%) | 59 (72.8%) | 265 (69.4%) | |
| -2.5 to -1.0 | 79 (26.2%) | 16 (19.8%) | 95 (24.9%) | |
| > -1 | 16 (5.3%) | 6 (7.4%) | 22 (5.8%) |
Abbreviations: BMI, body mass index; DCV, disease-causing variant (American College of Medical Genetics class IV and V).
aAge at analysis.
Frequencies and classification of rare variants and affected genes identified in LBMD study population
| Pathway | Gene name | LBMD (n = 394) | |
|---|---|---|---|
| DCV | VUS | ||
| ECM | BMP1 | 1 | |
| COL1A1 | 22 | 4 | |
| COL1A2 | 12 | 4 | |
| EXT2a | 1 | ||
| PLOD1 | 1 | ||
| Mineralization | ALPL | 8 | |
| ENPP1 | 2 | 2 | |
| CASRa | 1 | 1 | |
| SLC34A1 | 2 | ||
| SLC34A3a | 3 | ||
| Wnt | DVL1a | 1 | |
| LRP5 | 17 | 1 | |
| LRP6 | 3 | ||
| WNT1 | 9 | ||
| TGF-β | FBN1 | 3 | |
| FBN2 | 3 | ||
| TGFBR2 | 1 | ||
| Other | LMNAa | 1 | 1 |
| NOTCH2 | 1 | ||
| PLS3 | 4 | ||
| ZNF469 | 1 | ||
| Total | 82 | 28 | |
| 20.8% | 7.0% | ||
Abbreviations: DCV, disease-causing variant (American College of Medical Genetics class IV and V); ECM, extracellular matrix; LBMD, low bone mass disorder; TGF-β, genes involved in TGF-β signaling.
aNo currently known LBMD gene, but involvement in skeletal development/homeostasis.
Clinical Hallmarks of Individuals With Monogenic LBMDs
Because of our broad recruitment criteria, our cohort comprised a large spectrum of adult LBMDs. This permitted a statistical search for criteria for late-onset monogenic LBMDs that are of use in a clinical real-life setting. A comparison of individuals with and without DCVs revealed significantly more peripheral fractures (5.7 ± 10.8 vs 1.8 ± 3; P < 0.001), a higher frequency of a family history for osteoporosis (47.9% vs 27.2%; P < 0.001), and a higher body mass index ([BMI] 24.8 ± 4.9 vs 23.6 ± 4.2 kg/m2; P = 0.033) in presence of a DCV (Table 1). However, no significant differences regarding height and weight were detected between groups (171.8 ± 10.7 cm vs 169.6 ± 12.0 cm, P = 0.111; 70.01 ± 15.35 kg vs 71.49 ± 15.88 kg, P = 0.461, respectively). Statistical analyses of biochemical parameters revealed slightly increased serum calcium levels in mutation carriers (2.33 ± 0.17 vs 2.28 + 0.15 mM; P = 0.025)(Supplement Table S5) (24) and significantly reduced maximal grip strength in 82 tested individuals (30.2 ± 10.2 N vs 36.2 ± 12.5 N; P = 0.024)(Supplement Figure S1) (24). No significant differences were apparent for age, sex, vertebral fractures, or DXA Z-score at the lumbar spine and hip (Table 1 and Supplement Figure S1) (24).
We next performed a regression tree analysis to determine the clinical criteria to predict monogenic forms of LBMD. A solid threshold was seen for the first group with more than 10 peripheral fractures (P < 0.001). A total of 76.9% (10/13) of these participants carried a mutation (Fig. 1). The majority of these severely affected individuals harbored loss-of-function mutations in COL1A1, which is typical for osteogenesis imperfecta (OI) type 1, but did not show other characteristic signs of this disease such as short stature, dentinogenesis imperfecta, and/or blue sclerae. The second group comprised individuals with 10 or fewer peripheral fractures with a positive family history for LBMD, of which 29% (34/117) showed a DCV (P < 0.01), whereas in a third group with a negative family history for LBMD and 3 to 10 fractures, DCVs had a frequency of 23.7% (18/76, P = 0.006) (Fig. 1). Interestingly, additional subgroups were defined by BMI. In those with a positive family history, mutation frequency was significantly higher when BMI was > 23.5 kg/m2 (P = 0.025), whereas the threshold was 26.9 kg/m2 in those with negative family history (P = 0.02). Only 10.6% (20/188) of individuals of the fourth group with 2 or less peripheral fractures carried a mutation. Thus, the number of peripheral fractures, a positive family history for LBMD, and a higher BMI are highly predictive for monogenic forms of LBMDs. Nevertheless, except for a high preponderance of type 1 collagen-associated bone diseases among participants with > 10 fractures, it was not possible to clinically distinguish the different genetically defined subforms.
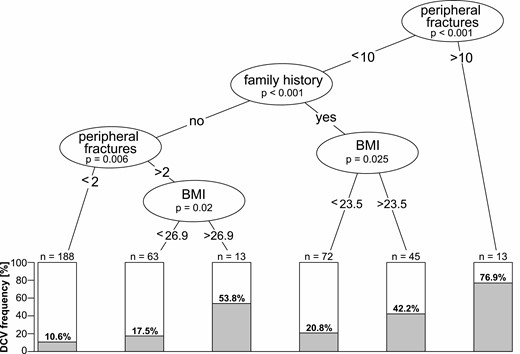
Statistical analysis of clinical thresholds predicting monogenic forms of adult LBMDs. Regression tree analysis of the performed classification showing clinical thresholds determining DCV frequency, starting from the entire cohort of n = 394. Clinical criteria and P values are shown in circles; boxes show percentages and total numbers of LBMD individuals with a DCV falling under the respective criteria. Thresholds are peripheral fractures > 10, family history for fractures/osteoporosis, peripheral fractures > 2. Further subdivision followed according to BMI. BMI, body mass index; DCV, disease-causing variant; LBMD, adult low bone mass disorder.
A Broad Spectrum of Genes Is Involved in Monogenic LBMDs
Of the 85 DCVs identified in 82 participants, 53 (62%) had been described before and 32 were novel (Supplement Table S3) (24). Seventy-five (88%) were heterozygous, 6 (7.1%) were compound heterozygous, and another 4 (4.7%) were hemizygous. Fifty-one (60%) DCVs were missense variants or in-frame deletions, 8 (9.4%) primarily affected splicing, 25 (29%) were either nonsense or frameshift variants, and 1 variant was a larger deletion. In 23 cases, segregation analysis was performed, showing a de novo status in 2 (8.6%), whereas 21 (91.4%) were inherited from an affected parent.
Among the 13 most severely affected participants with more than 10 peripheral fractures, DCVs in the genes encoding type I collagen (COL1A1 and COL1A2) predominated (Table 3, Supplement Table S3) (24). Besides monoallelic DCVs in LRP5 and WNT1, the only individual with biallelic variants in WNT1 was found in this group. In the second group with 10 or less peripheral fractures and positive family history (n = 117), DCVs in COL1A1 or COL1A2 were again most frequent, followed by LRP5, WNT1, ALPL, and 3 hemi- and heterozygous PLS3 variants. In addition, DCVs in CASR, ENPP1, EXT2, SCL34A3, and ZNF469 were detected. Also, in the third group with negative family history and 3 to 10 peripheral fractures (n = 76), DCVs in COL1A1 or COL1A2 were most frequent whereas LRP5 mutations were the second most common cause. An ALPL-associated case was compound heterozygous. In the fourth group with 2 or less peripheral fractures and negative family history (n = 188), LRP5 variants were most frequent, followed by monoallelic ALPL variants. The participants with Hajdu-Cheney syndrome caused by a NOTCH2 variant and with an LMNA-associated skeletal and cardiac disorder also belonged to this group. The genes CASR, EXT2, LMNA, and SLC34A3 are currently not known as LBMD disease genes but are involved in pathways broadly influencing skeletal development and homeostasis.
Frequencies of disease-causing variants in the clinically defined subgroups
| Gene name | Group 1 | Group 2 | Group 3 | Group 4 |
|---|---|---|---|---|
| >10 PF | 0-10 PF FH+ | 3-10 PF FH- | 0-2 PF FH- | |
| ALPL | 2.6% | 1.3% | 2.1% | |
| CASR | 0.9% | |||
| COL1A1 | 38.5% | 6.0% | 11.8% | 1.1% |
| COL1A2 | 15.4% | 4.3% | 3.9% | 1.1% |
| ENPP1 | 0.9% | 0.5% | ||
| EXT2 | 0.9% | |||
| LMNA | 0.5% | |||
| LRP5 | 7.7% | 6.0% | 3.9% | 3.2% |
| NOTCH2 | 0.5% | |||
| PLS3 | 2.6% | 1.3% | ||
| SLC34A3 | 0.9% | 0.5% | ||
| WNT1 | 15.4% | 3.4% | 1.3% | 1.1% |
| ZNF469 | 0.9% | |||
| total | 76.9% | 29.1% | 23.7% | 10.6% |
Abbreviations: FH, family history; PF, peripheral fracture.
In addition to typical LBMD genes (ALPL, COL1A1, COL1A2, LRP5), VUS were found in several genes associated with connective tissue disorders (FBN1, FBN2, TGFBR1) and Wnt pathway-associated genes (DVL1, LRP6) (Supplement Table S4) (24). Similar to LRP5, LRP6 has been implicated in BMD regulation (27). The only monogenic LBMD solved by additional exome sequencing was a brittle cornea syndrome caused by compound heterozygous DCVs in ZNF469 (28). This gene was not contained in the first gene panel design. The only larger deletion detected in the cohort was (c.1309+198_1548del) in the gene ALPL encoding alkaline phosphatase.
To achieve a complementary and unbiased prioritization, variants in low BMD disease genes were automatically classified using the CADD score. CADD is a single score for the prediction of variant pathogenicity integrating conservation and a broad array of functional scores (25). However, in contrast to ACMG criteria for classifying rare variants, it does neither consider phenotypic aspects nor familiar inheritance (22). An enrichment of pathogenic variants with high CADD score in our premature LBMD cohort was computed in comparison to 503 European control datasets derived from the 1000 Genomes Project (1KG EUR; controls). The enrichment increased with decreasing variant frequency, which is in line with the general notion that variant frequency is inversely correlated to variant impact (Supplement Table S6) (24). After removing the 82 individuals with monogenic LBMD from the analysis, only a few ultrarare variants with high CADD score remained, which correspond to the 28 VUS, of which 13 are not listed in the gnomAD database. The specificity of the analysis was confirmed by observing no enrichments for variants in genes associated with high BMD disorders (Supplement Table S7) (24). We therefore conclude that our mutation identification was comprehensive.
The Role of Common Variants in the Pathogenesis of Adult LBMDs in Individuals Without Monogenic Causes
We wanted to further investigate the genetic contribution to the LBMD pathogenesis in the 312 participants without a detected DCV. We speculated that common variants predisposing for low BMD and/or fracture rate might be enriched in this cohort. For proof of concept, 20 SNPs were used to calculate a basic GRS and predicted its effect on BMD relative to healthy controls (Supplement Table S2) (24, 29, 30). Although LBMD individuals without a DCV had a significantly lower predicted BMD (0.90 ± 0.46 vs 1KG EUR P = 0.014; vs high BMD P = 0.001), LBMD individuals with a DCV (1.00 ± 0.49) and the control cohort (mean 1.00 ± 0.45) had identical values. The predicted BMD for the high BMD cohort was highest (1.15 ± 0.40) (Fig. 2A). Accordingly, the ROC curves showed a weak distinction from random for the comparison of the GRS of LBMD individuals without DCV vs the 1KG EUR control cohort and the high BMD cohort, respectively (area under the ROC; LBMD no DCV vs 1KG EUR: 0.55, LBMD no DCV vs high BMD: 0.64) (Fig. 2B). In addition, the LRP5 coding SNP rs4988321 (c.1999G > A) with a proven BMD-lowering effect was significantly overrepresented in the LBMD no DCV cohort (7.3% vs 4.1%; P = 0.007) (Fig. 2C) (16). These results demonstrate that common variants associated with low BMD contributed to the pathogenesis in LBMD individuals without a DCV, underlining the importance of the genetic background and proving that premature LBMD are a mixture of monogenic and complex diseases.
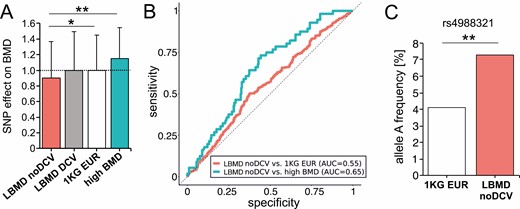
Role of common BMD-associated and rare deleterious variants in LBMD individuals without monogenic DCV. (A) Comparison of BMD predicted by a GRS relative to healthy controls between LBMD without DCV (LBMD noDCV: 312), the LBMD with DCV (LBMD DCV: n = 82), the 1KG EUR control cohort (1KG EUR: n = 503), and individuals with high BMD (high BMD: n = 56). (B) ROC curves of GRSs of common variants associated with BMD. The GRS of individuals with LBMD without DCV (LBMD noDCV) was compared with 1KG EUR (red) and high BMD (blue). An AUC of 0.5 (dashed line) shows a random partitioning. Full partitioning using GRS would be achieved at an AUC of 1.0. (C) The frequency of one of the strongest BMD-influencing common variants, SNP rs4988321, in LRP5 is significantly increased in LBMD noDCV compared with controls (*P < 0.05, **P < 0.01). 1KG EUR, 1000 Genomes Project; AUC, area under the curve; BMD, bone mineral density; DCV, disease-causing variant; GRS, genetic risk score; LBMD, low bone mass disorder; ROC, receiving operating characteristic.
Discussion
Our prospective multicenter study aimed at establishing the frequency of monogenic LBMDs among participants with a premature low bone mass and bone fragility. In addition, we investigated the cohort for specific clinical criteria that might predict the presence of a monogenic LBMD. Overall, we detected variants causing monogenic bone disease in more than 20% of individuals. In the specific group of participants with 0 to 10 peripheral fractures and a positive family history, DCVs were even present in 29%. So far, the genetics of unspecific LBMD and/or bone fragility have been mainly investigated in pediatric cohorts (31, 32). In one of the few studies explicitly focusing on a smaller cohort of adult primary osteoporosis, a DCV frequency of 21% was described, which is similar to our cohort (11). However, whereas in our cohort DCVs in the genes COL1A1 and COL1A2 were more frequent (8.6%) than in LRP5 and WNT1 (6.6%), these authors detected most variants in LRP5 and WNT1 (16%) and far less in COL1A2 (3.3%). This possibly mirrors differences in recruitment as well as differences in clinical routine with respect to genetic testing. Our cohort was recruited within a real-life setting by physicians that were not rare disease specialists or human geneticists. The recruitment strategy was explicitly broad, covering the whole spectrum of mild and severe cases not showing the classical syndromic presentation of monogenic LBMD, after exclusion of secondary forms of osteoporosis. We are thus confident that our conclusions are of general relevance for many clinical disciplines confronted with these individuals. Interestingly, also for other musculoskeletal phenotypes screening of heterogeneous cohorts resulted in mutation detection rates around 20% (33, 34).
Previous results obtained in smaller cohorts demonstrated the difficulties of predicting monogenic LBMDs on clinical grounds (11, 13). However, our larger cohort described here allows us to determine clinical criteria because of higher statistical power. The evaluation of the clinical data showed that the likelihood of detecting a mutation was neither influenced by BMD assessed by DXA nor by vertebral fracture frequency. In contrast, our results underline the importance of the clinical feature “peripheral fracture” from a diagnostic point of view because the strongest correlations with mutation frequency were found for this basic parameter and not for radiological or biochemical parameters. The second most important predictive parameter was family history for LBMDs/osteoporosis. This underlines the value of investing a few minutes into a family anamnesis and not only into costly radiological and laboratory investigations. The positive correlation of mutation frequency and BMI is in line with the known correlation of BMI and BMD (35). Hence, low BMD and/or fractures in spite of high normal BMI, which physiologically should entail high normal BMD, is an indicator of rare variants lowering BMD in the absence of secondary causes. That the likelihood of detecting a mutation did not increase with lower age of the individuals is congruent with other studies describing that most identified genetic factors influencing BMD do not have an age-dependent effect (36). Genes associated with low BMD/osteoporosis obviously blunt the peak bone mass already at younger ages (37). In addition, grip force was found to be significantly reduced in the group of individuals with monogenic LBMD. Although assessed only in a subcohort, this finding underlines the close interplay of bone and muscle and the relevance of a neuromuscular assessment in the diagnostic workup of osteoporosis patients (38).
The 4 main groups defined by regression analysis comprise a wide disease spectrum. Group 1 (>10 peripheral fractures) mostly contains individuals with oligosymptomatic OI type 1 resulting from type 1 collagen mutations. However, 2 individuals with heterozygous LRP5 and WNT1 mutations are also in this category, underlining the difficulty of distinguishing between dominant early-onset (primary) osteoporosis and OI. Likewise, in the less severe group 2 (<10 peripheral fractures and positive family history) more cases were explained by mutations in LRP5, PLS3, and WNT1 than in COL1A1 and COL1A2. ALPL variants were found in groups 2 to 4, which corroborates the described heterogeneous impact, especially of heterozygous mutations (39). Our comprehensive genotyping approach also revealed mutations in genes beyond the OI/early-onset osteoporosis spectrum (eg, SLC34A3, ENPP1). Although most of the genes harboring heterozygous mutations are known for dominant disorders, ENPP1 and SLC34A3 are associated with recessive disorders (40). However, osteopenia, elevated FGF23 as well as low serum phosphate were found in individuals carrying heterozygous variants in both genes (41). Although we cannot exclude the potential presence of an undetected second variant beyond the coding region of these genes, the positive segregation analysis and the phenotypic differences to the recessive forms of the disorders suggest a mild dominant effect of these mutations. Mutations in CASR influence BMD via the dysregulation of serum calcium levels (42), whereas mutations in EXT2 and LMNA are better known for causing exostoses and myopathies, respectively, but do also cause low BMD, which might contribute to the phenotype of the affected individuals here (43, 44). The exostoses were few and not regarded relevant by the participant.
From the 10 cases without causative variants in the gene panel analysis that were subsequently analyzed by exome sequencing, only 1 could be solved by detection of biallelic variants in ZNF469 (28). Closer clinical investigations of this participant revealed a moderate decrease in corneal thickness in addition to the documented blue sclerae and generalized joint hypermobility, thus demonstrating the value of identifying the exact genetic cause. This low rate of additional mutation detection is in line with a previous study, in which exome sequencing in OI cases not solved by gene panel sequencing failed to identify causative variants (45). Overall, our results show that premature LBMD can be considered a genetic disease in a substantial number of participants for which testing of a broad spectrum of genes is warranted.
We next calculated a GRS based on 20 SNPs associated with BMD. Whereas individuals with a DCV were not different from the control cohort, those without a DCV showed a higher number of common variants predisposing for low BMD. An area under the curve (AUC) of 0.55 in the ROC analysis of our GRS further underlined an involvement of common variants in LBMD and is similar to other GRS with low numbers of SNPs (46). Recent analyses show an AUC of 0.72 if more than 22 000 common SNPs are included (47). The clinical use for such an osteoporosis GRS is the preselection of individuals at high risk for appropriate osteoporosis checkups and prevention of unnecessary examinations in individuals at low risk (15). However, currently, the most comprehensive SNP-based GRS only explains about 25% of the BMD variability. It is likely that its predictive value can be improved by including rare variants; however, their rarity impedes a determination of pathogenic effect sizes by genetic association studies. Therefore, alternative evaluation strategies are warranted. The ACMG criteria for evaluation of rare variants are very useful for monogenic disorders, but the result is a classification, not a score (22). In contrast, the CADD score predicts deleteriousness for all coding and noncoding variants based on evolutionary conservation as well as multiple annotations (25). As a proof of concept, we found in our LBMD cohort an enrichment of variants with high CADD scores in low BMD-disease genes but not in high BMD-disease genes. Although the universal properties of the CADD score are ideal for bridging the worlds of rare and common variants, additional adjustments are required before the CADD score can be integrated into a general GRS for low BMD.
There are several limitations to our study. The cohort consists of individuals from 1 country with mainly a Western European population background, which might not be representative of other populations. Genetic testing was restricted to disease genes with known roles in bone and skeletal biology and the genetic risk score comprised only a limited number of SNPs. Moreover, the availability of genetic testing in the health care systems of other countries varies considerably. In addition, segregation analysis was only possible in 23 individuals with DCVs, and genotype-phenotype analyses were limited by a relatively small sample size. Also, participants with vitamin D deficiency were not excluded per se because vitamin D deficiency is common in Germany, vitamin D levels were equally distributed between groups, and no significant impact on fracture incidence or BMD was seen. Finally, not for all reported fractures radiographs were available and family history of osteoporosis was only assessed by comprehensive anamnesis in most cases.
In summary, a genetic cause for LBMD should be considered after the exclusion of causes for secondary osteoporosis if the onset is premenopausal or before age 55 years. Frequent (>2) peripheral fractures, a positive family history for fractures/osteoporosis, and a high normal BMI are further indicators of a genetic type of osteoporosis. Genetic testing should become part of the routine diagnostic workup in this patient cohort. A genetically proven diagnosis can be crucial because (1) it ends the resource-consuming search for other causes of the disease, (2) it allows for a more precise prognosis, (3) it facilitates early identification of family members at risk, and (4) it may be the basis for a specific precision therapy in the near future. Clearly, such a tailored therapy depends on the availability of drugs specifically influencing the pathway affected by the rare variants.
Abbreviations
- 1KG EUR
individuals of European origin from the 1000 Genomes Project
- ACMG
American College of Medical Genetics
- AUC
area under the curve
- BMD
bone mineral density
- BMI
body mass index
- CADD
Combined Annotation Dependent Depletion
- DCV
disease-causing variant
- DXA
dual energy X-ray absorptiometry
- GRS
genetic risk score
- LBMD
low bone mass disorder
- NFE
nonFinnish Europeans
- OI
osteogenesis imperfecta
- ROC
receiver operating characteristic
- SNP
single-nucleotide polymorphism
- VUS
variant of unknown significance
Acknowledgments
The authors thank all participants and their families for their participation. In memory of Dieter Felsenberg, a good friend, a mentor to many of us, and a giant rock in the blue ocean of international osteology.
Funding
This work was supported by the German Federal Ministry for Education and Research (BMBF) project 01EC1402 “DIMEOs” to F.J., L.H., M.A., S.M., T.S., and U.K.
Author Contributions
F.J., L.H., M.A., S.M., and U. Kornak designed the study. E.T., F.B., F.G., G.B., J.S., L.S., R.O., T.M., and T.R. recruited participants. E.V., J.S., A.D., R.O., M.S., T.S., and U. Kornak analyzed data. U. Krüger and T.Z. organized laboratory work. L.H., M.S., N.E., R.O., S.M., T.S., and U. Kornak interpreted the data. M.S., R.O., S.M., and U. Kornak wrote the manuscript. E.T., F.B., F.G., F.J., J.S., L.H., L.S., R.O., S.M., T.S., T.Z., U. Kornak, and U. Krüger critically reviewed the manuscript.
Disclosures
R.O. has served as a speaker and advisory board member for Kyowa Kirin, Inozyme, and UCB and has received an institutional research grant from Kyowa Kirin and UCB. E.T. has received research funding from MSD; honoraria for lectures from Amgen, UCB, Takeda, and Kyowa Kirin; and educational grants from Takeda and UCB. L.S. has received honoraria for lectures and consultations from Alexion, Amgen, Kyowa Kirin, Lilly, Theramex, and UCB and research funding to his institution from Alexion, Kyowa Kirin, and Novartis. F.G. has received speaker honoraria from Alexion, Lilly, and Abbvie. F.B. has served as a speaker and advisory board member for Alexion and has received a research and educational grant from Alexion. F.J. has served as a speaker and advisory board member for Amgen, Lilly, Alexion, Kyowa Kirin, medi, Gedeon-Richter, Novartis, and Novo Nordisk and has received research grants and support for clinical studies to his institution from Amgen, Lilly, Novartis, Alexion, Media, Novotec, miha bodytech, Servier, and Pfrimmer Nutricia. L.C.H. reports consulting fees from Alexion, Amgen, Kyowa Kirin International, Takeda, and UCB for advisory boards (personal fees), from Samsung for participation on a Data Safety Monitoring Board (personal fees), and from Ascendis, Alexion, and Takeda for clinical trials (to the institution). U. Kornak has received speaker honoraria from Alexion. T.R., G.B., M.S., E.V., J.S., N.E., A.D., U. Krüger, T.Z., T.S., and S.M. declare that they have no conflict of interest.
Data Availability
Restrictions apply to the availability of some or all data generated or analyzed during this study to preserve patient confidentiality or because they were used under license. The corresponding author will, on request, detail the restrictions and any conditions under which access to some data may be provided.
