


Abstract
Cushing disease, a chronic hypercortisolism disorder, is associated with considerable morbidity and mortality. Normalizing cortisol production is the primary treatment goal.
We aimed to evaluate the safety and efficacy of osilodrostat, a potent, orally available 11βhydroxylase inhibitor, compared with placebo in patients with Cushing disease.
LINC 4 was a phase III, multicenter trial comprising an initial 12-week, randomized, double-blind, placebo-controlled (osilodrostat:placebo, 2:1) period followed by a 36-week, open-label treatment period (NCT02697734). Adult patients (aged 18-75 years) with confirmed Cushing disease and mean urinary free cortisol (mUFC) excretion ≥ 1.3 times the upper limit of normal (ULN) were eligible. The primary endpoint was the proportion of randomized patients with mUFC ≤ ULN at week 12. The key secondary endpoint was the proportion achieving mUFC ≤ ULN at week 36 (after 24 weeks’ open-label osilodrostat).
Seventy-three patients (median age, 39 years [range, 19-67]; mean/median mUFC, 3.1 × ULN/2.5 × ULN) received randomized treatment with osilodrostat (n = 48) or placebo (n = 25). At week 12, significantly more osilodrostat (77%) than placebo (8%) patients achieved mUFC ≤ ULN (odds ratio 43.4; 95% CI 7.1, 343.2; P < 0.0001). Response was maintained at week 36, when 81% (95% CI 69.9, 89.1) of all patients achieved mUFC ≤ ULN. The most common adverse events during the placebo-controlled period (osilodrostat vs placebo) were decreased appetite (37.5% vs 16.0%), arthralgia (35.4% vs 8.0%), and nausea (31.3% vs 12.0%).
Osilodrostat rapidly normalized mUFC excretion in most patients with Cushing disease and maintained this effect throughout the study. The safety profile was favorable.
Cushing disease is a rare disorder of hypercortisolism caused by an adrenocorticotropic hormone (ACTH)-secreting pituitary adenoma, which in turn stimulates the adrenal glands to produce excess cortisol (1). Prolonged exposure to elevated cortisol levels is associated with substantial morbidity and mortality and impaired quality of life (QoL) (1-3). Accordingly, normalization of cortisol is the primary treatment goal for Cushing disease (4).
Transsphenoidal surgery is the first-line therapy for most patients. However, up to one-third of patients do not achieve sustained remission after pituitary surgery and require additional treatment (3, 5). Options for these patients include repeat pituitary surgery, medical therapy, radiation therapy, and bilateral adrenalectomy (3, 6). Despite multiple treatment options, many patients do not achieve or maintain normal cortisol excretion (7-9).
Osilodrostat is a potent oral inhibitor of 11β-hydroxylase (CYP11B1). In a phase III study (LINC 3) in patients with Cushing disease, open-label osilodrostat rapidly reduced mean urinary free cortisol (mUFC) excretion over 48 weeks and was superior to placebo at maintaining normal mUFC excretion after an 8-week randomized withdrawal period (10).
Here we report outcomes from the first phase III trial in patients with Cushing disease to include an initial, randomized, double-blind period (12 weeks) to compare the efficacy of osilodrostat against placebo, and a subsequent 36-week, open-label period to evaluate the sustained effect of osilodrostat and long-term safety.
Methods
Study Design and Participants
LINC 4 was a phase III, multicenter, 48-week study (ClinicalTrials.gov NCT02697734), performed at 40 centers in 14 countries (Belgium, Brazil, Canada, China, Costa Rica, Greece, Poland, Portugal, Russia, Spain, Switzerland, Thailand, Turkey, USA), comprising a 12-week, randomized, double-blind, placebo-controlled period followed by a 36-week, open-label osilodrostat treatment period complemented by an optional extension (Fig. 1). The study was conducted in accordance with the Declaration of Helsinki; an independent ethics committee/institutional review board at each site approved the study protocol. All patients provided written informed consent.
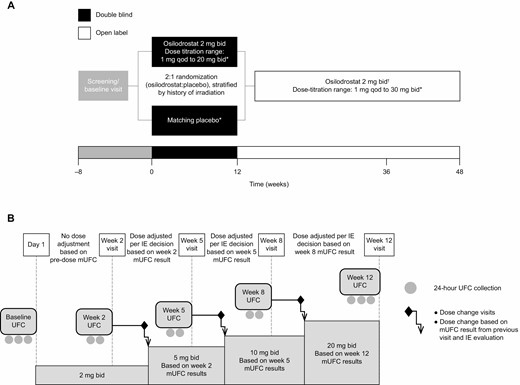
(A) Study design and dosing schedule and (B) timing of study visits, 24-hour UFC collection, and dose adjustments during the LINC 4 study. Three urine samples drawn at 24-hour intervals were collected by patients at screening, within 7 days prior to day 1, and immediately prior to the week 12 visit (primary endpoint). Two 24-hour urine samples were collected immediately prior to each of the other visits (ie, at weeks 2, 5, and 8). Dose matching and adjustments were managed by independent endocrinologists. *Dose adjustments to normalize mUFC or to address safety concerns were permitted. Dose-titration sequence: 2 mg twice daily →5 mg twice daily →10 mg twice daily →20 mg twice daily (maximum dose in double-blind period) →30 mg twice daily (maximum dose in open-label period). Doses of < 2 mg twice daily (1 mg twice daily, 1 mg every day, 1 mg every other day) were allowed if necessary; †All patients on doses of ≥ 2 mg twice daily started open-label osilodrostat 2 mg twice daily at week 12, while patients on < 2 mg twice daily continued with their most recent dose. Abbreviations: bid, twice daily; IE, independent endocrinologist; mUFC, mean urinary free cortisol; qd, every day; qod, every other day.
Eligible patients were aged 18 to 75 years with: either a confirmed diagnosis of persistent/recurrent Cushing disease after pituitary surgery and/or irradiation or de novo disease (nonsurgical candidates), plus mUFC > 1.3 times the upper limit of normal (ULN; calculated from 3 samples preferably collected on 3 consecutive days, with ≥ 2 values > 1.3 × ULN); morning plasma ACTH concentration above the lower limit of normal (LLN); and evidence of a pituitary source of ACTH excess defined by a pituitary tumor > 6 mm in diameter determined by magnetic resonance imaging (MRI), a central-to-peripheral bilateral petrosal sinus sampling gradient of > 2 pre-dose or > 3 post-dose after either corticotropin-releasing hormone or desmopressin acetate stimulation, or histopathological confirmation of an ACTH-producing pituitary tumor for patients who have previously had pituitary surgery. Patients receiving other medical therapies for Cushing disease were eligible after washout (≥ 1 week for ketoconazole, metyrapone, and subcutaneous pasireotide [immediate-release formulation]; ≥ 3 weeks for mifepristone; ≥ 4 weeks for cabergoline; ≥ 8 weeks for pasireotide long-acting release; ≥ 6 months for mitotane). Patients were not eligible to participate if they had received any other investigational drugs within 30 days or 5 half-lives (whichever was longer), or if they had a history of hypersensitivity to drugs of the same or similar class to osilodrostat. Exclusion criteria included: stereotactic radiosurgery (past 2 years); fractionated radiotherapy (past 3 years); pituitary surgery within 3 months; and presence or high risk of optic chiasm compression.
Randomization and Masking
Enrolled patients were randomly assigned (2:1) via interactive-response technology to osilodrostat 2 mg twice daily or matching placebo, stratified by prior pituitary irradiation (yes/no). Patients, investigators, and study sponsor were blinded to randomized treatment assignments and, during the placebo-controlled period, to laboratory results that could disclose randomized treatment assignments. During weeks 1 to 12, independent endocrinologists were unblinded to treatment assignment and laboratory data.
Procedures
During the randomized, double-blind, placebo-controlled period, independent endocrinologists determined dose adjustments, based on efficacy and tolerability, once mUFC results from the week-2, -5, and -8 visits became available for individual patients. Thus, dose increases occurred approximately every 3 weeks. Dose could be increased (2-5-10-20 mg twice daily dose-escalation sequence) if mUFC (mean of 2 samples collected immediately before the study visit) exceeded the ULN (reference range, 11-138 nmol/24 hours [4-50 µg/24 hours]). While the goal was to normalize mUFC, decisions to increase dose took into consideration all data for each patient (eg, level of mUFC, rate of decrease of mUFC, and tolerability of study drug). Dose was maintained if mUFC was within the normal range and the patient had no signs or symptoms of adrenal insufficiency. Dose could be reduced to < 2 mg twice daily if mUFC was below the lower limit of normal or in the lower part of the normal range for patients with adrenal insufficiency symptoms. Patients randomized to placebo received dummy titration schedules to maintain blinding. All patients restarted the open-label period (weeks 13-48) on osilodrostat 2 mg twice daily unless they were on a lower dose at week 12. All patients on < 2 mg twice daily osilodrostat (or matched placebo) at week 12 continued to receive the same dose, regardless of initial treatment allocation. Dosing and adjustments during the open-label period were determined by the investigators based on mUFC values and other relevant data using the same guidelines as for weeks 1 to 12 (dose-escalation sequence 2-5-10-20-30 mg twice daily). Patients who were receiving clinical benefit at week 48 could enter an optional extension.
Study Endpoints and Assessments
The primary objective was to determine whether osilodrostat was superior to placebo in normalizing mUFC at week 12 (primary endpoint: proportion of randomized patients achieving mUFC ≤ ULN at week 12). The key secondary endpoint was the proportion of patients achieving mUFC ≤ ULN at week 36 (both arms combined after open-label treatment for 24 weeks). Overall response (mUFC ≤ ULN [complete response] or > ULN but ≥ 50% reduction from baseline [partial response]) was assessed over time. Other secondary endpoints included: proportion of patients with mUFC ≤ ULN or > ULN but ≥ 50% reduction from baseline at weeks 12, 36, and 48; time to first control of mUFC; mUFC changes during the core period; change from baseline in serum and salivary cortisol levels; change from baseline to weeks 12, 36, and 48 in cardiovascular and metabolic-related parameters associated with Cushing disease (ie, fasting plasma glucose, glycated hemoglobin [HbA1c], fasting lipid profile, blood pressure, weight, and waist circumference) and in physical features (assessed using a semi-quantitative Likert scale for facial rubor, striae, supraclavicular fat pad, dorsal fat pad, proximal muscle wasting, abdominal obesity, and bruising); and change in health-related QoL, assessed using the Cushing’s Disease Health-Related Quality of Life Questionnaire (CushingQoL) (11) and the Beck Depression Inventory second edition (BDIII) (12), from baseline to weeks 12 and 48, from weeks 12 to 36, and from weeks 36 to 48. Overall safety and tolerability assessments included adverse events (AEs) of special interest (related to accumulation of adrenal hormone precursors, hypocortisolism, and QT interval prolongation or arrhythmogenic potential). The mUFC and other laboratory investigations were assessed centrally. The mUFC was measured from 2 or 3 24-hour urine samples, and late-night salivary cortisol (normal range ≤ 2.5 nmol/L) was measured from 2 samples collected between 22:00 and 23:00; mUFC, late-night salivary cortisol, and serum cortisol (morning) samples were collected at screening, 6 to 7 days prior to first treatment, and at each scheduled study visit and were evaluated using liquid chromatography-tandem mass spectrometry. Pituitary MRI with or without gadolinium enhancement was performed locally and images assessed centrally to assess for pituitary enlargement by tumor volume and/or maximum dimension of tumor. If MRI could not be performed, computed tomography of the pituitary gland was performed instead. Measurement of pituitary tumor volume (where possible) and the 3 maximum dimensions of the tumor were made by the independent neuroradiologist at each time point.
Statistical Analyses
To detect a clinically meaningful difference of 45% in complete response rate between 60% of patients in the osilodrostat arm and 15% of patients in the placebo arm, a sample size of 63 patients was required (n = 42 osilodrostat; n = 21 placebo) to provide 91% power based on a one-sided Cochran–Mantel–Haenszel exact test at the 0.025 level of significance. With an additional 10% to account for potential dropouts, a total enrollment of approximately 69 patients was planned. The primary endpoint was tested using the full analysis set (all patients who received ≥ 1 osilodrostat or placebo dose) by a Cochran–Mantel–Haenszel exact test stratified by prior pituitary irradiation (yes/no). The null hypothesis was that the week 12 complete response rates would be the same between the randomized arms; it would be rejected if the one-sided P value was ≤ 0.025 and the odds ratio (OR) was > 1.0. The statistical null hypothesis for the key secondary objective was that the proportion of patients achieving mUFC ≤ ULN at week 36 would be ≤ 30%. The key secondary endpoint was analyzed using the full analysis set and tested based on the two-sided 95% CI constructed using the Clopper–Pearson exact method; the analysis was only performed if the primary objective was met to preserve the overall two-sided type 1 error at 5%. An exploratory analysis was performed to evaluate the correlation between baseline mUFC and the dose received at the time of first mUFC normalization.
Safety analyses were performed using all data from the first patient’s visit until data cutoff (February 25, 2020), when the last patient completed or discontinued the core study (safety data are reported beyond the core for some patients).
Results
Patient Disposition, Baseline Characteristics, and Disease History
Between November 2016 and March 2019, 73 patients were randomized to receive either osilodrostat (n = 48) or placebo (n = 25; Fig. 2) and received ≥ 1 study drug dose. During the 12-week placebo-controlled period, 3 patients discontinued (all osilodrostat); 5 discontinued during open-label treatment (Fig. 2).
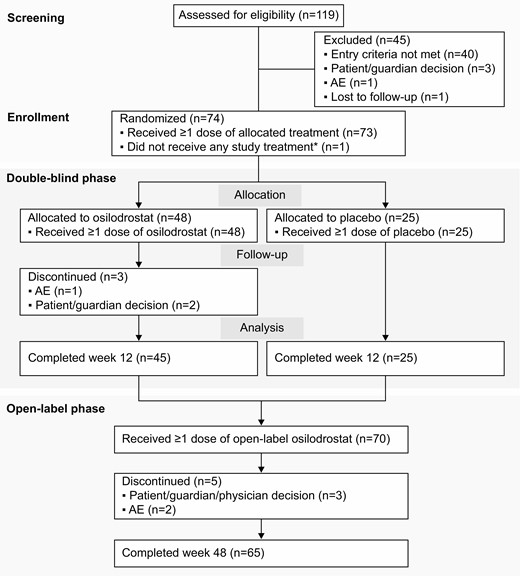
Patient disposition flow chart. *Patient was randomly allocated to osilodrostat but did not receive any study treatment because of a serious AE (grade 4 pituitary apoplexy that required hospitalization prior to receiving any study drug) that was not considered related to treatment. Abbreviation: AE, adverse event.
Median (interquartile range [IQR]) time since diagnosis was 67.4 (26.4–93.8) months (Table 1). Most patients had received prior surgery or medical treatment for Cushing disease, and 84% were female. Baseline mean/median mUFC was similar for patients randomized to osilodrostat (3.1 × ULN/2.5 × ULN) and placebo (3.3 × ULN/2.2 × ULN). Other baseline characteristics were generally balanced between treatment arms (Table 1).
Demographics and baseline characteristics of all patients and by randomized treatment group
| Demographic variable | Osilodrostat (n = 48) | Placebo (n = 25) | All patients (N = 73) |
|---|---|---|---|
| Age, years | |||
| Median | 41.0 | 37.0 | 39.0 |
| Range | 21.0–67.0 | 19.0–63.0 | 19.0–67.0 |
| Sex, n (%) | |||
| Female | 43 (89.6) | 18 (72.0) | 61 (83.6) |
| Male | 5 (10.4) | 7 (28.0) | 12 (16.4) |
| Race, n (%) | |||
| White | 34 (70.8) | 15 (60.0) | 49 (67.1) |
| Asian | 9 (18.8) | 8 (32.0) | 17 (23.3) |
| Black/African American | 2 (4.2) | 0 | 2 (2.7) |
| Other | 1 (2.1) | 1 (4.0) | 2 (2.7) |
| Unknown | 2 (4.2) | 1 (4.0) | 3 (4.1) |
| Median time since diagnosis,a months (IQR) | 69.9 (22.9–92.0) | 65.0 (30.4–103.8) | 67.4 (26.4–93.8) |
| Previous pituitary surgery, n (%) | 41 (85.4) | 23 (92.0) | 64 (87.7) |
| Previous medical therapy for Cushing’s disease, n (%) | 26 (54.2) | 19 (76.0) | 45 (61.6) |
| Previous pituitary irradiation, n (%) | 6 (12.5) | 3 (12.0) | 9 (12.3) |
| mUFC, nmol/24 hours | |||
| Mean (SD) | 421.4 (291.3); | 451.5 (535.1); | 431.7 (388.6); |
| 3.1 × ULN | 3.3 × ULN | 3.1 × ULN | |
| Median (IQR) | 342.2 (252.6–519.9); | 297.6 (211.2–518.8); | 340.3 (221.3–518.8); |
| 2.5 × ULN | 2.2 × ULN | 2.5 × ULN |
ULN for mUFC is 138 nmol/24 hours.
aTime from diagnosis to first osilodrostat dose. Abbreviations: IQR, interquartile range; mUFC, mean urinary free cortisol; ULN, upper limit of normal.
Osilodrostat Exposure
Median (range) treatment duration during the randomized, placebo-controlled period was 12.0 (2.0-13.0) and 12.0 (11.7-13.7) weeks in the osilodrostat and placebo arms, respectively. For all patients (from first to last osilodrostat dose or data cutoff), median (range) osilodrostat exposure was 70.0 (2.0-112.7) weeks. For patients randomized to osilodrostat, overall median (range) duration of osilodrostat exposure was 71.7 (2.0-112.7) weeks; for patients initially randomized to placebo who received osilodrostat in the open-label period, median duration of osilodrostat exposure was 62.3 (20.4-96.3) weeks.
Median (IQR) dose during the placebo-controlled period was 6.9 (4.0-10.7) mg/day for osilodrostat and 9.3 (6.2-12.2) mg/day for matching placebo; a similar proportion of patients received the highest dose (20 mg twice daily osilodrostat: n = 5, 10.4%; matching placebo: n = 3, 12.0%). Median (IQR) osilodrostat dose from baseline to data cutoff was 5.0 (3.8-9.2) mg/day. For patients initially randomized to placebo, overall median (IQR) osilodrostat dose was 6.0 (3.7-9.7) mg/day. During the entire study period (up to data cutoff), 3 patients received the maximum dose of 30 mg twice daily.
Efficacy
The proportion of patients achieving mUFC ≤ ULN (≤138 nmol/24 hours) at week 12 was significantly higher among patients randomized to osilodrostat (n = 37, 77.1%) than to placebo (n = 2, 8.0%), with an estimated OR of 43.4 (95% CI 7.1, 343.2) in favor of osilodrostat (P < 0.0001; Fig. 3A). A consistent treatment effect was observed in patients with and without prior pituitary irradiation. For patients with a history of pituitary irradiation, 5/6 osilodrostat recipients (83.3%) achieved mUFC ≤ ULN at week 12, compared with 1/3 placebo recipients (33.3%; OR 10.0 [95% CI 0.2, 704.5]). For patients without history of pituitary irradiation, mUFC ≤ ULN was seen in 32/42 (76.2%) and 1/22 patients (4.5%), respectively (OR 67.2 [95% CI 8.1, 2861.8]). At week 2, 27.1% of osilodrostat recipients had mUFC ≤ ULN, with greater biochemical benefit of osilodrostat over placebo evident as early as week 5 (58.3% osilodrostat vs 16.0% placebo; Fig. 3B).
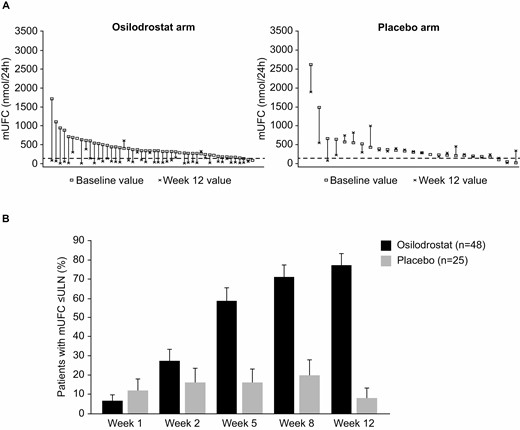
(A) Intrapatient changes in mUFC from baseline to week 12 and (B) proportion of randomized patients with mUFC ≤ ULN up to week 12. ULN for mUFC is 138 nmol/24 hours (50 μg/24 hours). For panel A, each vertical set of data points represents 1 patient and is shown in order of decreasing baseline mUFC. Six patients randomized to osilodrostat and 4 patients randomized to placebo had mUFC ≤ 1.3 × ULN at baseline; however, mUFC was > 1.3 × ULN at screening (ie, patients met the eligibility criterion). Abbreviations: mUFC, mean urinary free cortisol; ULN, upper limit of normal.
The key secondary endpoint was also met: 59/73 patients (80.8% [95% CI 69.9, 89.1]) had mUFC ≤ ULN at week 36 (after 24 weeks of open-label osilodrostat). Benefit was maintained in all patients during open-label treatment, including those initially randomized to placebo, with an overall response rate of 79.5% (n = 58/73; 68.5% complete response, 11.0% partial response) at week 48. Response rates at week 48 in patients with history of prior irradiation were 77.8% complete response (n = 7/9; 95% CI 40.0, 97.2) and 0/9 partial response, and response rates in those without history of prior irradiation were 67.2% complete response (n = 43/64; 95% CI 54.3, 78.4) and 12.5% partial response (n = 8/64; 95% CI 5.6, 23.2). Results should be interpreted with caution because of the small number of patients with history of prior irradiation.
Median time to first controlled mUFC response during the placebo-controlled period was 35 days for patients randomized to osilodrostat (95% CI 34.0, 52.0) and was not reached in patients randomized to placebo during the first 12 weeks. Once patients who were randomized to placebo crossed over to osilodrostat, median time to first mUFC response was also 35 days. At week 12, osilodrostat had normalized mUFC in 6/8 patients with severe hypercortisolism at baseline (ie, mUFC > 5 × ULN; Fig. 3A).
The dose received at first mUFC normalization was ≤ 4 mg/day in 33 patients (45.2%), > 4 to 10 mg/day in 23 patients (31.5%), >10 to 20 mg/day in 12 patients (16.4%) and > 20 mg/day in 5 patients (6.8%). There was no correlation between baseline mUFC and dose received at first mUFC normalization (r = 0.03; P = 0.81). At week 48, 84% of patients with normal mUFC were receiving doses of ≤ 10 mg/day (≤ 4 mg/day, n = 28 [56.0%]; > 4 to 10 mg/day, n = 14 [28.0%]; > 10 to 20 mg/day, n = 2 [4.0%]; > 20 mg/day, n = 6 [12.0%]).
Mean (SD) mUFC in osilodrostat recipients declined from high baseline levels (421.4 [291.3] nmol/24 hours, 3.1 [2.1] × ULN) to normal (98.2 [122.5] nmol/24 hours, 0.7 [0.9] × ULN) at week 12; there was no appreciable reduction with placebo (baseline: 451.5 [535.1] nmol/24 hours, 3.3 [3.9] × ULN; week 12: 411.3 [389.9] nmol/24 hours, 3.0 [2.8] × ULN; Fig. 4). At initiation of open-label treatment (weeks 12-14), mean mUFC transiently increased for patients who had been receiving > 2 mg twice daily upon restarting osilodrostat at 2 mg twice daily, in accordance with the study protocol. Mean mUFC was then maintained within the normal range to week 48 (Fig. 4).
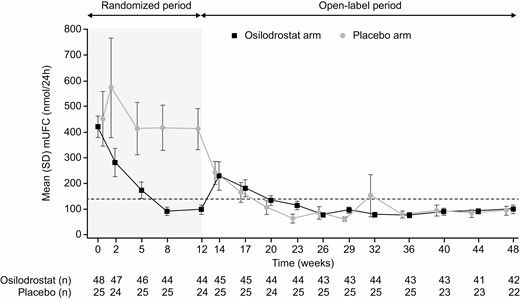
Mean mUFC at time points up to weeks 12 and 48 by randomized treatment group. Dashed horizontal line indicates ULN for mUFC: 138 nmol/24 hours (50 μg/24 hours). Abbreviations: mUFC, mean urinary free cortisol; ULN, upper limit of normal.
At week 12, mean (SD) serum cortisol levels had decreased in osilodrostat recipients from 1.0 (0.3) × ULN to 0.5 (0.3) × ULN (Table 2). In placebo recipients, serum cortisol levels increased from 0.9 (0.3) × ULN at baseline to 1.0 (0.4) × ULN. At the end of open-label treatment, serum cortisol levels in all patients were 0.6 (0.2) × ULN. Mean late-night salivary cortisol decreased in osilodrostat recipients from 4.7 (11.5) × ULN at baseline to 1.4 (0.9) × ULN at week 12 but increased in placebo recipients from 3.6 (2.7) to 4.1 (2.6) × ULN (Table 2). By week 48, mean late-night salivary cortisol levels in all patients had decreased to 1.5 (1.0) × ULN. The proportion of evaluable patients with late-night salivary cortisol ≤ ULN was 43.5% (n = 20/46) at week 12 (osilodrostat arm only), 47.8% (n = 32/67) at week 36 and 38.1% (n = 24/63) at week 48. The proportion of osilodrostat recipients with both mUFC and late-night salivary cortisol ≤ ULN was 43.2% (n = 19/44) at week 12 (osilodrostat arm only), 44.8% (n = 30/67) at week 36 and 33.3% (n = 21/63) at week 48. Reductions in mean early-morning salivary cortisol levels were also observed in all patients (Table 2).
Mean serum and salivary cortisol (morning and late-night) levels and change from baseline during the LINC 4 study
| Randomized to osilodrostat (n = 48) | Randomized to placebo (n = 25)a | All patients (N = 73) | ||||
|---|---|---|---|---|---|---|
| Mean value (SD) | Actual change (95% CI) | Mean value (SD) | Actual change (95% CI) | Mean value (SD) | Actual change (95% CI) | |
| Serum cortisol, nmol/L | ||||||
| Baseline | 565.8 (169.0) | – | 486.1 (198.1) | – | 538.1 (182.3) | – |
| Week 12 | 295.6 (160.4) | −276.0 (−330.2, −221.7) | 560.1 (204.4) | 73.0 (−5.2, 151.2) | – | – |
| Week 48 | 354.0 (114.6) | −210.7 (−261.5, −159.9) | 353.7 (145.5) | −131.0 (−236.1, −26.0) | 353.9 (124.9) | −182.9 (−231.5, −134.3) |
| Early-morning salivary cortisol, nmol/L | ||||||
| Baseline | 17.2 (30.0) | – | 14.1 (12.3) | – | 16.1 (25.3) | – |
| Week 12 | 5.8 (7.0) | −11.6 (−20.5, −2.7) | 14.1 (10.0) | −0.3 (−5.1, 4.4) | – | – |
| Week 48 | 4.7 (2.9) | −11.8 (−21.8, −1.8) | 6.9 (7.7) | −6.0 (−10.8, −1.1) | 5.4 (5.2) | −9.8 (−16.4, −3.1) |
| Late-night salivary cortisol, nmol/L | ||||||
| Baseline | 11.7 (28.7) | – | 9.0 (6.7) | – | 10.8 (23.5) | – |
| Week 12 | 3.5 (2.3) | −8.5 (−17.3, 0.3) | 10.3 (6.5) | 1.3 (−2.4, 5.1) | – | – |
| Week 48 | 3.5 (2.6) | −9.3 (−18.5, −0.2) | 4.0 (2.5) | −5.0 (−7.6, −2.5) | 3.7 (2.6) | −7.8 (−13.8, −1.9) |
Reference ranges, male and female, ≥18 years old: serum cortisol (08:00–10:00), 127–567 nmol/L; early-morning (07:00–09:00) salivary cortisol, 1.1–15.5 nmol/L; late-night (22:00–23:00) salivary cortisol: ≤2.5 nmol/L.
aAt week 48, patients randomized to placebo had received 12 weeks of placebo followed by 36 weeks of osilodrostat treatment.
Mean (SD) ACTH (normal range 1.3-11.1 pmol/L) increased following initiation of osilodrostat from 14.8 (9.6) pmol/L at baseline to 33.9 (26.5) pmol/L at week 12. In placebo recipients, mean (SD) ACTH was 21.6 (53.6) pmol/L at baseline and 21.9 (54.7) pmol/L at week 12. At week 48, mean (SD) ACTH in all patients was 43.7 (44.6) pmol/L.
Changes in Cardiovascular and Metabolic Parameters of Hypercortisolism, Clinical Signs, and QoL
Most cardiovascular and metabolic-related parameters showed improvement in osilodrostat recipients by week 12 that was not discernible in placebo recipients, including systolic and diastolic blood pressure, HbA1c, high-density lipoprotein cholesterol, weight, and waist circumference (Table 3); these improvements continued during osilodrostat treatment until week 48 regardless of initial treatment assignment (Table 3). In patients who were classed as diabetic at baseline (n = 23; defined as at least one of the following at baseline: medical history of diabetes, receipt of antidiabetic medication at baseline, fasting plasma glucose ≥ 126 mg/dL or HbA1c ≥ 6.5%), mean (SD) fasting plasma glucose decreased from 110.7 (19.4) mg/dL at baseline to 101.8 (21.0) mg/dL at week 12 and 98.2 (15.3) mg/dL at week 48; mean (SD) HbA1c decreased from 6.7% (0.9) at baseline to 6.3% (0.7) at week 12 and 6.3% (0.5) at week 48. In patients who were not classed as diabetic at baseline (n = 50), fasting plasma glucose and HbA1c levels remained within the normal range and were stable throughout treatment (fasting plasma glucose: baseline, 88.4 [10.8] mg/dL; week 48, 87.2 [10.4] mg/dL; HbA1c: baseline, 5.5% [0.4]; week 48, 5.5% [0.3]).
Mean change in clinical signs of hypercortisolism at week 12 and week 48, by randomized treatment group and overall
| Randomized to osilodrostat (n = 48) | Randomized to placebo (n = 25)a | All patients (N = 73) | |||||||
|---|---|---|---|---|---|---|---|---|---|
| Mean value (SD) | Actual change (95% CI) | Percentage change (95% CI) | Mean value (SD) | Actual change (95% CI) | Percentage change (95% CI) | Mean value (SD) | Actual change (95% CI) | Percentage change (95% CI) | |
| Weight, kg | |||||||||
| Baseline | 78.8 (17.5) | – | – | 77.3 (16.9) | – | – | 78.3 (17.2) | – | – |
| Week 12 | 78.1 (17.9) | −0.8 (−1.7, 0.1) | −1.1 (−2.3, 0.0) | 75.7 (15.7) | −0.1 (−1.0, 0.8) | −0.2 (−1.4, 1.0) | – | – | – |
| Week 48 | 74.1 (16.6) | −3.6 (−5.7, −1.6) | −4.5 (−6.8, −2.1) | 72.5 (17.4) | −5.5 (−8.3, −2.7) | −7.1 (−10.7, −3.5) | 73.5 (16.8) | −4.3 (−5.9, −2.6) | −5.4 (−7.3, −3.4) |
| Waist circumference, cm | |||||||||
| Baseline | 102.5 (17.0) | – | – | 103.4 (15.5) | – | – | 102.8 (16.4) | – | – |
| Week 12 | 101.4 (17.7) | −1.0 (−2.3, 0.3) | −1.0 (−2.3, 0.3) | 102.1 (15.1) | −0.5 (−1.9, 1.0) | −0.4 (−1.9, 1.1) | – | – | – |
| Week 48 | 97.3 (17.0) | −4.1 (−6.0, −2.2) | −3.9 (−5.7, −2.1) | 97.8 (17.2) | −5.3 (−7.9, −2.8) | −5.3 (−7.8, −2.8) | 97.5 (16.9) | −4.5 (−6.0, −3.0) | −4.4 (−5.8, −3.0) |
| Systolic blood pressure, mmHg | |||||||||
| Baseline | 132.4 (19.2) | – | – | 130.0 (17.7) | – | – | 131.5 (18.6) | – | – |
| Week 12 | 125.5 (13.7) | −7.1 (−12.6, −1.6) | −4.1 (−7.8, −0.5) | 127.4 (14.9) | −0.9 (−5.8, 4.1) | −0.2 (−4.2, 3.9) | – | – | – |
| Week 48 | 123.0 (15.4) | −9.1 (−15.2, −2.9) | −5.7 (−9.9, −1.5) | 117.0 (16.2) | −11.0 (−20.8, −1.1) | −7.2 (−14.7, 0.3) | 120.9 (15.8) | −9.7 (−14.9, −4.6) | −6.2 (−9.9, −2.6) |
| Diastolic blood pressure, mmHg | |||||||||
| Baseline | 87.2 (12.7) | – | – | 88.2 (10.8) | – | – | 87.5 (12.0) | – | – |
| Week 12 | 81.8 (10.7) | −4.8 (−8.2, −1.5) | −4.6 (−8.2, −1.1) | 87.0 (11.2) | −1.4 (−5.5, 2.8) | −1.0 (−5.7, 3.7) | – | – | – |
| Week 48 | 81.7 (11.0) | −4.4 (−8.1, −0.7) | −4.3 (−8.5, −0.1) | 83.5 (10.4) | −3.9 (−9.8, 2.0) | −3.4 (−10.4, 3.5) | 82.3 (10.8) | −4.2 (−7.3, −1.2) | −4.0 (−7.5, −0.4) |
| Fasting plasma glucose, mg/dL | |||||||||
| Baseline | 97.3 (18.1) | – | – | 91.4 (15.2) | – | – | 95.3 (17.3) | – | – |
| Week 12 | 92.0 (15.5) | −4.3 (−8.9, 0.2) | −3.1 (−7.4, 1.1) | 91.1 (11.2) | −1.7 (−6.3, 2.9) | −0.9 (−5.8, 4.0) | – | – | – |
| Week 48 | 90.5 (12.9) | −5.6 (−10.1, −1.1) | −4.3 (−8.1, −0.5) | 90.7 (13.7) | 1.8 (−4.5, 8.1) | 3.3 (−4.8, 11.4) | 90.6 (13.1) | −3.1 (−6.8, 0.6) | −1.7 (−5.4, 2.0) |
| HbA1c, % | |||||||||
| Baseline | 6.0 (0.9) | – | – | 5.7 (0.6) | – | – | 5.9 (0.8) | – | – |
| Week 12 | 5.7 (0.7) | −0.2 (−0.4, −0.1) | −3.5 (−5.4, −1.6) | 5.6 (0.6) | 0.0 (−0.2, 0.1) | −0.7 (−2.7, 1.3) | – | – | – |
| Week 48 | 5.8 (0.6) | −0.2 (−0.4, 0.0) | −2.4 (−5.0, 0.2) | 5.7 (0.5) | 0.1 (−0.1, 0.2) | 1.5 (−1.5, 4.4) | 5.7 (0.5) | −0.1 (−0.2, 0.0) | −1.1 (−3.1, 0.9) |
| Total cholesterol, mmol/L | |||||||||
| Baseline | 5.7 (1.3) | – | – | 5.3 (1.2) | – | – | 5.5 (1.3) | – | – |
| Week 12 | 4.9 (1.2) | −0.8 (−1.1, −0.5) | −12.8 (−17.8, −7.8) | 5.3 (1.3) | 0.0 (−0.2, 0.3) | 0.6 (−5.0, 6.2) | – | – | – |
| Week 48 | 5.1 (1.3) | −0.6 (−1.0, −0.1) | −7.4 (−15.5, 0.8) | 4.9 (1.2) | −0.4 (−0.9, 0.1) | −6.5 (−14.8, 1.7) | 5.0 (1.3) | −0.5 (−0.8, −0.2) | −7.1 (−13.0, −1.1) |
| LDL cholesterol, mmol/L | |||||||||
| Baseline | 3.4 (1.1) | – | – | 3.0 (1.1) | – | – | 3.3 (1.1) | – | – |
| Week 12 | 3.0 (1.0) | −0.5 (−0.7, −0.2) | −9.1 (−19.9, 1.7) | 3.1 (1.1) | 0.1 (−0.1, 0.3) | 4.5 (−3.9, 12.8) | – | – | – |
| Week 48 | 3.0 (1.0) | −0.5 (−0.8, −0.2) | −9.1 (−18.2, 0.0) | 2.8 (1.1) | −0.2 (−0.6, 0.2) | −2.2 (−13.3, 9.0) | 2.9 (1.1) | −0.4 (−0.6, −0.1) | −6.8 (−13.7, 0.2) |
| HDL cholesterol, mmol/L | |||||||||
| Baseline | 1.6 (0.4) | – | – | 1.5 (0.4) | – | – | 1.6 (0.4) | – | – |
| Week 12 | 1.3 (0.3) | −0.3 (−0.4, −0.2) | −19.9 (−24.4, −15.3) | 1.5 (0.5) | 0.0 (−0.1, 0.1) | 0.1 (−7.2, 7.5) | – | – | – |
| Week 48 | 1.4 (0.3) | −0.2 (−0.3, −0.1) | −11.9 (−16.5, −7.3) | 1.4 (0.4) | −0.1 (−0.3, 0.0) | −7.7 (−16.1, 0.7) | 1.4 (0.4) | −0.2 (−0.3, −0.1) | −10.5 (−14.5, −6.4) |
| Triglycerides, mmol/L | |||||||||
| Baseline | 1.5 (0.8) | – | – | 1.7 (0.9) | – | – | 1.6 (0.8) | – | – |
| Week 12 | 1.5 (0.8) | 0.0 (−0.1, 0.2) | 5.4 (−7.8, 18.7) | 1.5 (0.8) | −0.2 (−0.4, 0.0) | −7.1 (−20.5, 6.4) | – | – | – |
| Week 48 | 1.5 (1.0) | 0.1 (−0.2, 0.4) | 9.8 (−6.9, 26.4) | 1.5 (0.8) | −0.2 (−0.5, 0.0) | −10.1 (−25.6, 5.4) | 1.5 (0.9) | 0.0 (−0.2, 0.2) | 2.9 (−9.2, 15.1) |
Reference ranges: fasting plasma glucose, 70–115 mg/dL (13–49 years), 70–125 mg/dL (≥50 years); HbA1c, ≤6.4%; total cholesterol, 0–5.2 mmol/L (≥20 years); HDL cholesterol, >0.89 mmol/L; LDL cholesterol, 0–3.4 mmol/L (≥20 years); triglycerides, 0–2.2 mmol/L.
Abbreviations: HbA1c, glycated hemoglobin; HDL, high-density lipoprotein; LDL, low-density lipoprotein.
aAt week 48, patients randomized to placebo had received 12 weeks of placebo followed by 36 weeks of osilodrostat treatment.
Improvements from baseline in physical features of hypercortisolism were also observed by week 12 of osilodrostat treatment, with continued improvement in all patients at week 48 (Table 4). Half of all patients had a reduction of supraclavicular (52.5%; 95% CI 39.3, 65.4) and dorsal (50.0%; 95% CI 36.8, 63.2) fat pad. Facial rubor, striae, proximal muscle atrophy, and central obesity each had a favorable shift from baseline in at least 25% of patients. Of the 58 patients assessed for hirsutism at baseline, 48 had an assessment at week 48 and 44/48 presented with either improvement or no change from baseline; no data are available for the remaining 10 patients. Overall, fewer than 10% of patients experienced a worsening of physical features at week 48.
Change from baseline in physical features of hypercortisolism at week 48 of the LINC 4 study
| Randomized to osilodrostat (n = 48) | Randomized to placebo (n = 25)a | All patients (N = 73) | |||||||
|---|---|---|---|---|---|---|---|---|---|
| Improvement, n/N (%) | No change, n/N (%) | Worsening, n/N (%) | Improvement, n/N (%) | No change, n/N (%) | Worsening, n/N (%) | Improvement, n/N (%) | No change, n/N (%) | Worsening, n/N (%) | |
| Facial rubor | 16/39 (41.0%) | 21/39 (53.8%) | 2/39 (5.1%) | 11/21 (52.4%) | 10/21 (47.6%) | 0/21 (0%) | 27/60 (45.0%) | 31/60 (51.7%) | 2/60 (3.3%) |
| 95% CI | 25.6, 57.9 | 37.2, 69.9 | 0.6, 17.3 | 29.8, 74.3 | 25.7, 70.2 | NE | 32.1, 58.4 | 38.4, 64.8 | 0.4, 11.5 |
| Hirsutism | 5/33 (15.2%) | 24/33 (72.7%) | 4/33 (12.1%) | 3/15 (20.0%) | 12/15 (80.0%) | 0/15 (0%) | 8/48 (16.7%) | 36/48 (75.0%) | 4/48 (8.3%) |
| 95% CI | 5.1, 31.9 | 54.5, 86.7 | 3.4, 28.2 | 4.3, 48.1 | 51.9, 95.7 | NE | 7.5, 30.2 | 60.4, 86.4 | 2.3, 20.0 |
| Striae | 11/38 (28.9%) | 27/38 (71.1%) | 0/38 (0%) | 4/21 (19.0%) | 17/21 (81.0%) | 0/21 (0%) | 15/59 (25.4%) | 44/59 (74.6%) | 0/59 (0%) |
| 95% CI | 15.4, 45.9 | 54.1, 84.6 | NE | 5.4, 41.9 | 58.1, 94.6 | NE | 15.0, 38.4 | 61.6, 85.0 | NE |
| Supraclavicular fat pad | 21/39 (53.8%) | 17/39 (43.6%) | 1/39 (2.6%) | 11/22 (50.0%) | 11/22 (50.0%) | 0/22 (0%) | 32/61 (52.5%) | 28/61 (45.9%) | 1/61 (1.6%) |
| 95% CI | 37.2, 69.9 | 27.8, 60.4 | 0.1, 13.5 | 28.2, 71.8 | 28.2, 71.8 | NE | 39.3, 65.4 | 33.1, 59.2 | 0.0, 0.8 |
| Dorsal fat pad | 20/38 (52.6%) | 16/38 (42.1%) | 2/38 (5.3%) | 10/22 (45.5%) | 10/22 (45.5%) | 2/22 (9.1%) | 30/60 (50.0%) | 26/60 (43.3%) | 4/60 (6.7%) |
| 95% CI | 35.8, 69.0 | 26.3, 59.2 | 0.6, 17.7 | 24.4, 67.8 | 24.4, 67.8 | 1.1, 29.2 | 36.8, 63.2 | 30.6, 56.8 | 1.8, 16.2 |
| Proximal muscle atrophy | 10/39 (25.6%) | 25/39 (64.1%) | 4/39 (10.3%) | 8/22 (36.4%) | 13/22 (59.1%) | 1/22 (4.5%) | 18/61 (29.5%) | 38/61 (62.3%) | 5/61 (8.2%) |
| 95% CI | 13.0, 42.1 | 47.2, 78.8 | 2.9, 24.2 | 17.2, 59.3 | 36.4, 79.3 | 0.1, 22.8 | 18.5, 42.6 | 49.0, 74.4 | 2.7, 18.1 |
| Central obesity | 16/39 (41.0%) | 19/39 (48.7%) | 4/39 (10.3%) | 9/22 (40.9%) | 12/22 (54.5%) | 1/22 (4.5%) | 25/61 (41.0%) | 31/61 (50.8%) | 5/61 (8.2%) |
| 95% CI | 25.6, 57.9 | 32.4, 65.2 | 2.9, 24.2 | 20.7, 63.6 | 32.2, 75.6 | 0.1, 22.8 | 28.6, 54.3 | 37.7, 63.9 | 2.7, 18.1 |
| Ecchymosis | 9/39 (23.1%) | 29/39 (74.4%) | 1/39 (2.6%) | 3/21 (14.3%) | 17/21 (81.0%) | 1/21 (4.8%) | 12/60 (20.0%) | 46/60 (76.7%) | 2/60 (3.3%) |
| 95% CI | 11.1, 39.3 | 57.9, 87.0 | 0.1, 13.5 | 3.0, 36.3 | 58.1, 94.6 | 0.1, 23.8 | 10.8, 32.3 | 64.0, 86.6 | 0.4, 11.5 |
aAt week 48, patients randomized to placebo had received 12 weeks of placebo followed by 36 weeks of osilodrostat treatment. Abbreviation: NE, not evaluable.
Improvements were seen in patient-reported outcomes; these were more marked from baseline to week 48 (mean [95% CI] change: CushingQoL, 12.0 [8.2, 15.9] points; BDI-II, −4.2 [−6.1, −2.3] points) compared with the 12-week placebo-controlled period (Table 5).
Mean change in patient-reported outcomes at week 12 and week 48, by randomized treatment group and overall
| Randomized to osilodrostat (n = 48) | Randomized to placebo (n = 25)a | All patients (N = 73) | ||||
|---|---|---|---|---|---|---|
| Mean value (SD) | Actual change (95% CI) | Mean value (SD) | Actual change (95% CI) | Mean value (SD) | Actual change (95% CI) | |
| CushingQoL score | ||||||
| Baseline | 49.1 (19.6) | – | 56.9 (19.0) | – | 51.8 (19.6) | – |
| Week 12 | 56.1 (22.1) | 6.2 (1.7, 10.6) | 65.6 (17.6) | 8.6 (3.5, 13.7) | – | – |
| Week 48 | 62.8 (22.2) | 11.7 (6.6, 16.7) | 69.9 (16.9) | 12.8 (6.5, 19.1) | 65.3 (20.7) | 12.0 (8.2, 15.9) |
| BDI-II score | ||||||
| Baseline | 12.2 (10.2) | – | 8.4 (7.8) | – | 10.9 (9.6) | – |
| Week 12 | 10.3 (8.5) | −1.4 (−3.7, 1.0) | 4.7 (6.1) | −3.9 (−6.2, −1.6) | – | – |
| Week 48 | 6.7 (6.7) | −4.3 (−6.7, −2.0) | 4.1 (7.5) | −4.0 (−7.5, −0.6) | 5.8 (7.0) | −4.2 (−6.1, −2.3) |
aAt week 48, patients randomized to placebo had received 12 weeks of placebo followed by 36 weeks of osilodrostat treatment.
Abbreviations: BDI-II, Beck Depression Inventory second edition; CushingQoL, Cushing’s Disease Health-Related Quality of Life Questionnaire.
Safety and Tolerability
The most common AEs during the placebo-controlled period included decreased appetite, arthralgia, and nausea (Table 6). Grade 3/4 AEs occurred in 20.8% and 20.0% of osilodrostat and placebo recipients, respectively; hypertension was most common (8.3% osilodrostat vs 16.0% placebo). Only 1 patient discontinued because of an AE (arthralgia). During the placebo-controlled period, 77.1% of osilodrostat and 60.0% of placebo recipients received ≥ 1 concomitant medication; the most common concomitant medications (> 5% in either arm) were acetaminophen (osilodrostat 10.4% vs placebo 8.0%), ranitidine, and ibuprofen (both 6.3% vs 0%).
Summary of adverse events during the placebo-controlled period and overall study period
| Placebo-controlled period | Overall perioda | ||
|---|---|---|---|
| Osilodrostat (n = 48) | Placebo (n = 25) | All patientsb (N = 73) | |
| Any AE | 46 (95.8%) | 23 (92.0%) | 73 (100%) |
| Serious AE | 2 (4.2%) | 1 (4.0%) | 8 (11.0%) |
| AE leading to discontinuationc | 1 (2.1%) | 0 | 8 (11.0%) |
| Intensity of AE | |||
| Grade 1‒2 | 36 (75.0%) | 18 (72.0%) | 45 (61.6%) |
| Grade 3‒4 | 10 (20.8%) | 5 (20.0%) | 28 (38.4%) |
| Most common AEsd (occurring in > 10% of patients during the overall period) | |||
| Decreased appetite | 18 (37.5%) | 4 (16.0%) | 33 (45.2%) |
| Arthralgia | 17 (35.4%) | 2 (8.0%) | 33 (45.2%) |
| Fatigue | 12 (25.0%) | 4 (16.0%) | 28 (38.4%) |
| Nausea | 15 (31.3%) | 3 (12.0%) | 27 (37.0%) |
| Headache | 7 (14.6%) | 6 (24.0%) | 24 (32.9%) |
| Myalgia | 11 (22.9%) | 1 (4.0%) | 19 (26.0%) |
| Dizziness | 9 (18.8%) | 4 (16.0%) | 19 (26.0%) |
| Adrenal insufficiency | 7 (14.6%) | 0 | 18 (24.7%) |
| Increased blood testosterone | 5 (10.4%) | 0 | 18 (24.7%) |
| Diarrhea | 10 (20.8%) | 0 | 17 (23.3%) |
| Hypertension | 8 (16.7%) | 7 (28.0%) | 16 (21.9%) |
| Asthenia | 11 (22.9%) | 0 | 15 (20.5%) |
| Upper respiratory tract infection | 5 (10.4%) | 0 | 15 (20.5%) |
| Peripheral edema | 5 (10.4%) | 0 | 12 (16.4%) |
| Abdominal pain | 4 (8.3%) | 0 | 12 (16.4%) |
| Hypotension | 5 (10.4%) | 0 | 11 (15.1%) |
| Urinary tract infection | 4 (8.3%) | 0 | 11 (15.1%) |
| Acne | 2 (4.2%) | 0 | 10 (13.7%) |
| Back pain | 2 (4.2%) | 0 | 10 (13.7%) |
| Pruritus | 6 (12.5%) | 0 | 9 (12.3%) |
| Vomiting | 5 (10.4%) | 0 | 9 (12.3%) |
| Tachycardia | 7 (14.6%) | 0 | 8 (11.0%) |
Data are n (%).
Abbreviation: AE, adverse event.
aIncludes all data until data cutoff (occurred when the last patient completed or discontinued the core study); median (range) osilodrostat exposure was 70.0 (2.0–112.7) weeks;
bExcludes data collected for placebo recipients collected during the 12-week randomized period;
cAdrenal insufficiency, n = 2; hyperbilirubinemia, hypokalemia, headache, arthralgia, pituitary tumor, benign pituitary tumor, depression, n = 1 each;
dPatients with multiple events in the same category are counted only once.
AEs during the entire study (median treatment duration 70.0 weeks [all patients]) are shown in Table 6. Grade 3/4 AEs occurred in 38.4% of patients, the most common being hypertension (13.7%). Eight patients (11.0%) discontinued because of AEs (Table 6). No deaths were reported. Overall, 98.6% received ≥ 1 concomitant medication. These most frequently included agents for the treatment of infections and inflammation, blood pressure control, blood glucose control, electrolyte regulation, and vitamin/mineral supplementation. At data cutoff, the most common concomitant medications (≥ 15% overall) were acetaminophen (28.8%), spironolactone, cholecalciferol (21.9% each), calcium carbonate (20.5%), potassium chloride, metformin (17.8% each), amlodipine, levothyroxine (16.4% each), and ibuprofen (15.1%).
During the 12-week placebo-controlled period, 14.6% (n = 7) of osilodrostat and 0% of placebo recipients experienced any AE that was categorized in accordance with the protocol as potentially related to hypocortisolism, compared with 27.4% (n = 20; grade 3/4, n = 2/0; adrenal insufficiency, n = 18; acute adrenocortical insufficiency, n = 1; steroid-withdrawal syndrome, n = 1) of all patients up to data cutoff (February 25, 2020). Adrenal insufficiency was an investigator-reported AE term based on their clinical judgment; there was no protocol-mandated requirement for adrenal insufficiency to be confirmed by measurement of serum cortisol levels. Overall, dose was temporarily interrupted in 15, adjusted in 6, and discontinued in 2 patients; 13 received concomitant glucocorticoids to manage the AE. Events were ongoing in 5 patients at data cutoff. AEs of arrhythmogenic potential and QT prolongation occurred in 3 patients overall, all of which resolved.
By week 12, 43.8% of osilodrostat (n = 21; most frequently hypertension, n = 8) recipients experienced any AE that was categorized in accordance with the protocol as potentially related to accumulation of adrenal hormone precursors, compared with 36.0% (n = 9; most frequently hypertension, n = 7) of placebo recipients at week 12, and with 61.6% (n = 45; grade 3/4, n = 13/0; most frequently increased blood testosterone, n = 18 and hypertension, n = 16) of all patients up to data cutoff. Overall, dose was temporarily interrupted in 2, adjusted in 2, and discontinued in 1; 26 received concomitant medication to manage the AE. Mean (SD) serum potassium levels remained stable and within the normal range (3.5-5.3 mmol/L) throughout osilodrostat treatment (baseline: 4.1 [0.3] mmol/L, n = 73; week 12: 4.0 [0.4] mmol/L, n = 44 [osilodrostat recipients only]; week 48: 4.0 [0.4] mmol/L, n = 64). Among female participants, 8/43 osilodrostat (18.6%) and 1/18 placebo (5.6%) recipients had testosterone levels > ULN at baseline, vs 26 (60.5%) and 2 (11.1%) at week 12, respectively. At data cutoff, the number of female patients with testosterone levels > ULN had reduced to 22/61 (36.1%); during the entire study, increased testosterone was reported as an AE in 18/61 females (29.5%). AEs of hirsutism occurred in 7 females (9.6%; grade 1/2), all of which were suspected to be related to the study drug. The mUFC was below the ULN in 4 patients at the time of the AE. In 1 patient, the AE was preceded by an instance of increased blood testosterone, and in another, it coincided with increased ACTH and pituitary adenoma growth. Osilodrostat dose was not adjusted, interrupted, or discontinued in any patient. Two patients received concomitant medication. Hirsutism was ongoing in 6 patients at data cutoff.
Overall, 21 patients had a macroadenoma (≥10 mm) and 50 had a microadenoma (<10 mm) at baseline. Of patients with measurements at baseline and week 48, 40.0% (n = 14/35; microadenoma, n = 11/28; macroadenoma, n = 3/7) had a ≥ 20% increase and 28.6% (n = 10/35; microadenoma, n = 9/28; macroadenoma, n = 1/7) had a ≥ 20% decrease in tumor volume from baseline. The remaining 11 patients (31.4%) had a < 20% change (microadenoma, n = 8/28; macroadenoma, n = 3/7). No pattern was observed between time on treatment and time of tumor volume increase, nor between percentage change in tumor volume and total or last osilodrostat dose received (data not shown). Two patients (2.7%) discontinued because of pituitary tumor enlargement.
Discussion
In this randomized, placebo-controlled trial, osilodrostat treatment rapidly reduced mUFC as early as week 2 in some patients. The biochemical benefits of osilodrostat over placebo were evident from week 5, with the primary outcome of mUFC normalization at week 12 achieved in a significantly greater proportion of osilodrostat recipients than placebo (77% vs 8%). Cortisol normalization was also achieved by week 12 in most patients with severe hypercortisolism. Osilodrostat treatment maintained mUFC excretion within the normal range in 68.5% of patients at week 48, regardless of initial treatment assignment, at a median dose over the whole treatment period of 5 mg/day.
The increased mortality in patients with Cushing disease is believed to be mostly attributable to cardiovascular complications and other comorbidities, including infections and metabolic and skeletal disorders (13). Osilodrostat treatment led to improvements in most cardiovascular and metabolic-related parameters assessed, including weight, fasting plasma glucose, systolic and diastolic blood pressure, and total cholesterol, as early as week 12. Patients assigned to the placebo arm did not experience improvements in these parameters. Triglycerides did not change but were not elevated at baseline, which limited the potential for observing a reduction. The mechanism by which HDL cholesterol decreased, yet remained within the normal range, during osilodrostat treatment is unknown. Similar trends in triglycerides and HDL cholesterol were observed in the previous phase III trial of osilodrostat (LINC 3) (10), and during a phase III trial of levoketoconazole (SONICS), another steroidogenesis inhibitor, a small but significant decrease in HDL cholesterol and an increase in serum triglycerides were observed (14). Notably, patients who were classed as diabetic at baseline experienced improvements in both fasting plasma glucose and HbA1c from above normal levels at baseline to within the normal range (<100 mg/dL and < 6.5%, respectively) during osilodrostat treatment. The improvements in cardiovascular and metabolic parameters were sustained throughout osilodrostat treatment and have the potential to alleviate the burden of comorbidities in many patients with Cushing disease.
Osilodrostat treatment was associated with an improvement in at least one physical feature of Cushing syndrome in all patients during osilodrostat treatment, including reduced supraclavicular and dorsal fat pads in ≥ 50% of patients and improvement in facial rubor, striae, proximal muscle atrophy, and central obesity in ≥ 25%. Clinically meaningful improvements in CushingQoL score were also observed during osilodrostat treatment from as early as week 12. Improvements in multiple clinical features of Cushing disease and remission of disease can have a substantial positive effect on patient QoL (15).
In this study, 81% of patients achieved normal mUFC with osilodrostat by week 36. No other available medical therapies for Cushing disease have been evaluated in placebo-controlled trials, and no head-to-head studies have been performed. However, in other prospective trials of steroidogenesis inhibitors in patients with Cushing syndrome, the cortisol normalization rate was 31% after 6 months of levoketoconazole (n = 80/94 had Cushing disease) (14) and 49% after 36 weeks of metyrapone (n = 44/49 had Cushing disease; e-ECE 2021 abstract) (16). In a large retrospective evaluation of metyrapone (median treatment duration: 3 months; range, 3 days to 11.6 years; dose schedule: 2-4 doses/day) in patients with Cushing syndrome (n = 115/164 had Cushing disease), 43% of 37 patients with mUFC measurements available had normalized mUFC (17). Additionally, in one phase III trial, the long-acting intramuscular formulation of pasireotide normalized mUFC in 35% of patients at 12 months (18). With a twice daily treatment schedule, and doses ≤ 10 mg/day required in most cases, osilodrostat represents an effective and convenient treatment option for patients with Cushing disease, as noted in The Pituitary Society 2021 update of their Cushing disease guidelines (3); treatment decisions should be tailored to each patient.
These results build on a prior phase III study in Cushing disease in which osilodrostat was initially administered to all patients; those who achieved normalization of urinary cortisol excretion were then randomized to continue osilodrostat or change to placebo during an 8-week double-blind period (10). Urinary cortisol excretion increased above the normal range in most patients once osilodrostat treatment was withdrawn, even after long-standing control (10).
Previous research in patients with Cushing disease taking pasireotide showed that patients who achieved normalization of both mUFC and late-night salivary cortisol levels had better clinical outcomes than those who only had normal mUFC (19). In LINC 4, although response rates fluctuated between time points, up to 48% achieved control of late-night salivary cortisol, and up to 45% of patients achieved control of both late-night salivary cortisol and mUFC. In an observational study of metyrapone in 31 patients with Cushing syndrome (n = 20 Cushing disease), 37% of patients had late-night salivary cortisol < ULN at their last visit (median treatment duration 9 months) (20). The phase III study of levoketoconazole in patients with Cushing syndrome reported normal late-night salivary cortisol levels in 4 patients (N = 94) after 6 months of treatment (14). Importantly, in LINC 4, dose-titration decisions were made based on patients achieving normal mUFC levels (and safety). It is possible that the proportion of patients achieving control of both mUFC and late-night salivary cortisol could be increased if normalization of both parameters is considered in dose-titration decisions.
Osilodrostat was generally well tolerated, and very few patients discontinued because of AEs. AEs related to hypocortisolism or increases in adrenal hormone precursors are expected based on the potent inhibition of 11β-hydroxylase by osilodrostat. The proportion of patients who experienced any AE potentially related to hypocortisolism was lower in this trial (27%) than in LINC 3 (51%) (10), possibly resulting from the slower dose-escalation schedule (every 3 vs 2 weeks). Hypocortisolism-related AEs mostly occurred during the dose-titration phase, were mostly grade 1 to 2, and were managed with dose interruption and/or glucocorticoid replacement. To mitigate potential events related to hypocortisolism, including adrenal insufficiency, osilodrostat dose increases should not occur more frequently than once every 1 to 2 weeks and should be guided by the results of cortisol assessments and by the individual clinical response. Additionally, upon initiation of osilodrostat (or any steroidogenesis inhibitor), patients should be educated on the expected effects of treatment and the symptoms associated with hypocortisolism, with advice to contact their healthcare provider if symptoms occur. AEs potentially related to accumulation of adrenal hormone precursors or subsequent increases in androgen or mineralocorticoid concentrations (eg, increased blood testosterone, hypertension, peripheral edema, acne, hirsutism, and hypokalemia) were also mostly grade 1 to 2 and managed without interrupting treatment. Similar proportions of patients in each arm (44% vs 36%) experienced these events during the 12-week, placebo-controlled period; as such, it is unclear what proportion of these events that occurred during osilodrostat treatment were a result of the active treatment or the underlying disease. The mechanism underlying the observation that the proportion of female patients with testosterone levels > ULN decreases during longer-term treatment is currently unknown but might be related to dose reductions over time or to changes in the metabolism of testosterone and its precursors during long-term osilodrostat exposure.
This trial had several strengths, including a randomized, placebo-controlled phase and a nearly year-long treatment duration for a rare disease. Other strengths included the strict entry criteria, which required a confirmed Cushing disease diagnosis in all enrolled patients, and robust treatment effect monitoring by a mean of ≥ 2 UFC samples at each time point. A potential limitation is that, although median duration of osilodrostat exposure was > 1 year, some adverse effects may take longer to be observed.
Conclusions
This randomized, placebo-controlled trial demonstrates that osilodrostat is a highly effective treatment for Cushing disease, normalizing UFC excretion in 77% of patients after 12 weeks’ treatment. Cortisol reductions were maintained throughout 48 weeks of treatment and were accompanied by improvements in clinical signs of hypercortisolism and quality of life. The safety profile was favorable.
Abbreviations
- ACTH
adrenocorticotrophin
- AE
adverse event
- BDI
Beck Depression Inventory
- CushingQoL
Cushing’s Disease Health-Related Quality of Life Questionnaire
- HbA1c
glycated hemoglobin A1c
- IQR
interquartile range
- MRI
magnetic resonance imaging
- mUFC
mean urinary free cortisol
- OR
odds ratio
- QoL
quality of life
- ULN
upper limit of normal
Acknowledgments
We thank all investigators, nurses, study coordinators, and patients who participated in the trial. We also thank Andrea Piacentini of Recordati SpA for statistical support. This study is/remains funded by Novartis Pharma AG; however, as of July 12, 2019, osilodrostat is an asset of Recordati. Financial support for medical editorial assistance was provided by Recordati. We thank Catherine Risebro, PhD, of Mudskipper Business Ltd for medical editorial assistance with this manuscript.
Author Contributions
The study steering committee (P.J.S., A.P.H., R.F., and R.J.A.), A.M.P., and the funder designed the study. A.H., M.G., M.B., A.G.J., P.W., Z.B., Y.Y., Z.L., C.H.C.K., D.C., and P.J.S. enrolled patients in the study. Data were collected by investigators of the LINC 4 Study Group using the funder’s data management systems. M.R. and the funder’s statistical team analyzed the data. A data-sharing and kick-off meeting was held with all authors and an outline prepared by a professional medical writer based on interpretation provided by the authors. Each new draft of the manuscript subsequently prepared by the medical writer was reviewed and revised in line with direction and feedback from all authors. All authors approved the final version of the manuscript and made the final decision to submit.
Role of Funding Source
The funder of the study (Novartis Pharma AG) contributed to study design, data collection, data analysis, data interpretation, and writing of the manuscript. The asset holder (Recordati) contributed to data interpretation, writing of the manuscript, and the decision to submit the report for publication. The services of professional medical writers, who provided editorial assistance in developing the outline and subsequent drafts of the manuscript, were funded by Recordati. All authors had full access to all the study data and were responsible for interpreting the data, writing the manuscript, and the decision to submit for publication.
Clinical Trial Registration
ClinicalTrials.gov, NCT02697734
Disclosure Summary
M.G. has received speaker fees from Novartis, Recordati, Ipsen, and Pfizer and attended advisory boards for Novartis, Novo Nordisk, Recordati, and Crinetics Pharmaceuticals. M.B. reports receiving travel grants from Novartis, Ipsen, and Pfizer and consultancy for Novartis. R.A.F. reports consultancy for HRA Pharma, Recordati, and Corcept Therapeutics. A.P.H. has received speaker fees from Chiasma and Ipsen and has been an advisor to Strongbridge Biopharma and Novo Nordisk. R.J.A. reports grants and personal fees from Strongbridge Biopharma, Spruce Biosciences, Neurocrine Biosciences, Corcept Therapeutics, and Novartis and personal fees from Adrenas Therapeutics, Janssen Pharmaceuticals, Quest Diagnostics, Crinetics Pharmaceuticals, PhaseBio Pharmaceuticals, H Lundbeck A/S, and Recordati Rare Diseases. A.G.J. reports receiving speaker fees from Novartis, Ipsen, Pfizer, Recordati, Novo Nordisk, and Lilly. P.W. reports receiving travel grants and speaker fees from Novartis, Ipsen, Recordati, Novo Nordisk, Strongbridge Biopharma, Merck Serono, Lilly, and Berlin Chemie. C.H.C.K. reports lecture fees from AstraZeneca, Sanofi, Novo Nordisk, Merck, Novartis, and Siegfried, consultancy fees from Novo Nordisk and Siegfried, and investigator honoraria from Novartis. D.C. reports speaker fees from Recordati. P.J.S. reports consultancy for Teva Pharmaceuticals. G.H., M.R., and J.W. are employees of Novartis. A.M.P. is an employee of Recordati AG. A.G.J, Z.B., Y.Y., and Z.L. have nothing to disclose.
Data Availability
The datasets generated and analyzed during the current study are not publicly available but are available from the corresponding author on reasonable request. Recordati Rare Diseases will share the complete de-identified patient dataset, study protocol, statistical analysis plan, and informed consent form upon request, effective immediately following publication, with no end date.
