


Abstract
It is still debated whether prolonged use of proton pump inhibitors (PPIs) might affect metabolic health.
To investigate the relationship between prolonged use of PPIs and the risk of developing diabetes.
We performed a case-control study nested into a cohort of 777 420 patients newly treated with PPIs between 2010 and 2015 in Lombardy, Italy. A total of 50 535 people diagnosed with diabetes until 2020 were matched with an equal number of controls that were randomly selected from the cohort members according to age, sex, and clinical status. Exposure to treatment with PPIs was assessed in case-control pairs based on time of therapy. A conditional logistic regression model was fitted to estimate the odds ratios and 95% CIs for the exposure-outcome association, after adjusting for several covariates. Sensitivity analyses were performed to evaluate the robustness of our findings.
Compared with patients who used PPIs for < 8 weeks, higher odds of diabetes of 19% (95% CI, 15-24), 43% (38-49), and 56% (49-64) were observed among those who used PPIs for between 8 weeks and 6 months, 6 months and 2 years, and > 2 years, respectively. The results were consistent when analyses were stratified according to age, sex, and clinical profile, with higher odds ratios being found in younger patients and those with worse clinical complexity. Sensitivity analyses revealed that the association was consistent and robust.
Regular and prolonged use of PPIs is associated with a higher risk of diabetes. Physicians should therefore avoid unnecessary prescription of this class of drugs, particularly for long-term use.
Proton pump inhibitors (PPIs) lead to long-lasting suppression of both basal and meal-stimulated acid secretion by irreversible inhibition of the H+/K+ ATPase (or proton pump) on gastric parietal cells (1). As a result of these pharmacological properties, they have become the first-choice therapy in patients with acid-related disorders such as gastroesophageal reflux disease, Barrett esophagus, and peptic ulcers and to prevent gastrointestinal bleeding while on nonsteroidal anti-inflammatory drugs (2). Because of their efficacy, the introduction of generic compounds and their use as over-the-counter medications in several states, the market for these drugs has progressively increased in the past 3 decades, placing them among the top 10 most commonly used medications worldwide (3).
In parallel, the expansion of the PPI market has seen increasing concerns regarding the misuse of these drugs in clinical practice (4), as well as the possible side effects (5). Several studies have identified various potential adverse reactions to their prolonged use including fractures, hypomagnesemia, gastric carcinoids, chronic kidney disease, dementia, and Clostridium difficile diarrhea (6-9). More recently, it became evident that PPIs can alter the normal bacterial milieu at the distal esophagus, stomach, small bowel, and colon (10). Importantly, changes in the gut microbiome have been postulated to play a role in the pathophysiology of metabolic diseases including obesity, insulin resistance (11), nonalcoholic fatty liver disease (12), and diabetes (13).
Nonetheless, clinical data on the association between PPI use and diabetes are limited. To our knowledge, no randomized clinical trial has been specifically designed to evaluate this possible link, but observational analyses performed in different ethnic groups showed conflicting results. Evidence on the topic has been recently summarized in a systematic review and meta-analysis including 3 cohort studies for a total of 244 439 participants. Although no significant association between PPI use and incident diabetes (pooled risk ratio, 1.10; 95% CI, 0.89-1.34; P = 0.385) was found, it should be stressed that a high degree of heterogeneity was identified (I2 = 93.5%), leading the authors to state that evidence was insufficient and inconsistent to make any definite conclusions (14).
The present study was therefore conceived to investigate the relationship between PPI use in terms of duration of and adherence to treatment and the risk of diabetes in the general population. To achieve these goals, we performed a large, nested case-control study in the real-world setting of the Italian Lombardy region.
Materials and methods
Setting
The data used in the present study were retrieved from the Healthcare Utilization Databases of Lombardy, a region that accounts for almost 16% of Italy’s population (with > 10 million residents). In Italy, all citizens have equal access to health care provided by the National Health Service (NHS). An automated system of databases is used to manage health services in each Italian region. Healthcare Utilization Databases include a variety of information on residents, such as diagnosis at discharge from public or private hospitals, outpatient drug prescriptions, copayment exception for diagnosed chronic disease (including diabetes), and specialist visits and diagnostic examinations provided fully or partly free of charge by the NHS. These various types of data can be interconnected because a unique individual identification code is used by all databases for each NHS beneficiary. To preserve privacy, each identification code is automatically anonymized, and the inverse process is only allowed to the regional authority upon request of judicial authorities. Further details on Healthcare Utilization Databases in pharmacoepidemiological studies are available in previous studies (15, 16).
Cohort Selection and Follow-up
The target population included residents of Lombardy aged ≥ 40 years who were beneficiaries of the NHS. Of these, those who received at least 2 consecutive prescriptions of PPIs (ie, not more than 6 months apart) between 2010 and 2015 were identified, and the date of the second prescription recorded during this period was defined as the index date. The present analysis was deemed exempt by the review board at our institution, as the dataset used in the analysis was completely deidentified.
Exclusion criteria were as follows: patients who, within the 5 years before the index date (1) were not beneficiaries of the NHS; (2) received at least 1 PPI drug prescription; (3) received at least 1 prescription of histamine H2 receptor antagonist; and (5) had shown signs of presence of diabetes (ie, diagnosis of diabetes, exemption for diabetes, and/or at least 1 antidiabetic drug prescription).
The remaining patients were included into the cohort whose members accumulated person-years of follow-up from the index date until the earliest date among the onset of diabetes (see the following section), death, emigration, or August 31, 2020.
Selection of Cases and Controls
When the effect of time-dependent exposure on rare events is investigated by means of large health care databases, the case-control study design is a useful alternative to the cohort design, achieving similar results with superior computational efficiency (17).
A case-control study was nested into the cohort of PPI drug users. The outcome of interest was the diagnosis of diabetes, whose date of onset was defined as the date corresponding to the first event among (1) hospitalization with diagnosis of diabetes, (2) prescription of antidiabetic drug, or (3) activation of the copayment exception for diabetes. Cases were cohort members who experienced the event during the follow-up. For each patient, 1 control was randomly selected from among the cohort members to be matched for sex, age, and clinical status. Controls had to be at risk of the outcome when the matched case was taken in charge for diabetes.
Exposure to PPI Treatment
Exposure to PPI treatment was assessed on case-control pairs in terms of time of therapy. For each patient, all PPI drugs prescribed during the follow-up were identified. The period covered by an individual prescription was calculated by means of the defined daily dose metrics. For overlapping prescriptions, the patient was assumed to have taken all drugs contained in the first prescription before starting the second one. The use of the drug has been classified in 4 categories: < 8 weeks, 8 weeks to 6 months, 6 months to 2 years, and > 2 years.
Covariates
Baseline characteristics measured at index date included sex, age, clinical status, comorbidities (previous hospitalization for cardiovascular disease, cancer, depression, and respiratory and kidney diseases), and cotreatments for hypertension and dyslipidemia and use of anticoagulation and antiplatelet drugs, nonsteroidal anti-inflammatory drugs, digitalis, nitrates, antidepressants, and drugs for pulmonary diseases. In addition, the class of PPI with which each subject began the therapy was considered (ie, omeprazole, pantoprazole, lansoprazole, rabeprazole, and esomeprazole) and any combination of them.
Assessing Clinical Status
For each cohort member, clinical status was assessed by the Multisource Comorbidity Score (MCS) (ie, a prognostic index based on 34 morbidities), which has been shown to predict mortality better than the Charlson, Elixhauser, and Chronic Disease Scores in the Italian population (18, 19). A weight proportional to its strength in predicting mortality was assigned to each condition, and the index was generated as the sum of the conditions’ weights suffered by the patient. The International Classification of Diseases, ninth revision, clinical modification, and anatomical therapeutic chemical (ATC) codes of diseases and conditions were included in the MCS, and corresponding weights were chosen as reported in a previous manuscript (18). The score was then categorized to identify the following groups of clinical status: good (MCS = 0), intermediate (1 ≤ MCS ≤ 4), poor (5 ≤ MCS ≤ 14), and very poor (MCS ≥ 15).
Data Analysis
Standardized mean differences for binary covariates were used when appropriate to test between-group differences. Clinical equipoise was considered reached when the between-group comparison of covariates had a mean standardized difference of < 0.1 (20).
Conditional logistic regression models were fitted to estimate the odds ratio (OR) and its 95% CI of the risk of diabetes onset in relation to drug-use categories, using the lowest category (<8 weeks) as reference. Adjustments were made for the previously reported covariates. The statistical significance of the trend in increased risk of diabetes with increased therapy duration and of the homogeneity between these trends in the different sex, age, and clinical profiles was tested.
All estimates were obtained by stratifying the cohort members according to sex, age, and categories of clinical status.
Sensitivity Analyses
To verify the robustness of the main findings, 5 sensitivity analyses were performed. First, analyses were repeated by modifying the definition of exposure to PPI therapy. It was measured by the cumulative number of days during which the drug was available divided by the days of the follow-up; the ratio expressed the proportion of days covered by treatment (21). Adherence to PPI therapy was classified in 4 categories: very low (proportion of days covered < 25%), low (25%-50%), intermediate (51%-75%), and high (> 75%). Second, to investigate the possible presence of detection bias (ie, that the long-term use of PPI implies a more regular use of care services, making diabetes detection easier (22)), the following analyses were carried out. A stratified analysis accounting for the total number of services provided by the NHS in the previous 5 years was conducted. For each subject of the cohort, the number of NHS services was categorized into 4 classes: low (< 90 contacts), intermediate (90-160), high (161-240), and very high (> 240). In addition, the association between long-term use of PPIs and a “negative outcome,” per the knowledge accumulated so far, it is not expected to be associated with the exposure of interest, was studied. With this aim, the onset of malignant melanoma was considered as the outcome. Given that the long-term use of PPI is unlikely to be associated with malignant melanoma, we did not expect any association between drug therapy and the risk of the considered outcome. Fourth, to further investigate the robustness of the findings in respect to the possible confounding effect of statin use (given the well-known diabetogenic harm of this drug therapy (16)), a stratified analysis was carried out into the following three strata: nonusers, users of low potency, and users of high-potency statins.
Finally, because administrative databases suffer from lack of important clinical information, the potential bias associated with unmeasured confounders was investigated by the rule-out approach (23), which allows for detection of the extension of overall confounding required to fully account for the exposure–outcome association. We set the possible generic unmeasured confounder (1) to have a 20% prevalence in the study population, (2) to increase the risk of diabetes up to 10-fold in those exposed than in those unexposed to the confounder, and (3) to be up to 10-fold more common in patients exposed to prolonged PPI treatment (> 2 years) than in those with shorter duration of drug therapy (< 8 weeks). The Statistical Analysis System Software (version 9.4; SAS Institute, Cary, NC, USA) was used for all analyses.
Results
Patients
Of the 1 903 379 patients older than age 40 years receiving treatment with PPI drugs during 2010 through 2015, 777 420 met the inclusion criteria (Fig. 1). The cohort subjects accumulated 4 783 445 person-years of observation (mean, 6.2 years per patient) and generated 50 540 diagnoses of diabetes, with an incidence rate of 10.6 cases per 1000 person-years.
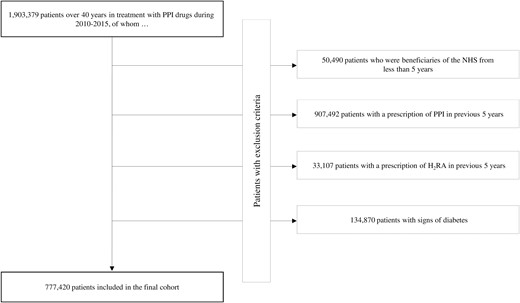
Flowchart of inclusion and exclusion criteria.
Among the 50 540 patients diagnosed with diabetes during the follow-up, 50 535 were matched with a control patient. Table 1 shows the characteristics of cases and controls. Approximately 50% of patients were men, and the average age was 66 years. The most prescribed PPI classes were pantoprazole and omeprazole. Cases and controls showed similar baseline characteristics, except for the use of antihypertensive and lipid-lowering drugs, which was greater among cases. During follow-up, cases spent more time with PPIs than controls.
Characteristics of the case patients and of the corresponding controls included into the study
| Cases (N = 50 535) | Controls (N = 50 535) | Standardized differences | |
|---|---|---|---|
| Men (%) | 26,580(52.6) | 26,580(52.6) | MV |
| Age, mean (SD), y | 66.2 (11.7) | 66.2 (11.7) | MV |
| Clinical profile (%)a | MV | ||
| Good | 9,420 (18.6) | 9420 (18.6) | |
| Intermediate | 20 245 (40.1) | 20 245 (40.1) | |
| Poor | 15 730 (31.1) | 15 730 (31.1) | |
| Very poor | 5140 (10.2) | 5,140 (10.2) | |
| PPI class (%) | 0.052 | ||
| Omeprazole | 11 669 (23.1) | 12 268 (24.3) | |
| Pantoprazole | 15.040 (29.8) | 14 264 (28.2) | |
| Lansoprazole | 7706 (15.3) | 7508 (14.9) | |
| Rabeprazole | 1525 (3.0) | 1541 (3.1) | |
| Esomeprazole | 5698 (11.3) | 6035 (11.9) | |
| Combinations | 8897 (17.6) | 8919 (17.7) | |
| Other drugs (%) | |||
| Antihypertensive agents | 37.105 (73.4) | 31 713 (62.8) | 0.230 |
| Lipid-lowering drugs | 18 120 (35.9) | 14 831 (29.4) | 0.139 |
| Anticoagulant agents | 3784 (7.5) | 3788 (7.5) | 0.000 |
| Antiplatelet agents | 19 879 (39.3) | 17 657 (34.9) | 0.091 |
| NSAIDs | 30 727 (60.8) | 28 826 (57.0) | 0.077 |
| Digitalis | 1311 (2.6) | 1116 (2.2) | 0.025 |
| Nitrates | 3999 (7.9) | 3546 (7.0) | 0.034 |
| Antidepressant agents | 9688 (19.2) | 9365 (19.5) | 0.016 |
| Drugs for respiratory disease | 20.198 (40.0) | 19 243 (38.1) | 0.039 |
| Previous hospitalizations (%) | |||
| Stroke | 2173 (4.3) | 2256 (4.5) | 0.008 |
| Heart failure | 2285 (4.5) | 1851 (3.7) | 0.043 |
| Myocardial infarction | 2858 (5.7) | 2339 (4.6) | 0.047 |
| Kidney disease | 1075 (2.13) | 1010 (2.0) | 0.009 |
| Respiratory disease | 4547 (9.0) | 3777 (7.5) | 0.055 |
| Depression | 574 (1.1) | 496 (1.0) | 0.015 |
| Cancer | 7699 (15.2) | 7377 (14.6) | 0.018 |
| Time of PPI therapy (%) | 0.160 | ||
| 12.879 (25.5) | 15 554 (30.8) | ||
| 8 wk-6 mo | 12 476 (24.7) | 13 233 (26.2) | |
| 6 mo-2 y | 15 159 (30.0) | 13 448 (26.6) | |
| > 2 y | 10 021 (19.8) | 8300 (16.4) |
Abbreviations: MV, matching variable; NSAID, nonsteroidal anti-inflammatory drug; PPI, proton pump inhibitor.
aFour categories were considered for the clinical profile according to the Multisource Comorbidity Score (MCS): good (MCS = 0), intermediate (1 ≤ MCS ≤ 4), poor (5 ≤ MCS ≤ 14), and very poor (MCS ≥ 15).
Use of PPI and the Onset of Diabetes
Adjusted estimates of ORs for the risk of diabetes onset, related to time in therapy with PPI, are reported in Table 2. There was a trend of increased risk with increased PPI therapy duration. Compared with patients who used PPIs for < 8 weeks, an increased risk of 19% (95% CI, 15-24), 43% (38-49), and 56% (49-64) was observed among those who used PPI between 8 weeks and 6 months, 6 months and 2 years, and > 2 years, respectively.
OR and 95% CI for diabetes associated with the use of PPIs and other baseline characteristics
| OR | 95% CI | |
|---|---|---|
| Time of therapy with PPI | ||
| <8 wk | 1.00 | Ref. |
| 8 wk-6 mo | 1.19 | 1.15-1.24 |
| 6 mo-2 y | 1.43 | 1.38-1.49 |
| >2 y | 1.56 | 1.49-1.64 |
| P trend | <.001 | |
| Use of other drugs | ||
| Antihypertensive | 1.68 | 1.63-1.73 |
| Lipid-lowering drugs | 1.23 | 1.19-1.27 |
| Anticoagulant agents | 0.86 | 0.81-0.91 |
| Antiplatelet agents | 1.01 | 0.97-1.04 |
| NSAIDs | 1.18 | 1.15-1-21 |
| Digitalis | 1.21 | 1.11-1.33 |
| Nitrates | 0.99 | 0.94-1.04 |
| Antidepressant agents | 1.01 | 0.98-1.05 |
| Drugs for respiratory disease | 1.06 | 1.06-1.12 |
| Previous hospitalizations | ||
| Stroke Heart failure | 0.89 1.13 | 0.83-0.95 1.05-1.21 |
| Myocardial infarction | 0.88 | 0.80-0.98 |
| Kidney disease | 1.08 | 0.95-1.22 |
| Respiratory disease | 1.19 | 1.11-1.27 |
| Cancer | 1.15 | 1.07-1.23 |
| Depression | 1.08 | 0.91-1.28 |
| PPI class | ||
| Omeprazole | 1.00 | Ref. |
| Pantoprazole | 1.03 | 1.00-1.07 |
| Lansoprazole | 1.04 | 0.99-1.08 |
| Rabeprazole | 0.98 | 0.91-1.06 |
| Esomeprazole | 0.97 | 0.92-1.01 |
| Combinations | 1.04 | 1.00-1.08 |
Reported OR and 95% CI are adjusted for all variables included in the table. Cases and controls were matched for sex, age, and clinical status.
Abbreviations: NSAIDs, nonsteroidal anti-inflammatory drugs; OR, odds ratio; PPI, proton pump inhibitor.
The results of stratified analyses are shown in Table 3. The trend of increased risk of diabetes with increased PPI therapy duration was observed regardless of age, sex, and clinical profile. A stronger association between time spent in therapy and diabetes was highlighted among younger patients (40-65 years) and those with worse clinical complexity.
OR and 95% CI for diabetes associated with the time of therapy with PPIs according to age, sex, and clinical profile
| Strata | Time of therapy with PPI | P trend | P homogeneity | |||
|---|---|---|---|---|---|---|
| <8 wk | 8 wk-6 mo | 6 mo-2 y | > 2 y | |||
| Age | <.001 | |||||
| 40-65 y | 1.00 (Ref.) | 1.19 (1.13-1.26) | 1.50 (1.42-1.59) | 1.74 (1.62-1.86) | <0.001 | |
| 66-75 y | 1.00 (Ref.) | 1.17 (1.09-1.25) | 1.28 (1.20-1.38) | 1.35 (1.24-1.46) | <0.001 | |
| >75 y | 1.00 (Ref.) | 1.21 (1.11-1.31) | 1.45 (1.34-1.58) | 1.48 (1.34-1.64) | <0.001 | |
| Sex | 0.141 | |||||
| Men | 1.00 (Ref.) | 1.18 (1.12-1.25) | 1.45 (1.37-1.53) | 1.50 (1.41-1.60) | <0.001 | |
| Women | 1.00 (Ref.) | 1.20 (1.14-1.27) | 1.42 (1.34-1.50) | 1.64 (1.53-1.75) | <0.001 | |
| Clinical profilea | <0.001 | |||||
| Good | 1.00 (Ref.) | 1.15 (1.06-1.24) | 1.33 (1.22-1.45) | 1.54 (1.39-1.71) | <0.001 | |
| Intermediate | 1.00 (Ref.) | 1.14 (1.07-1.20) | 1.32 (1.25-1.40) | 1.40 (1.30-1.50) | <0.001 | |
| Poor | 1.00 (Ref.) | 1.27 (1.18-1.37) | 1.51 (1.40-1.62) | 1.65 (1.52-1.80) | <0.001 | |
| Very poor | 1.00 (Ref.) | 1.37 (1.21- 1.55) | 2.12 (1.86-2.42) | 2.47 (2.08-2.93) | <0.001 |
Abbreviations: OR, odds ratio; PPI, proton pump inhibitor.
aFour categories were considered for the clinical profile according to the Multisource Comorbidity Score (MCS): good (MCS = 0), intermediate (1 ≤ MCS ≤ 4), poor (5 ≤ MCS ≤ 14), and very poor (MCS ≥ 15).
Sensitivity Analyses
The results of the sensitivity analyses are reported in Table 4. The main findings did not change substantially by modifying the definition of exposure (ie, treatment adherence), by stratifying for the number of contacts with the NHS, and by stratifying for statin use. In addition, no association has been observed between the use of PPI and the onset of malignant melanoma.
OR and 95% CI for diabetes associated with the use of PPIs according to 3 sensitivity analyses
| Sensitivity analysis | Time of therapy with PPI | OR (95% CI) |
|---|---|---|
| Adherencez | ||
| PDC: ≤ 25% | 1.00 (Ref.) | |
| PDC: 26-50% | 1.27 (1.22-1.31) | |
| PDC: 51-75% PDC: > 75% | 1.38 (1.33-1.44) 1.50 (1.44-1.56) | |
| Number of contacts with the National Health Service | ||
| Very low | <8 wk | 1.00 (Ref.) |
| 8 wk-6 mo | 1.26 (1.13-1.41) | |
| 6 mo-2 y | 1.56 (1.39-1.76) | |
| >2 y | 1.89 (1.63-2.20) | |
| Low | <8 wk | 1.00 (Ref.) |
| 8 wk-6 mo | 1.16 (1.02-1.33) | |
| 6 mo-2 y | 1.24 (1.09-1.42) | |
| >2 y | 1.45 (1.23-1.70) | |
| Intermediate | <8 wk | 1.00 (Ref.) |
| 8 wk-6 mo | 1.04 (0.88-1.23) | |
| 6 mo-2 y | 1.35 (1.15-1.60) | |
| >2 y | 1.53 (1.26-1.87) | |
| High | <8 wk | 1.00 (Ref.) |
| 8 wk-6 mo | 1.15 (1.01-1.33) | |
| 6 mo-2 y | 1.42 (1.23-1.64) | |
| >2 y | 1.41 (1.20-1.66) | |
| Use of statins | ||
| No use | <8 wk | 1.00 (Ref.) |
| 8 wk-6 mo | 1.20 (1.15-1.25) | |
| 6 mo-2 y | 1.47 (1.41-1.54) | |
| >2 y | 1.68 (1.59-1.78) | |
| Low potency | <8 wk | 1.00 (Ref.) |
| 8 wk-6 mo | 1.17 (1.04-1.31) | |
| 6 mo-2 y | 1.21 (1.08-1.35) | |
| >2 y | 1.32 (1.16-1.50) | |
| High potency | <8 wk | 1.00 (Ref.) |
| 8 wk-6 mo | 1.18 (1.07-1.30) | |
| 6 mo-2 y | 1.47 (1.33-1.61) | |
| >2 y | 1.52 (1.37-1.69) | |
| Melanoma as outcome | ||
| <8 wk | 1.00 (Ref.) | |
| 8 wk-6 mo | 1.05 (0.85-1.31) | |
| 6 mo-2 y | 1.15 (0.93-1.43) | |
| >2 y | 1.08 (0.83-1.39) |
Abbreviations: OR, odds ratio; PDC, proportion of days covered; PPI, proton pump inhibitor.
aAdherence to treatment was measured by the ratio between the days with available PPI prescriptions and all days of follow-up. Adherence categories are: very low: ≤ 25%; low: 26%-50%; intermediate: 515-75%; and high: > 75%.
The results of the residual confounding analysis are shown in Fig. 2. Assuming that patients who were prescribed with PPI for > 2 years had a 6-fold higher odds of exposure to the confounder than those who used PPI for < 8 weeks, the analysis shows that confounding should increase the outcome risk by 3-fold to account for the effect of long-term PPI use and diabetes onset. Stronger confounder–outcome associations are required for scenarios in which the confounder is more balanced between drug-use groups (eg, ORconfounder-exposure = 4 and relative riskconfounder-outcome = 4).
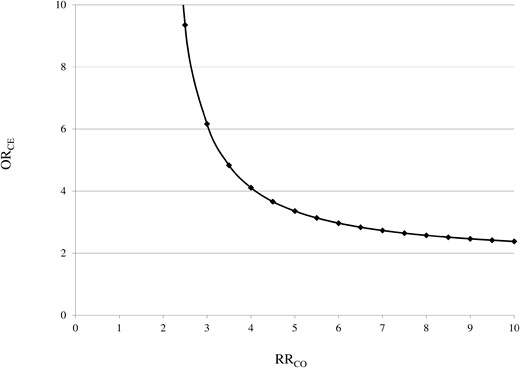
Influence of a possible unmeasured confounder on the relationship between the use of PPI (exposure) and diabetes (outcome). The graphs indicate the RRCO–ORCE combinations (ie, the confounder–outcome and the confounder–exposure associations) that would be required to move the observed effect of long-term use of PPI on diabetes onset towards the null. For example, we might consider overweight/obesity as the confounder because it is associated with both the outcome (the risk of diabetes is higher among overweight/obese patients) and the exposure (because, for example, an increased body mass index is associated with a higher risk of gastroesophageal reflux disease). The figure shows that, even if patients exposed to the confounder (ie, overweight/obese patients) had a risk of diabetes 4-fold that of those not exposed (normal weight patients), they should be at least 4 times more frequently among the exposed (ie, long-term PPI users should be overweight/obese with a frequency 4-fold higher than that of patients who used PPI for < 8 weeks) to nullify the observed association.
Discussion
In the present study, based on approximately 50 000 cases and an equal number of controls from the general Italian population, we showed that prolonged use of PPIs is associated with an increased risk of diabetes after adjustment for several potential confounders. The risk was progressively higher with longer time spent in therapy, being 19%, 43%, and 56% higher in patients taking PPIs for 8 weeks to 6 months, 6 months to 2 years, and for > 2 years, respectively, compared with a treatment duration of < 8 weeks. Results were consistent when analyses were stratified according to age, sex, and clinical profile, with the ORs being higher among younger patients and those with worse clinical complexity.
Our results align with a recent analysis conducted using data from 3 prospective cohort studies performed in health care workers in the United States (24). The authors reported a 24% increased risk of developing diabetes in PPI users compared with nonusers and a progressively increasing risk with longer treatment duration. Our data complement the previously mentioned analysis in 2 ways. First, we focused on a nonselected sample of incident PPI users from the general population, rather than health care workers, increasing the generalizability of our results. Second, we showed that not only longer duration but also higher adherence to treatment is associated with higher risk. Given that the risk associated with the use of specific PPI molecules was similar, our results support the hypothesis that the observed higher risk of diabetes is a class effect.
Nonetheless, epidemiological evidence on the topic remains conflicting. In the previously mentioned meta-analysis, heterogeneity was mainly due to the results of a study performed in 388 098 patients with upper gastrointestinal disease from Taiwan, which showed a 20% decreased risk of diabetes in PPI users over a median period of 5 years (25). Although the reasons for these conflicting results are difficult to explain, it is worth mentioning that the study population comprised patients with a specific indication for PPIs, was only matched for age and sex, and the analyses were not performed according to treatment duration among users, thereby preventing direct comparison with our results. Moreover, available studies differ in ethnic background (Asian vs Caucasian participants), proportion of females, methods for diagnosing diabetes (American Diabetes Association criteria vs International Classification of Diseases codes), duration of follow-up, and assessment of PPI use (prescription records vs questionnaires).
Interestingly, evidence is also conflicting on the role of PPIs on glycemic control in patients with existing diabetes. Data are available from several open-label randomized controlled trials of limited sample size (< 100 patients). The previously mentioned meta-analysis identified a high degree of heterogeneity across the studies (I2 = 93.3%), with an overall small reduction in glycated hemoglobin and fasting plasma glucose in patients treated with PPIs. Nonetheless, the duration of these studies was only 12 weeks, and long-term effects are not known (14).
The potential mechanisms linking PPI use and diabetes have not been conclusively defined. There is accumulating evidence on the potential role of the microbiota mediating this relationship. In a study including 1815 individuals (211 PPI users), the gut microbiome composition was assessed by sequencing of the 16S ribosomal RNA gene. The authors showed that multiple oral bacteria were overrepresented in the fecal microbiome of PPI users, together with a significant increase in the Enterococcus, Streptococcus, and Staphylococcus genera and the bacterium Escherichia coli (26). These changes are associated with less efficient caloric extraction from the diet, intestinal epithelial damage, and greater entry of bacterial components into the portal circulation (27, 28). These alterations may result in liver insulin resistance, inflammation (nonalcoholic steatohepatitis), and fibrosis and are frequent findings in patients with diabetes (29). Other potential mechanisms linking PPI use to diabetes have been hypothesized, including PPI-induced hypomagnesemia (leading to low-grade inflammation and insulin resistance), reduction in IGF-1, and pregnane X receptor activation, which is involved in the regulation of hepatic glucose metabolism (30).
The present study has several strengths. First, because in Italy the cost-free health care system (NHS) involves virtually all citizens, our analyses were performed on a very large, unselected population. This aspect provides both a high degree of generalizability of obtained results and high statistical power to conduct subgroup analyses. Second, the drug prescription database provided highly accurate data because pharmacists are required to report prescriptions in detail to obtain reimbursement, and incorrect reports about the dispensed drugs have legal consequences (31). Third, our findings were confirmed in several subgroup and sensitivity analyses, underlying their robustness.
Our study also has some limitations. First, our database did not record drugs prescribed outside the NHS (ie, over-the-counter medications), but it is unlikely that a significant number of patients used PPIs for long periods without them being covered by the NHS. In addition, information on drug use is limited to prescriptions, and actual drug consumption by patients could not be assessed. Therefore, the actual association between the use of PPIs and diabetes might be understated given this source of exposure misclassification. Second, we do not have data on diabetes subtype. Although it is possible that patients with type 1 diabetes were included in the present analysis, they are likely to represent a small minority, given that only patients with disease onset at age ≥ 40 years. Third, because this is not a randomized controlled trial, our results may be affected by unmeasured confounders. That is, the observed association between time spent on PPIs and risk of diabetes might have been generated by patients’ features such as body mass index, family history of diabetes, baseline glycated hemoglobin levels, and, in general, by features that are not covered in our health care utilization data source. Although residual confounding cannot be excluded, it should be noted that (according to our analyses) to completely account for the studied association, confounders should not only be several times more common in the group being treated with PPIs for > 2 years compared with patients receiving treatment for a shorter time frame but also increase the risk of diabetes many-fold. Future studies are still needed to validate our findings.
In conclusion, the present large, population-based, nested case-control study suggests that prolonged treatment with PPIs is associated with a higher risk of developing diabetes, particularly in younger individuals and in patients with greater clinical complexity than other patient populations. If confirmed, these findings may have important implications for both public health and clinical practice, given the high number of patients being treated with PPIs and the influence of diabetes on morbidity and mortality related to its possible micro- and macrovascular complications.
Abbreviations
- MCS
Multisource Comorbidity Score
- NHS
National Health Service
- OR
odds ratio
- PPI
proton pump inhibitor
Acknowledgments
None.
Funding
This study was funded by a grant from the Italian Ministry of the Education, University and Research: “Modelling effectiveness, cost-effectiveness and promoting health care value in the real world. The Motive project” (grant number H45J17000500006). The funding source had no role in the design of the study, the collection, analysis and interpretation of the data, or the decision to approve publication of the finished manuscript.
Author Contributions
S.C. designed the study, wrote, reviewed, and edited the manuscript. F.R., L.S., and G.M. performed data analysis and participated in writing and editing the manuscript. G.P. and G.C. wrote and edited the manuscript. All authors approved the final version of the manuscript to be published. S.C. is the guarantor of this work.
Disclosures
The authors declare the following financial interests/personal relationships, which may be considered as potential competing interests: G.C. received research support from the European Community (EC), the Italian Agency of Drug (AIFA), and the Italian Ministry of Education, University and Research (MIUR). He took part to a variety of projects that were funded by pharmaceutical companies (i.e., Novartis, GSK, Roche, AMGEN, and BMS). He also received honoraria as member of Advisory Board from Roche. The other authors declare no conflicts of interest to disclose.
Data Availability
Restrictions apply to the availability of some or all data generated or analyzed during this study to preserve patient confidentiality or because they were used under license. The corresponding author will on request detail the restrictions and any conditions under which access to some data may be provided.
References
Author notes
These authors contributed equally to this work and served as co-first authors.
These authors also contributed equally to this work and served as co-lead authors.
