


Abstract
Sleep quality has been related to the risk of diabetes; however, little is known about the prevalence of diabetes in the United States according to the levels of sleep quality.
To examine the joint secular trends of the overall sleep quality and diabetes among US adults from 2005-2006 to 2017-2018.
Seven cycles of cross-sectional National Health and Nutrition Examination Survey (NHANES) data between 2005-2006 and 2017-2018 were included. Nonpregnant adults aged 20 years or older were eligible for the study. A healthy sleep score was calculated to represent overall sleep quality. The prevalence of diabetes was estimated and mean levels of fasting plasma glucose (FPG), glycated hemoglobin, and insulin resistance were calculated.
Both the estimated age-standardized prevalence of diabetes and changing trend in prevalence of diabetes varied by the overall sleep quality groups. The highest prevalence of diabetes was consistently observed in the low sleep quality group in each cycle, in which a significantly increasing trend was also noted across cycles (P for trend = .004). In contrast, the lowest prevalence of diabetes was consistently observed in the high sleep quality group in each cycle, in which no increasing trend over time was observed (P for trend = .346).
Overall sleep quality decreased significantly between 2005-2006 and 2017-2018 among US adults. The estimated prevalence of diabetes and related measures only increased in participants with low or medium overall sleep quality but remained stable in participants with high sleep quality.
Diabetes is a major cause of morbidity and mortality (1). In the United States, the total estimated cost of diabetes was $327 billion in 2017 due to increased health resource use and lost productivity (2). Controlling modifiable lifestyle risk factors, including diet, physical activity, body weight, and smoking, has been recognized as an effective way to prevent diabetes (3, 4). Notably, over the last 2 decades, although the adherence rate to the physical activity guidelines for aerobic activity has not changed (5), smoking rate and diet quality have significantly improved in US adults (6-8). However, 2 recent studies found that the estimated prevalence of diabetes in the United States has continued to increase significantly during this period (9, 10). These findings suggest some other factors may also play a crucial role in driving the increase of diabetes.
Accumulating evidence has associated various unhealthy sleep behaviors, such as short or long sleep duration (11-13), trouble sleeping (12, 13), snoring (14, 15), and excessive daytime sleepiness (16, 17), with a higher risk of diabetes. Of note, these sleep behaviors usually coexist and interact with each other in a compensatory manner. Our previous studies indicate that an overall sleep pattern may better capture the relation between sleep habits and health outcomes, such as diabetes, cardiovascular disease, and mortality, than individual sleep behaviors (18-21). Prior studies showed that the prevalence of several unhealthy sleep behaviors, such as insomnia and excessive daytime sleepiness, increased between 1980 and 2012 in the United States (22-24). However, little is known on the trends in sleep behaviors, especially overall sleep quality, after 2012. Moreover, no study has assessed the secular trend of diabetes combined with sleep quality.
Therefore, in this study, using the nationally representative survey data from the US National Health and Nutrition Examination Survey (NHANES), we report the long-term trend in overall sleep quality and the joint trends of the estimated prevalence of diabetes with overall sleep quality among US adults from 2005-2006 to 2017-2018.
Materials and Methods
Study Population
NHANES is a series of cross-sectional surveys conducted in nationally representative samples of the noninstitutionalized civilian US population using a complex, stratified, multistage probability design. The survey data have been released in 2-year cycles since 1999, including data collected from a household interview and a physical examination at a mobile examination center. Details on the study design, protocol, and data collection methods are described elsewhere (25). The unweighted response rates ranged from 52% to 80% for the interview and 49% to 77% for the examination (26). The survey protocol was approved by the Institutional Review Board of the Centers for Disease Control and Prevention, and all participants provided written informed consent.
This study used data from 7 cycles of NHANES (2005-2006 to 2017-2018). Nonpregnant participants 20 years and older who completed the sleep-related questionnaire on interview were eligible for the study. Participants who visited the mobile examination center were measured for glycated hemoglobin (HbA1c). Among them, participants who were randomly selected to participant in a morning examination session were measured for fasting plasma glucose (FPG) and insulin levels after fasting for 8 to 24 hours. The homeostatic model assessment for insulin resistance (HOMA-IR) was calculated as fasting plasma insulin (μU/mL) × FPG (mmol/L) ÷ 22.5 (27). The sample was reweighted to account for participants who randomly did not attend the morning examination session for measurement of FPG and insulin. To enable nationally representative estimation, interview sampling weights were used for participants who were diagnosed with diabetes, and FPG sampling weights were used for participants without diagnosed diabetes.
Assessment of Sleep Behaviors
Sleep-related behaviors were self-reported during the household interview. Sleep duration was recorded as number of hours by asking “How much sleep do you usually get at night on weekdays or workdays?” Consistent with previous studies, we categorized sleep duration as short (<7 hours/day), normal (7-8 hours/day), and long (≥9 hours/day) (18-21). Trouble sleeping was assessed based on the question “Have you ever told a doctor or other health professional that you have trouble sleeping?” with response of (1) yes or (2) no. Information on snoring was collected by asking “In the past 12 months, how often did you snore while you were sleeping?” with responses of (1) never, (2) rarely, (3) occasionally, and (4) frequently. Daytime sleepiness was coded using the following question “In the past month, how often did you feel excessively or overly sleepy during the day?” with responses of (1) never, (2) rarely, (3) sometimes, (4) often, and (5) almost always. Nocturia was obtained from the responses to the question “During the past 30 days, how many times per night did you most typically get up to urinate, from the time you went to bed at night until the time you got up in the morning?”
Definition of a Healthy Sleep Score and Sleep Quality
A healthy sleep score was constructed based on 5 sleep factors (sleep duration, trouble sleeping, snoring, daytime sleepiness, and nocturia). Low-risk sleep factors were defined as follows: sleep 7 to 8 hours per day; no trouble sleeping reported; never snoring; no excessive daytime sleepiness (never, rarely, or sometimes); and no nocturia (urinating ≤1 times per night). For each individual sleep factor, participants with low-risk behaviors were coded as 1, and those with high-risk behaviors were coded as 0. The healthy sleep score was calculated by summing individual scores of 5 sleep factors, with a range of 0 to 5. Higher scores indicated healthier sleep pattern. We further classified the overall sleep quality as “high sleep quality” (the highest tertile: healthy sleep score ≥4), “medium sleep quality” (healthy sleep score = 3), and “low sleep quality” (the lowest tertile: healthy sleep score ≤2) based on the healthy sleep score.
Definition of Diabetes
Diabetes was defined as participants who self-reported at the interview as having been diagnosed with diabetes by a “doctor or health professional,” or participants who were measured at the mobile examination center as having a FPG levels of 126 mg/dL or greater or a HbA1c levels of 6.5% or greater.
Other Variables
Demographic characteristics, including age, sex, and race/ethnicity, were collected using a standardized questionnaire. Race and ethnicity were self-reported based on fixed category questions. NHANES oversampled Mexican American persons prior to 2007 and oversampled all Hispanic persons from 2007 onward (28). For combined datasets using survey cycles before and after 2007, the National Center for Health Statistics does not recommend calculating estimates for all Hispanics in cycles prior to 2007, or for Hispanic subgroups other than Mexican American in any cycle through 2018 (28, 29). In the present study, we categorized race and ethnicity into non-Hispanic White, non-Hispanic Black, Mexican American, and others (includes other Hispanic and non-Hispanic races, including multiracial). Weight was measured at standing position in kilograms with a digital weight scale. Standing height was measured using a fixed stadiometer. Body mass index (BMI) was calculated as weight in kilograms divided by height in meters squared. Information on smoking and physical activity were obtained from specifically designed questionnaires. Smoking was classified into never, former, and current smoking. Physical activity was evaluated by calculating the metabolic equivalent scores of recreational activities per week. A 24-hour dietary recall questionnaire was used to investigate the type and amount of alcohol and food intake. Alcohol consumption was recorded in grams per day. The Alternate Healthy Eating Index (AHEI) was calculated based on 9 food components (vegetables, fruit, whole grains, nuts and legumes, sugar-sweetened beverages, red and processed meat, polyunsaturated fatty acids, long-chain omega-3 fats, sodium), with a range of 0 to 90.
Statistical Analysis
To perform a nationally representative estimate, survey analysis procedures and linear regression models were used to account for the complex sampling design according to NHANES analytic guidelines (30). All analysis were age standardized using age groups and weight (20-39 years, weight, 0.3966; 40-59 years, weight, 0.3718; and ≥60 years, weight, 0.2316) of 2000 of the US population as the standard, and considering survey cycle as a nominal variable, as recommended by the Centers for Disease Control and Prevention (30).
To test trends over time, we first investigated the age-standardized prevalence and 95% CI of individual healthy sleep behaviors and each overall sleep quality group, as well as the age-standardized means and 95% CI of healthy sleep score, for each survey cycle. Next, we investigated age-standardized prevalence and 95% CI of diabetes, and age-standardized mean values and 95% CI of FPG, HbA1c, and HOMA-IR for each survey cycle by overall sleep quality groups. Differences in the prevalence of diabetes and the mean values of biomarkers between sleep quality groups in each cycle were assessed. The absolute differences in estimated age-standardized prevalence or means (and 95% CI) were assessed by comparing the 2017-2018 cycle with the reference cycle of 2005-2006. Further, statistical significance of trends over time were calculated by including the survey cycle as a continuous variable. To assess the statistical significance of the difference in trends between sleep quality groups over time, a multiplicative interaction term was evaluated between the survey year as a continuous variable and sleep quality group as an indicator category. Also, we repeated the analyses in 3 major race/ethnic groups and in participants with different BMI levels (<25 or ≥25 kg/m2). Multiple adjusted analyses were performed by including sex, race/ethnicity, BMI, physical activity, AHEI score, smoking, and alcohol consumption in the original models. Lastly, multiple quantile regression was used to assess the distribution of FPG, HbA1c, and HOMA-IR in each sleep quality group among participants free of diabetes.
Because the information on snoring and daytime sleepiness was not available in 3 cycles (2009-2014), we can only calculate the healthy sleep score in 4 cycles of the NHANES survey (from 2005 to 2008 and from 2015 to 2018). To better describe the joint trends on overall sleep quality and diabetes, we performed a sensitivity analysis by using a modified healthy sleep score (calculated as sleep 7-8 hours, no trouble sleeping, and no nocturia) across all 7 survey cycles. Analyses were performed using SAS version 9.4. A 2-sided significance test with P < .05 was considered statistically significant.
Results
In the main study sample, a total of 17 046 participants were included in the evaluation of healthy sleep score and overall sleep quality, with a weighted mean age of 47.3 years (SE 0.3), 8355 (weighted proportion 50.3%) women, 7126 non-Hispanic white (weighted proportion 68.1%), 3700 non-Hispanic black (weighted proportion 10.9%), and 2810 Mexican American (weighted proportion 8.1%). Between 2005 and 2018, the age and sex of the US population varied slightly across the survey cycles, and race became more diverse (Table S1 (31)). The sample sizes in each survey cycle are shown elsewhere (Table S2 (31)).
Trends for Individual Healthy Sleep Factors and Overall Sleep Quality
During the study period, except for adequate duration of sleep hours (7-8 hours), all the estimated age-standardized prevalence of individual healthy sleep behaviors declined (Table 1 and Figure S1 (31)). From 2005 to 2018, the largest significant decline was observed in no excessive daytime sleepiness from 81.65% to 71.93% (difference –9.72%, P for trend < .001), followed by no trouble sleeping from 75.82% to 70.13% (difference –5.68%, P for trend < .001 for), no nocturia from 76.99% to 73.60% (difference –3.39%, P for trend = .004), and never snoring from 29.38% to 26.35% (difference –3.04%, P for trend = .028).
| Variables | Age standardized prevalence or mean (95% CI) | 2017-2018 vs 2005-2006, difference (95% CI)d | |||||||
|---|---|---|---|---|---|---|---|---|---|
| 2005-2006 | 2007-2008 | 2009-2010 | 2011-2012 | 2013-2014 | 2015-2016 | 2017-2018 | P for trendc | ||
| Individual healthy sleep behaviors, weighted % (95% CI) | |||||||||
| Sleep 7-8 hours | 57.81 (55.41 to 60.21) | 55.47 (52.39 to 58.55) | 56.80 (55.57 to 58.02) | 56.36 (53.71 to 59.01) | 56.59 (54.38 to 58.81) | 59.87 (57.82 to 61.92) | 55.36 (52.71 to 58.02) | .848 | –2.44 (–6.02 to 1.13) |
| No trouble sleeping | 76.02 (74.49 to 77.55) | 76.26 (74.66 to 77.86) | 74.63 (72.35 to 76.91) | 72.90 (70.45 to 75.35) | 71.74 (69.86 to 73.62) | 69.66 (67.11 to 72.20) | 69.55 (66.73 to 72.37) | <.001 | –6.47 (–9.68 to –3.26) |
| No nocturia | 77.21 (75.26 to 79.17) | 76.46 (74.22 to 78.70) | 76.60 (75.32 to 77.88) | 76.63 (74.32 to 78.94) | 74.61 (72.14 to 77.09) | 73.70 (70.85 to 76.54) | 73.86 (72.08 to 75.63) | .002 | –3.35 (–6.02 to –0.69) |
| Never snoring | 29.35 (26.32 to 32.37) | 30.51 (28.67 to 32.35) | — | — | — | 26.91 (25.36 to 28.46) | 26.33 (24.05 to 28.61) | .027 | –3.02 (–6.80 to 0.76) |
| No excessive daytime sleepiness | 81.70 (80.39 to 83.02) | 81.55 (79.94 to 83.17) | — | — | — | 72.79 (70.75 to 74.83) | 72.08 (69.42 to 74.74) | <.001 | –9.62 (–12.60 to –6.64) |
| Healthy sleep score, weighted mean (95% CI) | |||||||||
| 0-5 pointse | 3.21 (3.15 to 3.26) | 3.20 (3.13 to 3.26) | — | — | — | 3.02 (2.96 to 3.08) | 2.97 (2.90 to 3.04) | <.001 | –0.24 (–0.33 to –0.15) |
| 0-3 pointsf | 2.11 (2.06 to 2.16) | 2.08 (2.03 to 2.13) | 2.08 (2.05 to 2.11) | 2.06 (2.01 to 2.11) | 2.03 (1.99 to 2.07) | 2.03 (1.98 to 2.08) | 1.99 (1.93 to 2.04) | <.001 | –0.12 (–0.19 to –0.05) |
| Overall sleep quality, weighted % (95% CI) | |||||||||
| Low (0-2) | 24.04 (22.34 to 25.75) | 25.11 (23.28 to 26.93) | — | — | — | 30.56 (27.89 to 33.23) | 32.48 (30.34 to 34.62) | <.001 | 8.44 (5.70 to 11.18) |
| Medium (3) | 31.01 (28.54 to 33.48) | 30.84 (29.22 to 32.47) | — | — | — | 31.94 (29.99 to 33.89) | 31.43 (30.00 to 32.87) | .601 | 0.42 (–2.45 to 3.30) |
| High (4-5) | 44.95 (42.22 to 47.68) | 44.05 (41.80 to 46.30) | — | — | — | 37.50 (35.42 to 39.57) | 36.09 (33.41 to 38.76) | <.001 | –8.86 (–12.68 to –5.05) |
Data are presented as weighted estimates (prevalence or mean) and 95% CI for each survey cycle.
Abbreviation: NHANES, National Health and Nutrition Examination Survey.
aSample sizes for each cell ranged from 917 to 5236 and documented in Table S2 (31).
bAll estimates were weighted to be nationally representative and standardized for age using 2000 US Census population as the standard population.
cP for trends were calculated using linear regression with the NHANES cycle as a continuous variable.
dA decrease corresponds to difference below 0.
eCalculated by all 5 individual sleep behaviors, ranging from 0 to 5.
fCalculated by 3 individual sleep behaviors (sleep 7-8 hours, no trouble sleeping, and no nocturia), ranging from 0 to 3.
| Variables | Age standardized prevalence or mean (95% CI) | 2017-2018 vs 2005-2006, difference (95% CI)d | |||||||
|---|---|---|---|---|---|---|---|---|---|
| 2005-2006 | 2007-2008 | 2009-2010 | 2011-2012 | 2013-2014 | 2015-2016 | 2017-2018 | P for trendc | ||
| Individual healthy sleep behaviors, weighted % (95% CI) | |||||||||
| Sleep 7-8 hours | 57.81 (55.41 to 60.21) | 55.47 (52.39 to 58.55) | 56.80 (55.57 to 58.02) | 56.36 (53.71 to 59.01) | 56.59 (54.38 to 58.81) | 59.87 (57.82 to 61.92) | 55.36 (52.71 to 58.02) | .848 | –2.44 (–6.02 to 1.13) |
| No trouble sleeping | 76.02 (74.49 to 77.55) | 76.26 (74.66 to 77.86) | 74.63 (72.35 to 76.91) | 72.90 (70.45 to 75.35) | 71.74 (69.86 to 73.62) | 69.66 (67.11 to 72.20) | 69.55 (66.73 to 72.37) | <.001 | –6.47 (–9.68 to –3.26) |
| No nocturia | 77.21 (75.26 to 79.17) | 76.46 (74.22 to 78.70) | 76.60 (75.32 to 77.88) | 76.63 (74.32 to 78.94) | 74.61 (72.14 to 77.09) | 73.70 (70.85 to 76.54) | 73.86 (72.08 to 75.63) | .002 | –3.35 (–6.02 to –0.69) |
| Never snoring | 29.35 (26.32 to 32.37) | 30.51 (28.67 to 32.35) | — | — | — | 26.91 (25.36 to 28.46) | 26.33 (24.05 to 28.61) | .027 | –3.02 (–6.80 to 0.76) |
| No excessive daytime sleepiness | 81.70 (80.39 to 83.02) | 81.55 (79.94 to 83.17) | — | — | — | 72.79 (70.75 to 74.83) | 72.08 (69.42 to 74.74) | <.001 | –9.62 (–12.60 to –6.64) |
| Healthy sleep score, weighted mean (95% CI) | |||||||||
| 0-5 pointse | 3.21 (3.15 to 3.26) | 3.20 (3.13 to 3.26) | — | — | — | 3.02 (2.96 to 3.08) | 2.97 (2.90 to 3.04) | <.001 | –0.24 (–0.33 to –0.15) |
| 0-3 pointsf | 2.11 (2.06 to 2.16) | 2.08 (2.03 to 2.13) | 2.08 (2.05 to 2.11) | 2.06 (2.01 to 2.11) | 2.03 (1.99 to 2.07) | 2.03 (1.98 to 2.08) | 1.99 (1.93 to 2.04) | <.001 | –0.12 (–0.19 to –0.05) |
| Overall sleep quality, weighted % (95% CI) | |||||||||
| Low (0-2) | 24.04 (22.34 to 25.75) | 25.11 (23.28 to 26.93) | — | — | — | 30.56 (27.89 to 33.23) | 32.48 (30.34 to 34.62) | <.001 | 8.44 (5.70 to 11.18) |
| Medium (3) | 31.01 (28.54 to 33.48) | 30.84 (29.22 to 32.47) | — | — | — | 31.94 (29.99 to 33.89) | 31.43 (30.00 to 32.87) | .601 | 0.42 (–2.45 to 3.30) |
| High (4-5) | 44.95 (42.22 to 47.68) | 44.05 (41.80 to 46.30) | — | — | — | 37.50 (35.42 to 39.57) | 36.09 (33.41 to 38.76) | <.001 | –8.86 (–12.68 to –5.05) |
Data are presented as weighted estimates (prevalence or mean) and 95% CI for each survey cycle.
Abbreviation: NHANES, National Health and Nutrition Examination Survey.
aSample sizes for each cell ranged from 917 to 5236 and documented in Table S2 (31).
bAll estimates were weighted to be nationally representative and standardized for age using 2000 US Census population as the standard population.
cP for trends were calculated using linear regression with the NHANES cycle as a continuous variable.
dA decrease corresponds to difference below 0.
eCalculated by all 5 individual sleep behaviors, ranging from 0 to 5.
fCalculated by 3 individual sleep behaviors (sleep 7-8 hours, no trouble sleeping, and no nocturia), ranging from 0 to 3.
We observed that the overall sleep quality of US adults, as estimated by healthy sleep score (calculated by sleep 7-8 hours, no trouble sleeping, no nocturia, never snoring, and no excessive daytime sleepiness), significantly decreased from 2005 to 2018 (P for trend < .001) (Table 1 and Fig. 1). The estimated age-standardized mean healthy sleep score was 3.21 (95% CI 3.15 to 3.26) in 2005-2006 and decreased to 2.97 (95% CI 2.90 to 3.04) in 2017-2018, with a difference of –0.24 (95% CI –0.33 to –0.15). From another perspective, we observed that the estimated age-standardized prevalence of US adults with low sleep quality (healthy sleep score ≤ 2) increased from 24.04% (95% CI 22.34 to 25.75) to 32.48% (95% CI 30.34 to 34.62), with a difference of 8.44% (95% CI 5.70% to 11.18%), while the estimated age-standardized prevalence in participants with high sleep quality (healthy sleep score ≥ 4) decreased from 44.95% (95% CI 42.22 to 47.68) to 36.09% (95% CI 33.41 to 38.76), with a difference of –8.86% (95% CI –12.68% to –5.05%) (P for trend < .001 for all). The estimated age-standardized prevalence of US adults with medium sleep quality (healthy sleep score = 3) remained similar across the cycles (P for trend = .601). Similar to the results of the total population, overall sleep quality showed similarly significant declination among all 3 race/ethnic groups: the estimated mean healthy sleep score declined, the estimated prevalence of low-quality sleeper increased, and the prevalence of high-quality sleeper decreased, while the prevalence of medium-quality sleep remained stable from 2005 to 2018 (Table S3 (31)).
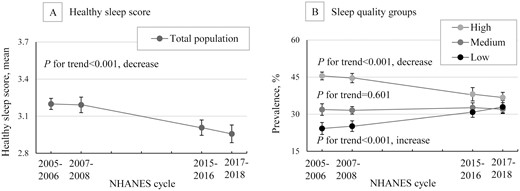
Trends in overall sleep quality among US adults, NHANES 2005-2018. Data were weighted to be nationally representative. Error bars indicate 95% CI; NHANES, National Health and Nutrition Examination Survey.
Joint Trends for Sleep Quality with Diabetes or Related Measures
To estimate the joint trends of sleep quality with diabetes and related measures, 16 517 participants who had available data on diabetes were included (Fig. 2 and Table S4 (31)). We observed that both the estimated age-standardized prevalence of diabetes and their changing trend varied significantly between the sleep quality groups (P for interaction = .045) (Fig. 2A). In each cycle, the highest estimated prevalence of diabetes was observed in the low sleep quality group, followed by the medium sleep quality group, and the lowest estimated prevalence of diabetes was observed in the high sleep quality group. For the changing trends in estimated prevalence of diabetes, significantly increasing trends were observed in the low sleep quality group (from 13.69% to 19.02%, P for trend = .004) and medium sleep quality group (from 9.16% to 13.13%, P for trend = .008) between 2005 to 2018, whereas the trend in the high sleep quality group was not significant over time (P for trend = .346) (Fig. 2A).
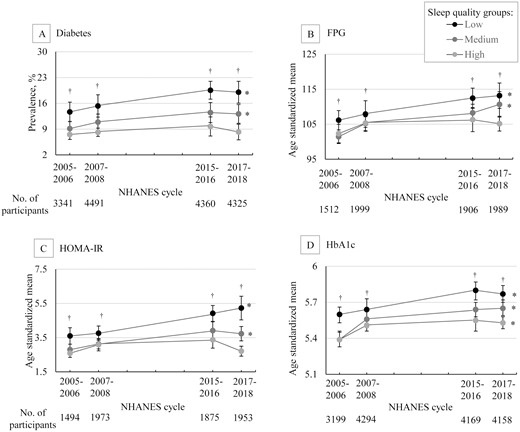
Trends in age-standardized estimates for diabetes and related measures by overall sleep quality groups, NHANES 2005-2018. Data were weighted to be nationally representative. Error bars indicate 95% CI; *P < .05 for trend over time; †P < .001 for trend in each cycle; NHANES, National Health and Nutrition Examination Survey; FPG, fasting plasma glucose; HOMA-IR, homeostatic model assessment for insulin resistance; HbA1c, glycated hemoglobin.
Similar results were observed for FPG, although the interaction did not reach the level of significance (P for interaction = .077). For FPG, the highest estimated age-standardized mean FPG was observed in the low sleep quality group in each cycle, and a statistically significant increasing trend was found from 2005 to 2018 (from 106.15 mg/dL to 113.16 mg/dL, P for trend = .002); we found similar levels of estimated mean FPG between the medium sleep quality group and the high sleep quality group in the first 2 cycles (2005-2008); however, in 2 recent cycles (2015-2018), the estimated mean FPG increased in the medium sleep quality group (from 101.44 mg/dL to 110.67 mg/dL, P for trend < .001), but not in the high-quality group (P for trend = .091) (Fig. 2B). Similar results were also observed for HOMA-IR (P for interaction < .001) (Fig. 2C). For HbA1c, in the low and medium sleep quality groups, results on the estimated mean levels and changing trend were similar to those of FPG, whereas a significant increasing trend was still observed in the high sleep quality group (P for trend = .003) (P for interaction = .188) (Fig. 2D). Moreover, these results were not materially changed after adjusting for sex, race/ethnicity, BMI, physical activity, AHEI score, smoking, and alcohol consumption (Table S5 (31)).
We also evaluated the joint trends for the overall sleep quality and diabetes in the major race/ethnic groups (Table 2). In each race/ethnic group, the highest estimated prevalence of diabetes was observed in the low sleep quality group, followed by the medium sleep quality group, and the lowest estimated prevalence of diabetes was observed in the high sleep quality group in each cycle. For the changing trend, the statistically significant increasing trend was only observed in the low sleep quality group in non-Hispanic White participants (P for trend = .012), but not in other subgroups. Moreover, we repeated the analyses of the joint trends for overall sleep quality with diabetes in participants with different BMI levels (<25 or ≥25 kg/m2). Compared with the total population, similar results were only observed in participants with BMI equal to or greater than 25 kg/m2, whereas no differential joint trends were observed for participants with BMI less than 25 kg/m2 (Table S6 (31)).
Trends in age standardized estimates for diabetes by sleep quality and race/ethnic groups among the US population 20 years or older, NHANES from 2005 to 2018a
| Sleep quality groups | Age-standardized prevalence of diabetes, weighted % (95% CI) | 2017-2018 vs 2005-2006, difference (95% CI)c | ||||
|---|---|---|---|---|---|---|
| 2005-2006 | 2007-2008 | 2015-2016 | 2017-2018 | P for trendb | ||
| Non-Hispanic White | ||||||
| Low | 11.68 (8.19 to 15.17) | 12.60 (8.17 to 17.03) | 17.62 (14.30 to 20.93) | 18.07 (13.54 to 22.59) | .012 | 6.39 (0.67 to 12.10) |
| Medium | 7.01 (4.77 to 9.25) | 9.32 (7.17 to 11.47) | 11.45 (7.32 to 15.57) | 10.59 (6.60 to 14.59) | .097 | 3.58 (–1.12 to 8.28) |
| High | 5.99 (4.23 to 7.75) | 6.69 (5.02 to 8.35) | 8.79 (6.12 to 11.45) | 6.66 (4.27 to 9.06) | .351 | 0.67 (–2.32 to 3.67) |
| Non-Hispanic Black | ||||||
| Low | 23.73 (17.15 to 30.32) | 26.60 (18.25 to 34.94) | 23.89 (19.69 to 28.10) | 19.77 (15.65 to 23.89) | .201 | –3.97 (–11.83 to 3.90) |
| Medium | 14.70 (8.86 to 20.54) | 19.12 (15.45 to 22.79) | 17.19 (13.68 to 20.71) | 19.41 (12.72 to 26.10) | .399 | 4.71 (–4.22 to 13.63) |
| High | 11.49 (8.23 to 14.74) | 15.38 (11.85 to 18.91) | 13.74 (8.03 to 19.45) | 9.20 (7.39 to 11.02) | .151 | –2.28 (–5.81 to 1.25) |
| Mexican American | ||||||
| Low | 25.65 (15.76 to 35.54) | 22.88 (18.08 to 27.68) | 29.47 (22.97 to 35.97) | 24.01 (17.96 to 30.06) | .958 | –1.64 (–13.33 to 10.05) |
| Medium | 18.48 (15.91 to 21.04) | 17.54 (11.77 to 23.30) | 22.16 (14.81 to 29.52) | 18.62 (12.39 to 24.85) | .756 | 0.14 (–6.40 to 6.68) |
| High | 15.21 (10.41 to 20.01) | 13.86 (9.97 to 17.74) | 15.66 (12.26 to 19.05) | 16.33 (11.40 to 21.25) | .601 | 1.12 (–5.60 to 7.84) |
Data are presented as weighted estimates (prevalence or mean) and 95% CI for each survey cycle. Bold, italic indicates significant value at 95%.
Abbreviation: NHANES, National Health and Nutrition Examination Survey.
aAll estimates were weighted to be nationally representative and standardized for age using 2000 US Census population as the standard population.
bP for trends were calculated using linear regression with the NHANES cycle as a continuous variable.
cA decrease corresponds to difference below 0.
Additionally, we examined the percentiles of the distribution of the biomarkers among nondiabetic adults, after adjusting for age, sex, and race/ethnic groups. The cumulative probabilities of distribution for FPG, HOMA-IR, and HbA1c, among nondiabetic adults are presented in Fig. 3. The median FPG level was 93.08 mg/dL (95% CI 92.98-93.17) in adults with low sleep quality, 92.57 mg/dL (95% CI 92.48-92.66) in adults with medium sleep quality, and 91.55 mg/dL (95% CI 91.47-91.63) in adults with high sleep quality (P < .001). The median value of HOMA-IR was 1.35 (95% CI 1.35-1.36) in the low sleep quality group, 1.23 (95% CI 1.22-1.23) in the medium sleep quality group, and 1.13 (95% CI 1.12-1.13) in the high sleep quality group (P < .001). The median HbA1c level was 5.21% (95% CI 5.21-5.22%) in the low sleep quality group, 5.16% (95% CI 5.15-5.16%) in the medium sleep group, and 5.12% (95% CI 5.11-5.12%) in the high sleep quality group (P < .001).

Distribution of FPG, HbA1c, and HOMA-IR values by overall sleep quality groups among adults 20 years or older without diabetes, NHANES 2005-2018, adjusted for age, sex, and race/ethnic groups. NHANES, National Health and Nutrition Examination Survey; FPG, fasting plasma glucose; HOMA-IR, homeostatic model assessment for insulin resistance; HbA1c, glycated hemoglobin.
Sensitive Analysis
We repeated the analyses by using a modified healthy sleep score consisting of sleep lasting 7-8 hours, and no trouble sleeping and no nocturia (ranging 0-3) across 7 cycles, and we found the results on diabetes and biomarkers in the newly classified overall low (0 ≤ healthy sleep score ≤ 1), medium (healthy sleep score = 2), and high (healthy sleep score = 3) sleep quality groups were similar to the results from analyses of the original healthy sleep score (range 0-5) (Table S7 (31)).
Discussion
In this nationally representative study of US adults from 2005-2006 to 2017-2018, the estimated overall sleep quality significantly declined over time. The estimated prevalence of diabetes significantly increased in the low sleep quality group and the medium sleep quality group between 2005 and 2018, whereas the trend in the high sleep quality group did not increase over this period of time.
Our findings provided the most recent national estimates of sleep behaviors in US adults. Limited information is known on the trends in sleep behaviors in the US population. A previous study from the National Health Interview Survey reported that the prevalence of trouble sleeping and excessive daytime sleepiness significantly increased between 2002 to 2012 (23). Another study from NHANES reported that, between 2005 and 2014, the prevalence of trouble sleeping significantly increased, and nocturia remained stable among participants with and without chronic kidney disease (32). In this study, by extending the analysis of sleep behaviors through 2018, we found the prevalence of several sleep problems has increased rapidly in recent years: the prevalence of trouble sleeping continued to increase after 2014; the prevalence of nocturia began to increase from 2013 to 2014; and increasing trends of snoring and excessive daytime sleepiness were observed between 2005 and 2018. There could be multiple reasons for these results, including the rise of the 24-hour economy with more flexible working hours and shift work, the acceleration of light pollution, the rapid increasing use of mobile technology, as well as the increasing work demands and accompanying perceived stress and changes in lifestyles during recent years (24, 33-37). For example, the proportion of US workers able to vary their work hours rose from 14% in 1985 to 30% in 2004 (38); the power of global satellite observable light emissions increased by at least 49% from 1992 to 2017 (39); the percentage of Americans owning a smartphone increased from 39% in 2012 to 81% in 2019 (40), and a causal relation between smartphone use and adverse sleep outcomes has been found in several clinical trials (35, 41).
For the first time, we have reported the long-term secular trend of overall sleep quality by generating a sleep score that combined multiple sleep behaviors, including sleeping 7 to 8 hours per day, no trouble sleeping, no snoring, no nocturia, and no excessive daytime sleepiness. Individual sleep behaviors are synergistically correlated and may impact in a concerted manner, thus an integrated indicator of multiple sleep behaviors may better capture a comprehensive profile of sleep and predict health outcomes including diabetes (18-21). Our findings describe a significant decline in overall sleep quality among US adults from 2005 to 2018, and a declining trend was consistently observed among non-Hispanic White, non-Hispanic Black, and Mexican Americans.
Despite extensive public health investments in the prevention of diabetes, 2 recent studies showed that the estimated prevalence of diabetes in the United States has dramatically increased in the past 2 decades (9, 10). The current study has added new evidence to the existing literature that both the prevalence of diabetes and the changing trend in the prevalence of diabetes varied significantly according to overall sleep quality: the estimated prevalence of diabetes significantly increased in the low and medium sleep quality groups but remained stable in the high sleep quality group. The consistent results on diabetes-related measures including FPG and HOMA-IR ensured the robustness of our findings. These results are supported by several previous prospective studies examining the association of sleep behaviors with diabetes, in which suboptimal sleep duration, trouble sleeping, snoring, and excessive daytime sleepiness were related to a higher risk of incident diabetes (11-17). Notably, to date, no previous clinical trial specifically addressed improving overall sleep quality as an intervention, whereas our findings were partly supported by some clinical trials targeting individual sleep factors. A clinical trial of patients with obstructive sleep apnea (OSA) and impaired glucose tolerance found that 2 weeks of continuous positive airway pressure (the first-line therapy for OSA) treatment significantly improved insulin sensitivity (42). Another clinical trial reported that continuous positive airway pressure was associated with a 0.4%-point decrease in HbA1c at 6 months among patients with OSA and type 2 diabetes (43). Previous studies have also shown that acute sleep restriction of 4 to 6 hours per night for a period of days to weeks resulted in lower insulin sensitivity and glucose tolerance among health volunteers (44, 45). More evidence from clinical trials targeting overall sleep quality is warranted. Moreover, prior studies have illustrated that the significant increasing trend in prevalence of diabetes may be in part a consequence of a parallel increase in related modifiable risk factors, such as diet, smoking, and physical activity (5, 6, 8). The escalation of diabetes has been continuing regardless of the extensive efforts in controlling these modifiable factors in recent years, suggesting other risk factors might have been neglected. Taken together, our results suggest that overall sleep quality may also be a potential risk factor for the upward trend of diabetes prevalence in US adults, and future studies in a prospective setting or clinical trials are needed to verify our findings.
In this study, the significant declining trends of overall sleep quality were consistently observed in all 3 major race/ethnic groups, whereas the increasing trend in the prevalence of diabetes by sleep quality appeared to be more significant among non-Hispanic Whites than other race/ethnic groups. Notably, 2 recent studies did show that the trend in the prevalence of diabetes was only significantly increased in non-Hispanic White US adults (9, 10), but not in others. Thus, we speculated that the lack of differential joint trends between overall sleep quality and diabetes observed in non-Hispanic Blacks and Mexican Americans might be explained by the differences in the trends of diabetes prevalence between race/ethnic groups.
Moreover, considering that sleep was also associated with BMI, an important risk factor strongly related to the development of diabetes, we performed the stratified analysis of the joint trend for overall sleep quality with diabetes using BMI levels. We found that differential joint trends were only observed in overweight/obese participants, but not in lean participants. Such results in overweight/obese participants might be because overweight individuals may have unfavorable risk factors that act additively with poor sleep quality on the risk of diabetes. The lack of differential joint trends for lean participants might be because the prevalence of diabetes in these participants did not significantly increase (46).
To the best of our knowledge, the present study is the first investigation into long-term trends of the prevalence of diabetes according to overall sleep quality in the US population. This study has several major strengths, including utilization of the latest national representative data of the civilian, noninstitutionalized, US population, and NHANES was conducted using a rigorous study protocol and extensive quality control procedures. However, this study also has several limitations. Firstly, due to the cross-sectional survey design, we cannot make causal inferences on the association between sleep and diabetes. Further studies are needed to investigate the temporal sequence between sleep and diabetes. Secondly, NHANES only included noninstitutionalized participants, whereas the habits and comorbidity of institutionalized participants may differ from the general population. Thirdly, information on sleep behaviors was self-reported, and might lead to potential misclassification. The objective measurements of sleep behaviors are not suitable for large population studies due to the high cost, whereas a moderate correlation between self-reported sleep duration and objective measures was reported in a previous study (47). Fourth, a self-reported diabetes diagnosis, unrecorded diabetes type, and the single-time measurement of FPG and HbA1C might lead to a possible misclassification of diabetes. Fifth, a previous study found that OSA is also related to diabetes; however, NHANES did not collect such information. Thus, we cannot exclude the potential confounding effect of OSA on our results. Lastly, due to the NHANES study design and limited sample size, we only evaluated the 3 major racial groups; future studies on multiple race/ethnic groups and larger sample size are encouraged.
In conclusion, our results indicate that the estimated overall sleep quality significantly declined in US adults from 2005 to 2018. Both the estimated age-standardized prevalence of diabetes and changing trend in prevalence of diabetes varied significantly by the overall sleep quality groups. The estimated prevalence of diabetes only significantly increased in participants with low or medium overall sleep quality, but remained stable in participants with high sleep quality. Our findings highlight the importance of considering overall sleep quality in the prevention of diabetes.
Abbreviations
- AHEI
Alternate Healthy Eating Index
- BMI
body mass index
- FPG
fasting plasma glucose
- HbA1c
glycated hemoglobin
- HOMA-IR
homeostatic model assessment for insulin resistance
- OSA
obstructive sleep apnea
Funding
The study was supported by grants from the National Heart, Lung, and Blood Institute (HL071981, HL034594, HL126024), the National Institute of Diabetes and Digestive and Kidney Diseases (DK115679, DK091718, DK100383, DK078616), the Fogarty International Center (TW010790), Tulane Research Centers of Excellence Awards. Dr. Qi is also supported by P30DK072476 and NIGMS P20GM109036.
Author Contributions
X.W., H.M., and L.Q.: designed the research; X.W. and H.M.: conducted the research; X.W. and H.M.: analyzed the data or performed statistical analysis; X.W., H.M., and L.Q.: wrote the manuscript; L.Q.: had primary responsibility for the final content; and all authors: critically reviewed the manuscript and approved submission.
Disclosures
The authors have no disclosures relevant to the present study. The authors declare no competing financial interests. The authors declare no conflicts of interest.
Data Availability
Some or all data generated or analyzed during this study are included in this published article or in the data repositories listed in References. The data that support the findings of this study are openly available in NHANES at [https://www.cdc.gov/nchs/nhanes/index.htm].
Role of the Funder/Sponsor
The funding sources and sponsor had no role in the design and conduct of the study; collection, management, analysis, and interpretation of the data; preparation, review, or approval of the manuscript; and decision to submit the manuscript for publication.
Transparency Statement
L.Q. affirms that the manuscript is an honest, accurate, and transparent account of the study being reported; that no important aspects of the study have been omitted; and that any discrepancies from the study as planned have been explained.
