


Abstract
Insulin secretion and sensitivity regulate glycemia, with inadequately compensated deficiencies leading to diabetes.
We investigated effects of weight loss, an intensive lifestyle intervention (ILS), and metformin on the relationship between insulin secretion and sensitivity using repository data from 2931 participants in the Diabetes Prevention Program clinical trial in adults at high risk of developing type 2 diabetes.
Insulin secretion and sensitivity were estimated from insulin and glucose concentrations in fasting and 30-minute postload serum samples at baseline and 1, 2, and 3 years after randomization, during the active intervention phase. The nonlinear relationship of secretion and sensitivity was evaluated by standardized major axis regression to account for variability in both variables. Insulin secretory demand and compensatory insulin secretion were characterized by distances along and away from the regression line, respectively.
ILS and metformin decreased secretory demand while increasing compensatory insulin secretion, with greater effects of ILS. Improvements were directly related to weight loss; decreased weight significantly reduced secretory demand (b=−0.144 SD; 95% CI (−0.162, −0.125)/5 kg loss) and increased compensatory insulin secretion (b = 0.287 SD, 95% CI (0.261, 0.314)/5 kg loss). In time-dependent hazard models, increasing compensatory insulin secretion (hazard ratio [HR] = 0.166 per baseline SD, 95% CI 0.133, 0.206) and weight loss (HR = 0.710 per 5 kg loss, 95% CI 0.613, 0.819) predicted lower diabetes risk.
Diabetes risk reduction was directly related to the amount of weight loss, an effect mediated by lowered insulin secretory demand (due to increased insulin sensitivity) coupled with improved compensatory insulin secretion.
Decreased insulin sensitivity and reduced insulin secretion characterize the transitions from normal glucose regulation (NGR) to impaired glucose regulation (IGR) and from IGR to type 2 diabetes (1–3). In healthy individuals, insulin secretion increases to compensate for decreased insulin sensitivity which maintains normal glucose tolerance (4–6). Thus, insulin secretion should be evaluated in relationship to insulin sensitivity to detect beta-cell defects (5). The relationship between these 2 variables is usually described by a curve that allows an assessment of insulin secretion relative to insulin sensitivity and provides a measure of beta-cell function (6). Studies of this relationship have led to a better understanding of the causes of type 2 diabetes (5, 7).
Stumvoll et al (8) studied this relationship in American Indians. They measured the homeostatic response using the disposition index (DI), the product of estimated insulin secretion and insulin sensitivity. They also used the ratio of insulin secretion divided by insulin sensitivity as a beta-cell demand index (BCDI), which estimated insulin secretion per degree of insulin sensitivity. Higher DI predicted lower risk of diabetes, while higher BCDI predicted higher risk. Later, measures of insulin secretion compensation and insulin secretory demand that are highly correlated with DI and BCDI, respectively, but which do not require the assumption of a hyperbolic relationship inherent in the DI/BCDI, were investigated in this same population (9). These measures were calculated for sets of intravenous and oral indices of insulin secretion and sensitivity. Increasing levels of insulin secretion compensation significantly reduced risk of diabetes while increasing levels of secretory demand increased it.
The Diabetes Prevention Program (DPP; ClinicalTrials.gov registration no. NCT00004992) was a randomized clinical trial in adults at high risk of developing type 2 diabetes. After 3 years of follow-up, participants assigned to an intensive lifestyle intervention (ILS) or metformin, compared with placebo, had a 58% and a 31% reduction in diabetes incidence, respectively (10). Kitabchi et al (11) described the relationship between insulin secretion and sensitivity in DPP at baseline and 1 year after randomization, finding that there were rightward shifts from the baseline curve in points representing median insulin secretion and sensitivity for participants assigned to ILS or metformin. These rightward shifts were consistent with increased insulin sensitivity and improved beta-cell function and with the reduced incidence of diabetes for participants in these 2 treatment groups. ILS participants had the biggest movement to the right of the baseline curve after 1 year of treatment (11), and among them weight loss was the primary factor contributing to reduced risk of diabetes (12). Weight loss also predicted reduced diabetes risk in the metformin and placebo groups and largely explained the effect of metformin over placebo in reducing this risk (13).
In this study, we used repeated measurements of insulin secretion and sensitivity to investigate how abnormalities in both develop relative to each other and to determine whether treatment, time, weight change, or combinations of these variables affect their interaction during the progression from IGR to diabetes. First, we expanded the work of Kitabchi et al (11) by describing the longitudinal relationship between insulin secretion and sensitivity in DPP participants by treatment group, not only at baseline and year 1, but also at years 2 and 3 after randomization. Second, we determined whether the relationship changed over time separately at years 1, 2, and 3 within each treatment group. We investigated how weight change from baseline affected this relationship. We examined the longitudinal associations of weight loss with insulin secretion compensation and secretory demand. Finally, we studied the time-dependent associations of insulin secretion compensation and secretory demand with the transition from IGR to type 2 diabetes development.
Materials and Methods
Participants
The DPP was a multicenter, randomized clinical trial that investigated the effects of an ILS and metformin on the prevention or delay of type 2 diabetes onset in participants with IGR (10). Eligibility criteria included age ≥25 years, BMI ≥24 kg/m2 (≥22 kg/m2 if Asian), fasting plasma glucose (FPG) between 5.3, and 6.9 mmol/L and 2-hour plasma glucose (2-hour PG) between 7.8 and 11.0 mmol/L (10). Participants were randomized to ILS, metformin, or placebo treatment groups. The primary outcome was diabetes development which was diagnosed using an annual oral glucose tolerance test (OGTT) or a semiannual FPG test using the American Diabetes Association 1997 criteria (2-hour plasma glucose ≥11.1 mmol/L or FPG ≥7.0 mmol/L), with confirmation by a repeat test. Written informed consent was obtained from all participants and the studies were approved by each clinical center's institutional review board.
Data Collection
We conducted a secondary analysis using data from the DPP repository (14), which contained information on 3081 of the 3234 original participants randomized to the ILS, metformin, or placebo group. The repository includes data only from consenting participants at clinics with institutional review board approval to distribute data to the repository and does not include data from the American Indian centers. We analyzed data from 2931 participants with baseline FPG <7.0 mmol/L, and complete baseline data on fasting and 30-minute serum insulin and plasma glucose levels after an OGTT. Of these 2931 participants, 970 were assigned to ILS, 975 to metformin, and 986 to placebo. In our study 611 participants developed diabetes during DPP. We only used data from participants’ visits (baseline, years 1, 2, and 3) before they developed diabetes, resulting in 8979 observations (2931 from baseline, 2504 from year 1, 2266 from year 2, and 1278 from year 3). We had a much smaller sample at year 3, because we only used data collected during the active phase of DPP, which ended after a mean follow-up of 3.2 years, so many participants had no opportunity for a 3-year exam during the DPP. We did not analyze data from the long-term follow-up study, the Diabetes Prevention Program Outcomes Study, because of the change in interventions during follow-up.
Surrogate indices of insulin secretion and sensitivity were calculated from plasma glucose and serum insulin concentrations measured at fasting (G0, I0) and 30 minutes (G30, I30) during an OGTT. Insulin sensitivity was estimated by the insulin sensitivity index and insulin secretion by the 30-minute corrected insulin response {CIR30 = [100*I30]/[G30(G30 − 70)]}, where glucose concentrations are in mg/dL, and insulin concentrations in µU/mL. These indices are highly correlated with the gold standard measures of insulin secretion and sensitivity (15) and were used in the previous DPP analysis (11).
Baseline covariates included age, sex, race/ethnicity, and DPP treatment assignment. Longitudinal variables included weight change from baseline, G0, G30, G120, I0, I30, ISI0, CIR30, and measures of insulin secretory demand and secretion compensation described below.
Statistical Analysis
Descriptive statistics for participants at baseline were calculated using frequency distributions for categorical variables. Longitudinal continuous variables were summarized using arithmetic means, geometric means, or medians as appropriate.
We studied the relationship between insulin secretion and sensitivity by estimating linear models with ln(CIR30) as a function of ln(ISI0) using standardized major axis (SMA) regression. We used SMA regression because our interest was to summarize the relationship between these 2 variables through the line of best fit that accounted for variability in both (measurement error and biological variability) and because their relationship is thought to be symmetric (9); see also (16). By contrast with ordinary least squares regression, which minimizes the vertical distance between each point and the line (only accounts for variability in y), SMA regression minimizes the area of the right triangle defined by vertical and horizontal distances from each point to the line. Our SMA models do not assume a hyperbolic relationship between insulin secretion and sensitivity. To investigate whether the relationship between insulin secretion and sensitivity changed over time, we compared the lines describing this relationship at baseline and at years 1, 2, and 3 separately for each treatment group. These were compared by first checking if lines for the same treatment group but at different yearly visits shared a common slope with a likelihood ratio test (17); if so, we used a Wald test for common intercepts (17). Significantly different slopes and/or intercepts indicated that the relationship changed over time. All lines and tests results were obtained using the smatr package in R.
We also studied whether weight change from baseline to years 1, 2, and 3 affected the relationship between insulin secretion and sensitivity within each treatment group. We divided participants with data at year 1 into 3 groups depending on their weight change from baseline ranging from participants who lost the most weight to those who gained weight. Without considering treatment arm, the subsample of participants who lost weight from baseline to year 1 was split into approximately 2 halves based on the magnitude of weight loss: the half with the greatest decreases in weight was placed into Group 1, the half with the smallest decreases in weight was placed into Group 2; the subsample of participants who gained weight from baseline to year 1 was placed in Group 3. Then, within each treatment group, we fitted an SMA line to describe the relationship between insulin secretion and sensitivity separately for each weight change group. We then compared the weight change group lines within a treatment checking for common slopes and intercepts. The same procedure was followed for years 2 and 3.
We estimated longitudinal associations of weight change with trajectories of insulin secretion compensation and secretory demand estimated as previously described (9). First, we fitted an SMA line that estimated the relationship between log-transformed insulin secretion and sensitivity at baseline. Figure 1A and 1B show the SMA line fitted to log-transformed baseline variables and the resulting curve in their original scale, respectively. We fitted a line orthogonal to the baseline SMA regression line that intersected it at the mean of the natural logarithm of baseline insulin secretion and sensitivity measures (centroid of the data). For each participant, we calculated perpendicular distances for all data points (ie, at baseline and at years 1, 2, and 3) from the baseline SMA line and from its orthogonal line and allowed these distances to be positive or negative to take on the same direction as the residuals (9). Figure 1C and 1D illustrate how the distances away from the baseline SMA line and along the baseline SMA line were calculated for all data points of a participant. We calculated the distances to estimate insulin secretory demand and compensatory insulin secretion (8, 9). Another purpose was to investigate factors affecting the movements of points over time with respect to the baseline SMA line, since the position of the points with respect to the curve representing beta-cell function determines the risk of developing diabetes (2, 9). We called distances from the baseline SMA line distances away from the baseline SMA line and distances from the orthogonal line distances along the baseline SMA line (9). Distances away from the baseline SMA line represent measures of adequacy of insulin secretion compensation in response to changes in insulin sensitivity and relate to the Stumvoll et al (8) measures of homeostatic response to glucose, but without assuming a hyperbolic relationship (9). Distances along the baseline SMA line represent measures of insulin secretory demand imposed by decreased insulin sensitivity and relate to the Stumvoll et al (8) measures of allostatic load/physiologic stress of the beta-cells when compensating for diminished insulin sensitivity, again without assuming a hyperbolic relationship (9). In participants with the same secretion compensation levels (same distances away from the baseline SMA line), the distances along the baseline SMA line allow the quantification of increase in insulin secretion per decrease in insulin sensitivity (9). We standardized both distances with respect to the baseline and jointly estimated their longitudinal trajectories by specifying their standardized values as outcomes in a multivariate linear mixed-effects model with random intercepts and slopes and with natural cubic splines for time. Weight change from baseline was included as a time-dependent covariate in the multivariate linear mixed-effects model to investigate its longitudinal associations with the trajectories of these distances, when adjusted for its cross-sectional effect and several baseline covariates (sex, age, race/ethnicity, treatment assignment, weight). The longitudinal associations of weight change described how within-participant changes in weight are related to within-participant changes in the distances (18, 19). The multivariate linear mixed-effects model was fitted using SAS.
![(A) Relationship between baseline insulin secretion and baseline insulin sensitivity in logarithmic scale. (B) Relationship between baseline insulin secretion and baseline insulin sensitivity in original scale. (C) Distances away from the baseline SMA line and distances along the baseline SMA line for all data points belonging to 1 participant with points shown in logarithmic scale. The distances away from the baseline SMA line, ln(CIR30) = −2.725 − 1.147*ln(ISI0), to any point representing (ln(ISI0), ln(CIR30)) for any participant i at any time t (xit, yit), respectively, were calculated using the formula daway={(yit−[−2.725−1.147*xit])/1+(−1.147)2}. The distances along the baseline SMA line were obtained by calculating the distances from the points to the line orthogonal to the baseline SMA line, ln(CIR30) = 0.912 + 0.872*ln(ISI0), using the formula dalong={(yit−[0.912+0.872*xit])/1+0.8722}. The absolute value of the numerators in these formulas were not taken to allow the distances to be positive or negative so they could take the same direction as the residuals. Points located below and to the left of the baseline SMA line have negative distances away from the baseline SMA line and points located above and to the right of the baseline SMA line have positive distances away from the baseline SMA line. Points located below and to the right of the orthogonal line have negative distances along the baseline SMA line and points located above and to the left of the orthogonal line have positive distances along the baseline SMA line. Distances away from the baseline SMA line which represent compensatory insulin secretion increase as points move from below and to the left of the baseline SMA line to above and to the right of the baseline SMA line (as they go from negative to positive). While distances along the baseline SMA line representing insulin secretory demand increase as points go from below and to the right of the orthogonal line to above and to the left of the orthogonal line (as they go from negative to positive). The participant with data included in this figure had highest compensatory insulin secretion at year 2 after randomization (highest positive distance away from the baseline SMA line) and lowest compensatory insulin secretion at year 3 (negative and lowest distance away from the baseline SMA line). This participant had lowest insulin secretory demand at year 1 (most negative distance along the baseline SMA line) and highest secretory demand at baseline (least negative distance along the baseline SMA line). This participant was at highest risk of diabetes at year 3 because although its insulin secretory demand was lower than at baseline, the compensatory insulin secretion was lowest at year 3 than at any other time point illustrated and this caused the participant to be below and to the left of the baseline SMA curve at year 3. (D) Points shown in original scale.](https://oup.silverchair-cdn.com/oup/backfile/Content_public/Journal/jcem/107/11/10.1210_clinem_dgac509/3/m_dgac509f1.jpeg?Expires=1750632679&Signature=EffaZT6qG-had8HSrXmuyF44C9hjJYDpVLWi5iGeUvOEH0eThLUYa9yvVF-RLnXgcrZDwwt5s6ZjsZ1XpVqd-HIqANMJW~y3EiSWxlKjduWmtSPNY8jX10IxRSpKVsmb76F3uDnBTR4VVG9ROF~Oce0GRkr1W6NhCvGBcyTm2rKOTR-mc2qbPvH49LOq0R8enKihlsVPLYmypiu4u~--~IWnO6QhRWTAoc6L4o~pSU4AWaRsVi48MfAOE1ETGsW7bQDZk0VgFTaYXEi2yTulNtSovKXgQ-DZLV50tQJ6fPeDwnu9DNw~wPjZTsj5ZmKaN7tQQkhd6~ePZsNeyt0XRQ__&Key-Pair-Id=APKAIE5G5CRDK6RD3PGA)
(A) Relationship between baseline insulin secretion and baseline insulin sensitivity in logarithmic scale. (B) Relationship between baseline insulin secretion and baseline insulin sensitivity in original scale. (C) Distances away from the baseline SMA line and distances along the baseline SMA line for all data points belonging to 1 participant with points shown in logarithmic scale. The distances away from the baseline SMA line, ln(CIR30) = −2.725 − 1.147*ln(ISI0), to any point representing (ln(ISI0), ln(CIR30)) for any participant i at any time t (xit, yit), respectively, were calculated using the formula . The distances along the baseline SMA line were obtained by calculating the distances from the points to the line orthogonal to the baseline SMA line, ln(CIR30) = 0.912 + 0.872*ln(ISI0), using the formula . The absolute value of the numerators in these formulas were not taken to allow the distances to be positive or negative so they could take the same direction as the residuals. Points located below and to the left of the baseline SMA line have negative distances away from the baseline SMA line and points located above and to the right of the baseline SMA line have positive distances away from the baseline SMA line. Points located below and to the right of the orthogonal line have negative distances along the baseline SMA line and points located above and to the left of the orthogonal line have positive distances along the baseline SMA line. Distances away from the baseline SMA line which represent compensatory insulin secretion increase as points move from below and to the left of the baseline SMA line to above and to the right of the baseline SMA line (as they go from negative to positive). While distances along the baseline SMA line representing insulin secretory demand increase as points go from below and to the right of the orthogonal line to above and to the left of the orthogonal line (as they go from negative to positive). The participant with data included in this figure had highest compensatory insulin secretion at year 2 after randomization (highest positive distance away from the baseline SMA line) and lowest compensatory insulin secretion at year 3 (negative and lowest distance away from the baseline SMA line). This participant had lowest insulin secretory demand at year 1 (most negative distance along the baseline SMA line) and highest secretory demand at baseline (least negative distance along the baseline SMA line). This participant was at highest risk of diabetes at year 3 because although its insulin secretory demand was lower than at baseline, the compensatory insulin secretion was lowest at year 3 than at any other time point illustrated and this caused the participant to be below and to the left of the baseline SMA curve at year 3. (D) Points shown in original scale.
We also investigated whether the ILS and metformin effects on the distances away from the baseline SMA line were explained by weight change at years 1, 2, and 3. For this purpose, we fitted 2 linear regression models separately for each year with the distances away from the baseline SMA line at that year as outcomes. Model 1 included the baseline covariates sex, age at baseline, race/ethnicity, treatment, baseline weight, and baseline distance away from the SMA line. Model 2 included the same baseline covariates as model 1 and added weight change from baseline to the current year as another covariate. Then, at each year, we compared the ILS and metformin effects on the distances away from the baseline SMA line from both models. We followed the same procedure to determine whether the ILS and metformin effects on the distances along the baseline SMA line were explained by weight change.
We investigated the time-dependent associations of distances away from the baseline SMA and along the baseline SMA line with the transition from IGR to type 2 diabetes using time-varying Cox models (TVCMs) and joint models (JMs) for time-to-event and multivariate longitudinal data (20–25). We then added weight change from baseline as a time-dependent covariate to the models to determine whether it is associated with the risk of this transition. TVCMs assume that time-dependent covariates only change values at follow-up visits and that they remain constant in the time interval in between measurements while JMs estimate the underlying true value of the time-dependent covariates at any point in time using their available longitudinal measurements allowing them to change any time (20–23) (see (16) for details on differences in estimation approaches of hazard ratios for time-dependent covariates in TVCMs and JMs). TVCMs were calculated in SAS and JMs using the rstanarm (26) and JMBayes2 (27) packages in R. After conducting all previous analyses, we determined whether the longitudinal measurements of distances away from the baseline SMA line, distances along the baseline SMA line, and weight loss mediated the effects of ILS and metformin on the risk of diabetes using the causal steps approach (28, 29). We calculated the percentage of effects mediated as described elsewhere (16).
All analyses described above used data from all DPP examinations in participants who did not develop diabetes and only the exams without diabetes in those who subsequently developed diabetes. Data from examinations in which participants were diagnosed with diabetes were only used to build figures showing average insulin secretion and sensitivity at baseline and at yearly visit of diagnosis and in the TVCMs and JMs used to study the time-dependent associations of insulin secretory demand and secretion compensation with diabetes risk.
Results
Figure 2 shows profile plots for variables measured longitudinally at examinations when participants did not have diabetes. At baseline, most variables were similar between the 3 treatment groups (Table 1). ILS and metformin participants lost weight at year 1; over time, ILS participants had the highest weight loss followed by metformin participants, while placebo participants gained weight on average (Fig. 2A). Fasting and 30-minute plasma glucose and serum insulin levels were lowest for ILS participants over time (Fig. 2B, 2C, 2E, and 2F). ILS participants also had the lowest 2-hour plasma glucose levels over time (Fig. 2D). Insulin secretion levels by themselves (CIR30, not adjusted for insulin sensitivity) did not differ between treatments over time (Fig. 2G), while insulin sensitivity (ISI0) was highest at all time-points after randomization for ILS participants and lowest for placebo (Fig. 2H). Distances away from and along the baseline SMA line were similar at baseline between the 3 treatment groups (Fig. 2I and 2J). Distances away from the baseline SMA line (insulin secretion compensation) were significantly higher than placebo and metformin for ILS participants at years 1 and 2 after randomization (P < .0001) and for metformin compared with placebo at year 1 after randomization (P < .0001). Distances along the baseline SMA line (insulin secretory demand) were significantly lower than placebo for ILS participants at years 1, 2, and 3 after randomization (P < .0001, P < .0001, and P = .0003, respectively) and for metformin at year 1 (P = .0009). Distances along the baseline SMA line were significantly lower for ILS participants than metformin at year 2 (P = .0023).
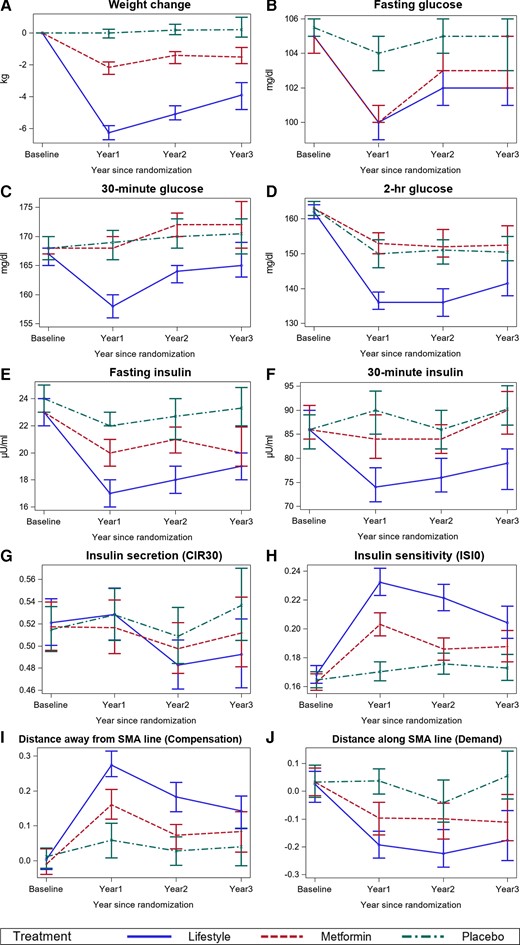
Longitudinal profiles of time-dependent variables in DPP at baseline and annual examinations before participants developed diabetes. A, Longitudinal changes in weight. B, Longitudinal changes in fasting glucose. C, Longitudinal changes in 30-minute plasma glucose. D, Longitudinal changes in 2-hr plasma glucose. E, Longitudinal changes in fasting insulin. F, Longitudinal changes in 30-minute insulin. G, Longitudinal changes in insulin secretion. H, Longitudinal changes in insulin sensitivity. I, Longitudinal changes in insulin secretion compensation (distances away from baseline SMA line). J, Longitudinal changes in insulin secretion demand (distances along the baseline SMA line. At year 1, there were 2504 participants: 872 in ILS, 821 in metformin, and 811 in placebo. At year 2, there were 2266 participants: 810 in ILS, 747 in metformin, and 709 in placebo. At year 3, there were 1278 participants: 456 in ILS, 412 in metformin, and 410 in placebo.
Descriptive statistics of DPP participants for baseline covariates
| Baseline characteristicsa | All (n = 2931) | Treatment group | ||
|---|---|---|---|---|
| ILS (n = 970) | Metformin (n = 975) | Placebo (n = 986) | ||
| Sex, n (%) | ||||
| Male | 975 (33.3) | 320 (33.0) | 338 (34.7) | 317 (32.2) |
| Female | 1956 (66.7) | 650 (67.0) | 637 (65.3) | 669 (67.8) |
| Race/Ethnicity, n (%) | ||||
| White | 1670 (57.0) | 548 (56.5) | 567 (58.2) | 555 (56.3) |
| Hispanic | 487 (16.6) | 167 (17.2) | 156 (16.0) | 164 (16.6) |
| Black | 618 (21.1) | 193 (19.9) | 213 (21.8) | 212 (21.5) |
| Other race | 156 (5.3) | 62 (6.4) | 39 (4.0) | 55 (5.6) |
| Age group at baseline, n (%) | ||||
| <45 years | 861 (29.4) | 301 (31.0) | 277 (28.4) | 283 (28.7) |
| 45 to <60 years | 1461 (49.8) | 453 (46.7) | 496 (50.9) | 512 (51.9) |
| ≥60 years | 609 (20.8) | 216 (22.3) | 202 (20.7) | 191 (19.4) |
| BMI (kg/m2) category at baseline, n (%) | ||||
| <30 | 953 (32.5) | 321 (33.1) | 324 (33.2) | 308 (31.2) |
| 30 to <35 | 890 (30.4) | 298 (30.7) | 305 (31.3) | 287 (29.1) |
| ≥35 | 1088 (37.1) | 351 (36.2) | 346 (35.5) | 391 (39.7) |
No significant differences among the 3 treatment groups. For age and BMI, differences were tested in categorical and continuous scale and no significant differences were found in either.
Longitudinal Relationship Between Insulin Secretion and Sensitivity
At baseline, the slopes (P = .163) and intercepts (P = .268) of the lines describing the relationship between insulin secretion and sensitivity for each of the 3 treatment groups were not significantly different. Figures 3A-3C show longitudinal curves describing the relationship between insulin secretion and sensitivity in the ILS, metformin, and placebo groups, respectively. The 95% CI for intercepts and slopes for each curve are shown elsewhere (16). The lines for ILS and metformin participants shared a common slope across follow-up visits (ILS: P = .739; metformin: P = .084), but not a common intercept (ILS: P < .0001; metformin: P < .0001). The lines for placebo participants shared a common slope (P = .823) and a common intercept (P = .052). Thus, tests for common slopes and intercepts suggested that the relationship between insulin secretion and sensitivity changed over time only for ILS and metformin participants. For ILS and metformin, the curves for year 1 were above and to the right of the curves for all other time points, while the curves for baseline are below and to the left of all other curves. Curves for participants in placebo overlapped throughout time.
Figure 4A shows the baseline SMA curve fitted to all participants and the geometric means of insulin secretion and sensitivity for each treatment group at each of the yearly visits before they developed diabetes. Mean insulin sensitivity and secretion did not change much over time for placebo participants. Points representing average insulin secretion and sensitivity moved furthest to the right for ILS and metformin participants from baseline to year 1. Insulin sensitivity for ILS participants was higher than for metformin and placebo participants at all time points after the baseline visit.
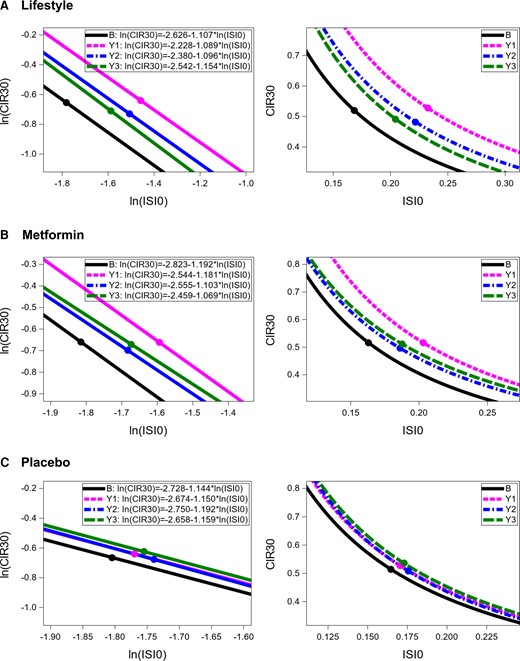
Longitudinal curves describing relationship between insulin secretion and sensitivity in DPP participants by treatment group. Left panels represent comparisons in logarithmic scales and right panels present comparisons in original scales. B = baseline, Y1 = year 1, Y2 = year 2, Y3 = year 3. The points on each line represent the mean values of ln(CIR30) and ln(ISI0).

Longitudinal averages of insulin secretion and sensitivity by treatment group before diagnosis of diabetes and at diagnosis. The geometric means of insulin sensitivity (ISI0) and insulin secretion (CIR30) for participants in the ILS group at baseline were obtained by first log-transforming the ISI0 and CIR30 of all these participants (ln (ISI0), ln(CIR30)). Then calculating the averages of the log-transformed values (average of ln(ISI0), average of ln(CIR30)), and finally exponentiating the averages of ln(ISI0) and ln(CIR30). The same process was followed to estimate the geometric means of insulin sensitivity and insulin secretion at all other time-periods and for the other 2 treatment groups. Points plotted correspond to (x, y) = (geometric mean of ISI0, geometric mean of CIR30) at each of the time-periods. (A) Points represent geometric means of insulin sensitivity and secretion for participants before they developed diabetes, ie, L0 = ILS at baseline, LY1 = ILS at year 1, LY2 = ILS at year 2, LY3 = ILS at year 3; M0 = metformin at baseline, MY1 = metformin at year 1, MY2 = metformin at year 2, MY3 = metformin at year 3; P0 = placebo at baseline, PY1 = placebo at year 1, PY2 = placebo at year 2, PY3 = placebo at year 3. (B) Squares represent geometric means of insulin sensitivity and secretion for participants diagnosed with diabetes at yearly visit of diagnosis; triangles represent baseline values of insulin secretion and sensitivity for participants diagnosed with diabetes at yearly visits 1, 2, and 3; black circle represents baseline average insulin secretion and sensitivity for all participants.
Figure 4A includes data from all examinations in participants without diabetes, whether they subsequently developed diabetes or not. By contrast, Fig. 4B includes data from those who developed diabetes at years 1, 2, or 3. It shows the geometric means of insulin secretion and sensitivity for subjects diagnosed with diabetes at the yearly visit of diagnosis and the geometric means of their baseline values. Generally, the points representing insulin secretion and sensitivity at baseline were below and to the left of the overall baseline curve. Then, at time of diagnosis, they had moved further below and to the left, representing deterioration in both insulin sensitivity and compensatory insulin secretion. Descriptive statistics of participants diagnosed with diabetes during visits at years 1, 2, and 3 are shown elsewhere (16).
Weight Change From Baseline and the Relationship Between Insulin Secretion and Sensitivity at Years 1, 2, and 3
At year 1, the relationship between insulin sensitivity and secretion was examined within each treatment among 3 groups based on weight change from baseline. Weight change Group 1 contained participants who lost the most weight, Group 2 contained participants who lost the least weight, and Group 3 those who gained weight. Figure 5 shows the weight change groups’ lines and curves describing the relationship between insulin secretion and sensitivity in each treatment at year 1, as well as the number of participants from each weight change group (since groups 1, 2, and 3 were formed based solely on weight change without accounting for treatment, proportions of participants in each weight change group differ between treatment groups). The slopes for lines describing the relationship between ln(CIR30) and ln(ISI0) were not significantly different across weight change groups within all treatment groups (ILS: P = .776; metformin: P = .354; placebo: P = .256) but the intercepts were (ILS: P < .0001; metformin: P < .0001; placebo: P < .0001). Thus, within each treatment, the relationship differed based on weight change group at year 1; similar results were obtained for weight change groups at years 2 and 3 (see (16)). At year 1, in all treatment groups, the curves representing Group 1 were above and to the right of the curves representing Group 2, which were above and to the right of the curves representing Group 3. Similar patterns for these curves were observed at years 2 and 3 (16), where Group 1 also included participants who lost the most weight, Group 2 those who lost the least weight, and Group 3 those who gained weight by the time of each of these examinations. Thus, with weight loss, insulin sensitivity and insulin secretion improved at years 1, 2, and 3.
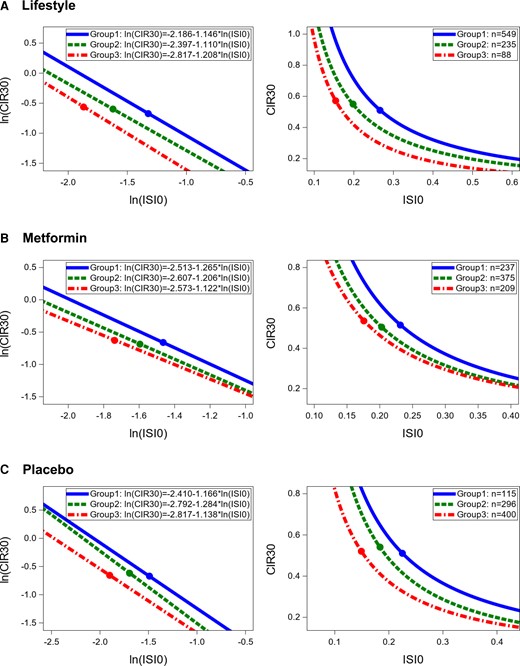
Relationship between insulin secretion and sensitivity by group of weight change from baseline to year 1. Left panels present comparisons in logarithmic scale and right panel in original scale. Group 1 includes those who lost the most weight from baseline to year 1. Group 2 includes those who lost the least weight from baseline to year 1. Group 3 includes those who gained weight from baseline to year 1. The points on each line represent the mean values of ln(CIR30) and ln(ISI0).
Association of Treatment and Weight Loss With Distances Away From Baseline SMA Line and Along Baseline SMA Line
Distances away from and along the baseline SMA line were calculated with respect to the baseline SMA line fitted to all participants, in other words, ln(CIR30) = −2.725 − 1.147*ln(ISI0). Table 2 presents the results of the cross-sectional linear regression models for distances away from the baseline SMA line and distances along the baseline SMA line fitted at years 1, 2, and 3 to determine whether weight change explained the effects of ILS and metformin on both distances. At each year, the distances away from the baseline SMA line (changes in compensatory insulin secretion) were mostly explained by the weight loss from baseline at that year. The treatment effects for both ILS and metformin were attenuated once we added weight loss to the models. For the distances along the baseline line (insulin secretory demand), adding weight loss to the models attenuated the effects of ILS on them in all 3 years; this also happened for metformin but to a lesser extent.
Cross-sectional association of treatment and weight loss with distances away from the baseline SMA line and along the baseline SMA line
| Outcome | Year of measurement | Model 1 | Model 2 | |||||
|---|---|---|---|---|---|---|---|---|
| ILS | Metformin | Adjusted R2 | ILS | Metformin | 5-kg weight loss | Adjusted R2 | ||
| Distance away from baseline SMA line | Year 1 | 0.567 (0.464, 0.671) (P < .0001) | 0.307 (0.202, 0.412) (P < .0001) | 0.175 | 0.182 (0.072, 0.292) (P = .0012) | 0.176 (0.077, 0.280) (P = .0006) | 0.297 (0.260, 0.334) (P < .0001) | 0.250 |
| Year 2 | 0.357 (0.248, 0.465) (P < .0001) | 0.107 (−0.004, 0.217) (P = .0581) | 0.165 | 0.057 (−0.053, 0.167) (P = .3144) | 0.011 (−0.095, 0.117) (P = .842) | 0.268 (0.233, 0.302) (P < .0001) | 0.242 | |
| Year 3 | 0.190 (0.052, 0.329) (P = .0071) | 0.092 (−0.050, 0.234) (P = .2056) | 0.157 | −0.034 (−0.170, 0.103) (P = .6303) | 0.031 (−0.104, 0.167) (P = .6483) | 0.242 (0.202, 0.282) (P < .0001) | 0.240 | |
| Distance along the baseline SMA line | Year 1 | −0.264 (−0.335, −1.194) (P < .0001) | −0.191 (−0.262, −0.119) (P < .0001) | 0.456 | −0.059 (−0.135, 0.016) (P = .1243) | −0.122 (−0.192, −0.052) (P = .0007) | −0.158 (−0.183, −0.132) (P < .0001) | 0.487 |
| Year 2 | −0.249 (−0.325, −0.174) (P < .0001) | −0.131 (−0.208, −0.054) (P = .0009) | 0.429 | −0.071 (−0.148, 0.007) (P = .0752) | −0.073 (−0.148, 0.002) (P = .0567) | −0.159 (−0.183, −0.134) (P < .0001) | 0.467 | |
| Year 3 | −0.256 (−0.354, −0.158) (P < .0001) | −0.181 (−0.282, −0.081) (P = .0004) | 0.439 | −0.122 (−0.220, −0.023) (P = .0152) | −0.144 (−0.241, −0.047) (P = .0037) | −0.144 (−0.173, −0.115) (P < .0001) | 0.478 | |
For distance away from the baseline SMA line, Model 1 included sex, age at baseline, race/ethnicity, treatment, baseline distance away from the baseline SMA line, and baseline weight; Model 2 included weight change at year of measurement in addition to the variables in Model 1. For distance along the baseline SMA line, Model 1 included sex, age at baseline, race/ethnicity, treatment, baseline distance along the baseline SMA line, and baseline weight; Model 2 included weight change at year of measurement in addition to the variables in Model 1.
There was a significant interaction between time and treatment when modeling both the longitudinal trajectories of compensatory insulin secretion (distances away from the baseline SMA line, P < .0001) and insulin secretory demand (distances along the baseline SMA line, P < .0001, Fig. 2I and 2J). Weight change had significant longitudinal associations with compensatory insulin secretion (P < .0001) and the insulin secretory demand (P < .0001). Longitudinally, decreases in weight associated with significantly increased compensatory insulin secretion (b = 0.287 SD, 95% CI 0.261, 0.314/5 kg loss) and significantly decreased insulin secretory demand (b = −0.144 SD; 95% CI −0.162, −0.125/5 kg loss). Figure 6A-6C shows how a point representing a participant with average (geometric mean) insulin secretion and sensitivity at baseline in the ILS, metformin, and placebo interventions, respectively, would be predicted to move at 1 year after randomization depending on weight changes. In all treatment groups, a 5-kg and a 10-kg decrease in weight would move the point to the right of the overall baseline curve fitted to all participants. In all treatment groups, a 5-kg and a 10-kg increase in weight would move the point to the left of the baseline curve. In both the ILS and metformin groups, but not the placebo, stable weight (ie, change = 0) was associated with some improvement in secretory demand and/or compensatory secretion. For year 1, predicted distances away from and along the baseline SMA line and their 95% CIs are presented elsewhere (Table S4 (16)).
Time-dependent Associations of Distances Away From the Line and Along the Line With Type 2 Diabetes
Table 3 presents associations of time-dependent compensatory insulin secretion and insulin secretory demand with diabetes risk adjusted for sex, baseline age, race/ethnicity, and treatment for the TVCM and the JM. Both models found a time-dependent association between compensatory insulin secretion with the risk of diabetes, and suggested that at any point in time an increase in compensatory insulin secretion (ie, the distance away from the line) significantly decreased diabetes risk. Only the TVCM indicated that the insulin secretory demand (distance along the SMA line) associated significantly with the risk of diabetes, although the point estimates of the effect were very similar between the TVCM and JM analyses.
Time-dependent associations of insulin secretory demand and insulin secretion compensation with transition from IGR to type 2 diabetes
| Variable | Time-varying Cox Model Estimated HR (95% CI) | Joint model Estimated HR (95% Cred. I) |
|---|---|---|
| ILS | 0.667 (0.541, 0.822) | 0.942 (0.741, 1.221) |
| Metformin | 0.893 (0.741, 1.077) | 1.069 (0.852, 1.336) |
| Distance away from SMA line (insulin secretion compensation) | 0.501 (0.478, 0.525) | 0.155 (0.124, 0.192) |
| Distance along SMA line (insulin secretory demand) | 1.155 (1.065, 1.251) | 1.116 (0.970, 1.271) |
Hazard ratios for distances away from the line and along the line are calculated per 1 baseline SD. Models adjusted for baseline covariates sex, age, and race/ethnicity. Time-varying Cox models assume that covariates only change at time of examination while joint models used a mixed model to estimate the trajectory over time of the time-dependent covariates (ie, they estimate underlying true values of time-dependent covariates at any point in time). Joint models were fitted using a Bayesian framework and 95% Cred. I refers to 95% credible interval.
Table 4 presents the results of adding weight change from baseline as a time-dependent covariate and baseline weight as a fixed covariate to the models in Table 3. When adding these variables, both models indicated that an increase in compensatory insulin secretion significantly reduced diabetes risk at any point in time. Neither model found time-dependent associations of insulin secretory demand with diabetes risk. Both models indicated that 5-kg decreases in weight from baseline significantly decreased diabetes risk.
Time-dependent associations of weight change, insulin secretory demand, and insulin secretion compensation with transition from IGR to type 2 diabetes
| Variable | Time-varying Cox Model Estimate HR (95% CI) | Joint model Estimate HR (95% Cred. I) |
|---|---|---|
| ILS | 0.871 (0.703, 1.080) | 1.149 (0.878, 1.507) |
| Metformin | 0.994 (0.823, 1.201) | 1.159 (0.923, 1.462) |
| Baseline weight | 0.990 (0.968, 1.012) | 1.032 (1.000, 1.062) |
| Distance away from SMA line (insulin secretion compensation) | 0.514 (0.490, 0.540) | 0.166 (0.133, 0.206) |
| Distance along SMA line(insulin secretory demand) | 1.064 (0.976, 1.160) | 1.117 (0.951, 1.310) |
| Weight loss from baseline | 0.624 (0.569, 0.684) | 0.710 (0.613, 0.819) |
Hazard ratios for distances away from the line and along the line are calculated per 1 baseline SD. Hazard ratios for baseline weight and weight gain from baseline are calculated per 5-kg decrease. Models adjusted for baseline covariates sex, age, and race/ethnicity. Time-varying Cox models assume that covariates only change at time of examination while joint models used a mixed model to estimate the trajectory over time of the time-dependent covariates (ie, they estimate underlying true values of time-dependent covariates at any point in time). Joint models were fitted using a Bayesian framework and 95% Cred. I. refers to 95% credible interval.
All TVCMs and JMs indicated that metformin did not reduce diabetes risk compared with placebo with adjustment for changes in compensatory insulin secretion and secretory demand (Tables 3 and 4). Only the TVCM that did not adjust for baseline weight and weight change from baseline indicated that ILS significantly reduced diabetes risk compared with placebo (Tables 3 and 4). All JMs indicated that ILS did not significantly reduce the risk of diabetes compared with placebo when adjusted for distances away and along the SMA line (Tables 3 and 4).
Insulin secretion compensation combined with insulin secretory demand and baseline weight combined with weight loss mediated the ILS and metformin effects on the risk of diabetes. The percentage effects mediated were calculated using HRs from the 4 models shown in Table 5. According to the TVCMs, the changes in compensatory insulin secretion and the secretory demand combined mediated 44% and 63% of the ILS and metformin effects, respectively, while in the JMs they mediated 92% of the ILS effect and completely mediated the metformin effect. In both the TVCMs and the JMs, baseline weight and weight loss from baseline mediated over 49% of the effects of both treatments (53% for ILS and 50% metformin in the TVCM; 82% for ILS and 72% for metformin in the JM). In the TVCM, all these covariates together (model 4) mediated 81% and 98% of the ILS and metformin effects, respectively, and in the JM, they completely mediated the effects of both treatments; once we accounted for all the covariates together, the hazard ratios for ILS and metformin treatment effects exceeded 1 but not significantly. Also, in the JMs with all variables of interest (model 4), weight change from baseline did not attenuate the association of the changes in compensatory insulin secretion and insulin secretory demand with the risk of diabetes (from model 2), but they did attenuate the association of weight loss from baseline with the risk of diabetes (from model 3).
Comparing different models studying risk of diabetes
| Variables | Model 1 | Model 2 (TVCM) | Model 2 (JM) | Model 3 (TVCM) | Model 3 (JM) | Model 4 (TVCM) | Model 4 (JM) |
|---|---|---|---|---|---|---|---|
| HR (95% CI) | HR(95% CI) | HR (95% Cred. I) | HR (95% CI) | HR (95% Cred. I) | HR (95% CI) | HR (95% Cred. I) | |
| ILS | 0.483 (0.393, 0.592) | 0.667 (0.541, 0.822) | 0.942 (0.741, 1.221) | 0.711 (0.575, 0.879) | 0.876 (0.705, 1.094) | 0.871 (0.703, 1.080) | 1.149 (0.878, 1.507) |
| Metformin | 0.738 (0.614, 0.886) | 0.893 (0.741, 1.077) | 1.069 (0.852, 1.336) | 0.859 (0.713, 1.033) | 0.919 (0.763, 1.105) | 0.994 (0.823, 1.201) | 1.159 (0.923, 1.462) |
| Distance away from SMA line | ** | 0.501 (0.478, 0.525) | 0.155 (0.124, 0.192) | ** | ** | 0.514 (0.490, 0.540) | 0.166 (0.133, 0.206) |
| Distance along SMA line | ** | 1.155 (1.065, 1.251) | 1.116 (0.970, 1.271) | ** | ** | 1.064 (0.976, 1.160) | 1.117 (0.951, 1.310) |
| Baseline weight | ** | ** | ** | 1.049 (1.029, 1.070) | 1.047 (1.030, 1.073) | 0.990 (0.968, 1.012) | 1.032 (1.000, 1.062) |
| Weight loss from baseline | ** | ** | ** | 0.581 (0.535, 0.632) | 0.528 (0.477, 0.583) | 0.624 (0.569, 0.684) | 0.710 (0.613, 0.819) |
Model 1 is the baseline model and includes sex, age at baseline, race/ethnicity, and treatment group and is the reference model used to determine the proportion of treatment effects mediated by the time-dependent covariates. Model 2 includes time-dependent distances away from the SMA line and time-dependent distances along the SMA line in addition to the covariates included in Model 1. Model 3 includes baseline weight and time-dependent weight loss from baseline in addition to the covariates included in Model 1. Model 4 includes time-dependent distances away from the SMA line, time-dependent distances along the SMA line, baseline weight, and time-dependent weight loss from baseline in addition to covariates included in Model 1. Models 2, 3, and 4 were fitted using time-varying Cox models (TVCM) and joint models (JM) for time-to-event and multivariate longitudinal data. JMs were fitted using a Bayesian approach, thus HRs are presented as point estimates with 95% Credible interval (95% Cred. I) from posterior distributions.
Discussion
In DPP participants, weight loss was more pronounced from baseline to year 1 for those assigned to ILS or metformin (10). In general, beneficial changes in most longitudinal variables, including weight loss, were greatest from baseline to year 1, and after year 1 they tended to return toward baseline. Over time, the beneficial changes in plasma glucose, serum insulin, insulin sensitivity, and insulin secretion compensation followed a similar pattern to that of weight loss, suggesting that weight loss drives such changes. ILS participants experienced the most beneficial changes over time, followed by metformin participants; such findings are consistent with the reduced incidence of diabetes in both groups.
As expected, the relationship between insulin secretion and sensitivity (ie, beta-cell function) changed over time for ILS and metformin participants, but not for those in placebo. The curves representing this relationship for ILS and metformin participants at years 1, 2, and 3 after randomization were above and to the right of the baseline curves, indicating that these 2 treatments improved insulin sensitivity and beta-cell function. These curves and the average insulin secretion and sensitivity showed that for both treatments, the biggest movement to the right occurred from baseline to year 1. For both treatments, the curves for years 2 and 3 moved to the left of the curve for year 1 ending between the baseline and year 1 curves. This suggested that improvements in insulin sensitivity and beta-cell function were more prominent from baseline to year 1; however, as for weight loss, the effects of both ILS and metformin were attenuated after year 1. At each time-period, average insulin sensitivity and beta-cell function were best for ILS participants, followed by participants in the metformin group which were better than for placebo participants.
Weight changes from baseline associated longitudinally with trajectories of compensatory insulin secretion and insulin secretory demand (distances away from the line and along the line, respectively). In general, weight loss contributed to rightward movements from the curve describing beta-cell function at baseline, while weight gain resulted in leftward movements. In all 3 treatment groups, weight loss significantly improved compensatory insulin secretion (increased the distances away from the line) and with that the degree of glucose homeostasis which resulted in lower levels of glycemia. Weight loss significantly decreased the degree of insulin secretory demand (decreased distances along the line) and in doing so reduced the physiologic stress of the beta-cells when trying to compensate for diminished insulin sensitivity. Weight gain did the opposite.
Beneficial weight loss effects in insulin secretion compensation were greater in the ILS intervention than in metformin (predicted distances away from the baseline SMA line at year 1 were greater for ILS, Table S4 (16)). For the same levels of weight loss, metformin decreased insulin secretory demand more than ILS (predicted distances along the baseline SMA line were smaller for metformin, Table S4 (16)). In Fig. 6, points representing 5- and 10-kg decreases in weight for ILS were further to the right of the baseline beta-cell function curve than points representing these decreases for metformin. Points representing 5- and 10-kg increases in weight for metformin were more to the left of the baseline beta-cell function curve than points representing these increases in ILS. In the ILS and metformin groups, no change in weight would still move the point to the right of the baseline curve. This might reflect beneficial effects of these 2 interventions on compensatory insulin secretion and insulin secretory demand that are unrelated to weight change. These results are consistent with previous DPP analyses showing that effects of the ILS and metformin interventions on reducing diabetes incidence were largely, but not entirely, attributed to weight loss (12, 13).
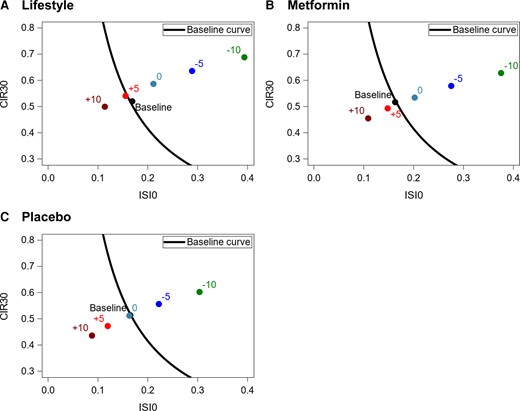
Change in weight and its longitudinal effect on changes in position with respect to baseline curve. The baseline curve shown in all 3 panels is the same; the curve fitted to all participants together at baseline obtained by exponentiating ln(CIR30) = −2.272 − 1.147*ln(ISI0), ie, baseline SMA line for all participants. (A) For ILS, distances away and along the baseline SMA line at 1 year after randomization were calculated based on the multivariate linear mixed effects (MLME) model fitted to the whole dataset at the mean value for all baseline covariates for participants randomized to ILS (male = 0.33, baseline age = 50.92 years, Black = 0.199, Hispanic = 0.172, other race = 0.064, White = 0.565, baseline weight = 94.40 kg). (B) For metformin intervention, distances away and along the baseline SMA line at 3.2 years after randomization were calculated based on the MLME fitted to the whole dataset at the mean value for all baseline covariates for participants randomized to metformin (male = 0.347, baseline age = 51.11 years, Black = 0.218, Hispanic = 0.160, other race = 0.040, White = 0.582, baseline weight = 94.55 kg). (C) For placebo, distances away and along the baseline SMA line at 3.2 years after randomization were calculated based on the MLME fitted to the whole dataset at the mean value for all baseline covariates for participants randomized to placebo (male = 0.322, baseline age = 50.60 years, Black = 0.215, Hispanic = 0.166. other race = 0.056, White = 0.563, baseline weight = 94.95 kg).
Baseline compensatory insulin secretion and insulin secretory demand (estimated by distances away from and along the SMA line, respectively) were associated with risk of developing diabetes in American Indians in a previous study (9). In the present study, all models found time-dependent associations of compensatory insulin secretion and of weight change from baseline with the risk of developing diabetes. In all these models, an increase in estimated insulin secretion compensation (increase in distances away from the SMA line) significantly decreased diabetes risk (ie, improvements in degree of glucose homeostasis reduced the risk of diabetes), which is consistent with the associations found using baseline measurements from American Indians (9). Not all models led to the same conclusions about the time-dependent association of insulin secretory demand with diabetes risk; only some found an association. However, the models that found this association suggested that an increase in insulin secretory demand (increase in distances along the SMA line) increased diabetes risk (ie, increase in beta-cell stress when responding to decreases in insulin sensitivity increased diabetes risk), which is also consistent with findings in American Indians (9). A 5-kg decrease in weight from baseline significantly decreased diabetes risk; this is consistent with movements up and to the right of the baseline curve per 5-kg decreases in weight in Fig. 6, since such movement reduces diabetes risk (9). According to all models, the changes in compensatory insulin secretion were stronger determinants of risk than insulin secretory demand and weight change. This suggests that the inability of beta-cells to adequately compensate for changes in insulin sensitivity was the strongest determinant of diabetes risk at any point in time. The obvious difference in parameter estimates for the HR of estimated insulin secretion compensation (distances away from the SMA line), and the conclusions reached for insulin secretory demand (distances along the SMA line) between the TVCMs and the JMs might be due to the ways in which they approximate the longitudinal trajectories of these covariates. The TVCMs assumed that the insulin secretion compensation (distances away from the SMA line) stayed constant in between visits, which is biologically unlikely, and approximated the longitudinal trajectories using a step function that does not capture trends between visits. The JM possibly corrected this shortcoming by estimating the longitudinal trajectories of compensatory insulin secretion. Similar situations may have occurred for the other time-dependent covariates. When adjusted for compensatory insulin secretion and insulin secretory demand, the TVCMs did not find an effect of metformin on diabetes risk and the JMs did not find an effect of the ILS or metformin. However, Fig. 1A, 1I, and 1J indicated that these 2 treatments decreased weight from baseline and insulin secretory demand and increased compensatory insulin secretion. Our results show that the effects of the ILS and metformin compared with placebo were largely mediated by the longitudinal trajectories of weight change from baseline, insulin secretory demand, and compensatory insulin secretion. In general, compensatory insulin secretion and insulin secretory demand together mediated the metformin effect on diabetes risk more than the ILS effect, while baseline weight and weight loss from baseline mediated the ILS effect more than the metformin effect.
There were only small changes, on average, in insulin sensitivity and secretion in the placebo group (Figs. 3 and 4A). Nevertheless, this group experienced a high incidence rate of diabetes (11 cases/100 person-years) (10). This perhaps surprising result may be due to the restriction of the insulin sensitivity and secretion analysis to participants who remained without diabetes. We restricted analyses to such persons to avoid effects of changes in insulin dynamics caused by diabetes or its treatments. Thus, the results shown apply only to examinations prior to the diagnosis of diabetes. By contrast, at the first examination with diabetes, insulin sensitivity and secretion had moved to the left and down, in other words, worsened, from their baseline relationship in all treatment groups (Fig. 4B).
This study investigated the progression of insulin secretion deficiency and decreased insulin sensitivity during the transition from IGR to diabetes and allowed us to understand how these factors interact with one another and what affects their interaction. Previous DPP studies only investigated the relationship of interest at baseline and year 1, while we also studied it at years 2 and 3. Previous studies estimated the lines used to describe this relationship using ordinary least squares regression. By doing so, they only accounted for variability in insulin secretion. Using SMA regression allowed us to account for variability in both variables when estimating these lines. We expanded the results of previous DPP studies, by describing the effects of weight loss on the pathogenesis of diabetes through its association with the development of abnormalities in insulin secretion and sensitivity. These abnormalities are summarized through the concepts of estimated insulin secretory demand and compensatory insulin secretion which we defined in terms of the baseline SMA line. Additionally, the use of JMs for time-to-event and multivariate longitudinal data allowed us to relate the underlying true values of insulin secretion compensation and insulin secretory demand with the risk of diabetes at any point in time without having to assume that these variables only changed at the time of yearly visits.
Our results extend previous DPP analyses that concluded that interventions to reduce the risk of diabetes should aim at weight loss as the primary determinant of success (12). The current results suggest that this success is achieved through improved insulin sensitivity (decreased insulin secretory demand) coupled with increased insulin secretion relative to demand.
Acknowledgments
The Diabetes Prevention Program (DPP) was conducted by the DPP Research Group and supported by the National Institute of Diabetes and Digestive and Kidney Diseases (NIDDK), the General Clinical Research Center Program, the National Institute of Child Health and Human Development (NICHD), the National Institute on Aging (NIA), the Office of Research on Women's Health, the Office of Research on Minority Health, the Centers for Disease Control and Prevention (CDC), and the American Diabetes Association. The data (and samples) from the DPP were supplied by the NIDDK Central Repository. This manuscript was not prepared under the auspices of the DPP and does not represent analyses or conclusions of the DPP Research Group, the NIDDK Central Repository, or the NIH.
Funding
The analysis for this paper was supported by the Intramural Research Program of the National Institute of Diabetes and Digestive and Kidney Diseases (NIDDK). DPP was supported by NIDDK and other agencies.
Author Contributions
E.V.A., W.C.K., and R.L.H. designed the study. E.V.A. managed the data, conducted statistical analysis, and wrote the first draft of the manuscript. All authors contributed to the interpretation of the data. All authors reviewed and edited the manuscript and approved the final version. All authors had final responsibility for the decision to submit for publication. E.V.A. is the guarantor of this work and, as such, had full access to all the data in the study and takes responsibility for the integrity of the data and the accuracy of the data analysis.
Disclosures
The authors have no conflicts of interest relevant to this article to disclose.
This study presents a secondary analysis of the Diabetes Prevention program ClinicalTrials.gov registration no. NCT00004992).
Data Availability
Original data analyzed during this study are included in the data repositories listed in the references.
References
Abbreviations
- BCDI
a beta-cell demand index
- DI
disposition index
- DPP
Diabetes Prevention Program
- ILS
intensive lifestyle intervention
- FPG
fasting plasma glucose
- HR
hazard ratio
- IGR
impaired glucose regulation
- JM
joint model
- NGR
normal glucose regulation
- OGTT
oral glucose tolerance test
- SMA
standardized major axis
- TVCM
time-varying Cox models
